😟 Are We On The Verge Of a Recession?
Given the warning signs from economic indicators and the increasing market volatility, the upcoming question on many minds is: Are we on the verge of a recession? In this analysis, we will delve into vital economic signals, from the inverted yield curve to insider trading patterns, in order to gain a comprehensive understanding of our current economic landscape and its potential trajectory.
📢 Dear reader, if you're a Telegram user, feel free to join our free Telegram channel right now 👉 https://t.me/longtermpick There you will find lots of insights absent on the website!
⤵️ The Inverted Yield Curve: A Key Indicator
One of the most talked-about recession indicators is the inverted yield curve. But what exactly is it, and why does it matter?
A yield is the interest you receive when you lend money. Governments borrow money by selling bonds, and the interest rate on these bonds is their yield. Typically, lending money for a longer time earns you more interest than lending for a short time. When we plot the yields for different lending times, the line usually slopes upward. This is a normal yield curve.
📰 To Read: Inverted Yield Curve: Definition, What It Can Tell Investors, and Examples
However, sometimes this pattern reverses. When short-term loans offer higher interest than long-term loans, we have an inverted yield curve. This rare occurrence often signals potential economic trouble.
The image above shows the current US Treasury Yield Curve. As we can see, the curve is relatively flat, with short-term rates higher than some longer-term rates. This shape is concerning to economists and investors.
🏦 Why the Yield Curve Matters
The yield curve isn't just a line on a graph - it's a powerful economic indicator. Its importance lies in its ability to predict recessions. Over the past 50 years, every time the yield curve has inverted, a recession has followed within about 1-2 years. It's like an economic smoke alarm, warning us of potential danger ahead.
📰 To Read: US Treasury Yield Curve (updated daily)
An inverted curve also provides insight into investor sentiment. When it occurs, it suggests that investors expect economic problems in the future. This expectation can become a self-fulfilling prophecy as it influences business decisions. Companies might delay big projects, further slowing economic growth.
The banking sector is particularly sensitive to yield curve inversions. Banks profit by borrowing short-term and lending long-term. An inverted curve can squeeze their profits, potentially leading to tighter lending conditions and slowing the economy even further.
This historical view of US Treasury yields provides context for our current situation. The image shows yield curves from different years leading up to the 2008 financial crisis. Notice how the curve flattened and eventually inverted before the recession.
📊 Recent Economic Data
Several recent economic indicators have raised concerns about a potential recession. In July, the U.S. unemployment rate increased to 4.3%, higher than expected and up from the previous month. This rise in unemployment can be an early sign of economic trouble.
Simultaneously, job creation has slowed down. July saw only 114,000 new jobs created (excluding agriculture), significantly lower than expected and a sharp decrease from the previous month. This slowdown in job creation could indicate a cooling economy.
📰 To Read: U.S. ISM Manufacturing Purchasing Managers Index (PMI)
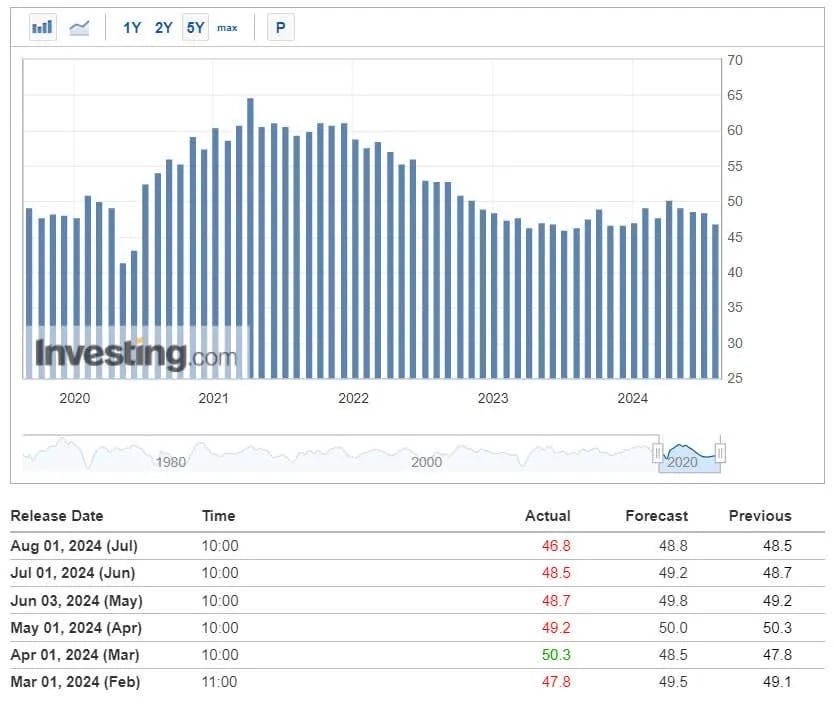
Perhaps most concerning is the latest data from the ISM Manufacturing Purchasing Managers' Index (PMI). The value came in at 46.8, much lower than expected and a decrease from the previous month. This indicator has been below the normal level of 50 for a year and a half now, and it's approaching the key recession indicator level of 45. A sustained period below 50 suggests contraction in the manufacturing sector, often a harbinger of a broader economic slowdown.
The chart above shows the ISM Manufacturing PMI over time. The recent trend below 50 is clearly visible, indicating a prolonged period of contraction in the manufacturing sector.
📅 Historical Context
Looking at past recessions helps us understand these indicators' predictive power.
This chart shows the difference between 2-year and 10-year US Treasury yields over time. When this line dips below zero, it indicates an inverted yield curve. Notice how these inversions often precede recessions (shown by the shaded areas).
📰 To Read: An inverted yield curve: why investors are watching closely
The 2020 recession triggered by the COVID-19 pandemic, the 2008-2009 Global Financial Crisis, and the 2001 dot-com bubble burst were all preceded by yield curve inversions. These examples demonstrate the reliability of the inverted yield curve as a warning sign. However, they also show that the time between warnings and actual recessions can vary significantly.
🔮 Are We Heading for a Recession?
While these indicators are concerning, predicting recessions is not an exact science. The inverted yield curve, rising unemployment, slowing job growth, and declining manufacturing activity all point towards potential economic trouble. However, even if these indicators are accurate, the onset of a recession could be months or even a year or two away.
This table provides a sobering perspective on the likelihood of a recession following a yield curve inversion. According to these calculations, the probability of a recession occurring within the next 30 months is quite high.
It's crucial to consider external factors. Global events, policy changes, or unforeseen circumstances can always impact economic trajectories. Moreover, the economy has areas of strength, such as consumer spending and technological advancements.
📊 Market Sentiment and Economic Indicators
Let's explore some additional indicators that can help us understand the current economic situation and market sentiment.
Household Financial Asset Allocation
The chart illustrates the allocation of US household financial assets over time. As of the fourth quarter of 2023, there has been a significant increase in equity investments, constituting 48% of total financial assets. This level of equity allocation is historically high, matching previous peaks seen in 2000 and 2021. High equity allocations can indicate market optimism, but they can also suggest potential vulnerability if economic conditions worsen. The current allocation suggests that households are heavily invested in the stock market, which could lead to increased financial stress if a significant market downturn occurs.
Insider Buy/Sell Ratio
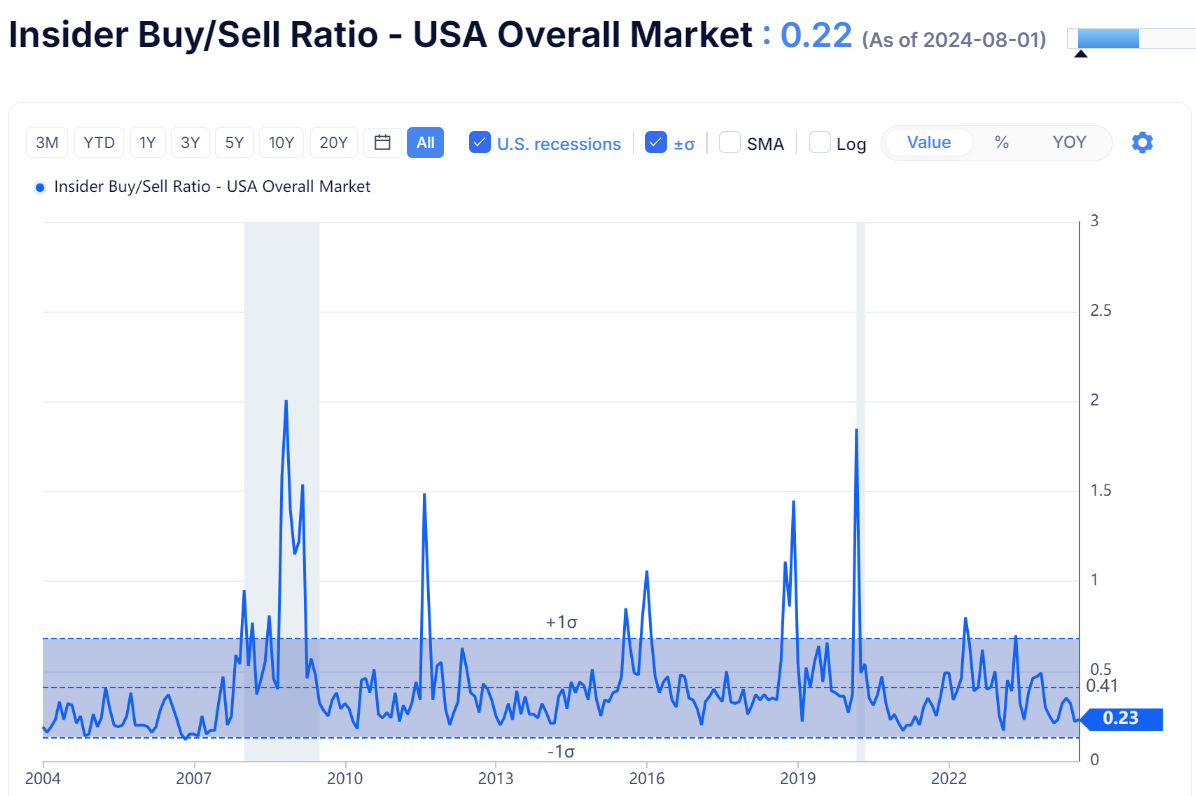
The Insider Buy/Sell Ratio for the USA Overall Market provides insight into how corporate insiders view their own companies' prospects. As of August 1, 2024, this ratio stands at 0.22, which is relatively low. When insiders are selling more than buying (as indicated by a ratio below 0.41), it can sometimes signal concerns about future corporate performance or overvaluation in the market. The current low ratio suggests that insiders may be less optimistic about their companies' near-term prospects, which could be another warning sign for the broader economy.
📰 To Read: Insider Buy/Sell Ratio - USA Overall Market
💹 Interest Rate Expectations and Monetary Policy
The Federal Reserve's decisions on interest rates play a crucial role in shaping economic conditions. Let's examine the market's expectations for future rate decisions.
Rate Cuts Probabilities
This chart displays the market's expectations for the Federal Reserve's target rate decision on September 18, 2024. There's a 62% probability of rate cuts in the 4.75-5.00% range and a 38% chance of rates being in the 5.00-5.25% range. This suggests that the market anticipates the Fed will likely implement a small rate cut. The shift in expectations towards lower rates could indicate growing concerns about economic growth, as the Fed typically lowers rates to stimulate the economy during periods of weakness.
📰 To Read: Fed Rate Monitor Tool
Expected SOFR Path
The Secured Overnight Financing Rate (SOFR) is an important benchmark that reflects the cost of borrowing cash overnight collateralized by U.S. Treasury securities. This chart shows the expected path of the three-month average SOFR. The downward slope indicates that market participants expect interest rates to gradually decrease over the next two years, potentially in response to slowing economic growth or inflation. This expectation of lower future interest rates aligns with the possibility of an economic slowdown or recession, as central banks typically ease monetary policy in response to economic weakness.
🔄 Synthesizing the Signals
When we consider all these indicators together, we get a complex picture of the economy. The yield curve inversion and low insider buy/sell ratio suggest caution about economic prospects. High household equity allocations indicate potential market vulnerability, which could exacerbate any economic downturn. Meanwhile, interest rate expectations point to a potential easing of monetary policy, which could be a response to anticipated economic weakness.
While these signals don't guarantee a recession, they do suggest that economic risks are elevated. It's important to remember that economic cycles are normal, and preparedness is key to navigating potential downturns. The combination of these indicators paints a picture of an economy that may be approaching a turning point, with several key metrics suggesting increased caution is warranted.
🚀 What Should You Do?
Given these warning signs, it's wise to be prepared.
Consider building up your emergency savings if possible. It's also a good time to review your investment portfolio to ensure it matches your risk tolerance. It's wise to be cautious about taking on new debt during uncertain economic times.
🎦 To Watch: How The Economic Machine Works by Ray Dalio
Staying updated on economic news is important, but try not to make hasty financial decisions driven by panic. It's also valuable to assess your job security and explore ways to enhance your professional skills.
Keep in mind that while these indicators may point to increased economic risk, they do not guarantee an upcoming recession. The economy is complex and influenced by multiple factors. Stay informed and prepared, but avoid letting fear dictate your financial choices. Economic cycles are a normal part of the financial landscape, and with adequate preparation, you can navigate them successfully.
This is not a financial or investing recommendation. It is solely for educational purposes.


