

TL;DR: Long Treasuries just went through the worst period in the data: 2022 was the worst year for the 10Y Treasury since 1928, and the long-term Treasury fund VUSTX fell 46% from 2020 to 2023, the most since its start in 1986. EDV, the long-bond fund I hold, is ~58% below its March 2020 peak (distributions included). In September, the Fed raised rates for the first time since 2023, and in early October, the 10Y yield reached its highest level since 2002. I hold EDV for four reasons: rate cuts, a lower portfolio beta, protection when stocks fall, and a recession hedge. History supports only the last one, and only with a condition: in the 15 down years for US stocks since 1928 with inflation below 3%, Treasuries rose in 13, while in the 11 down years with higher inflation, they lost to inflation in 9. At the same time, the price is very different from 2020: the 30Y real yield is 3.16%, while before 2026, it was never above 2.75% since the Treasury started publishing it in 2010. In my view, long bonds have a place in my portfolio as a recession hedge with a good starting yield, not as a bet on Fed cuts, and the real question is the size of the position.
What happened to long bonds in 2026
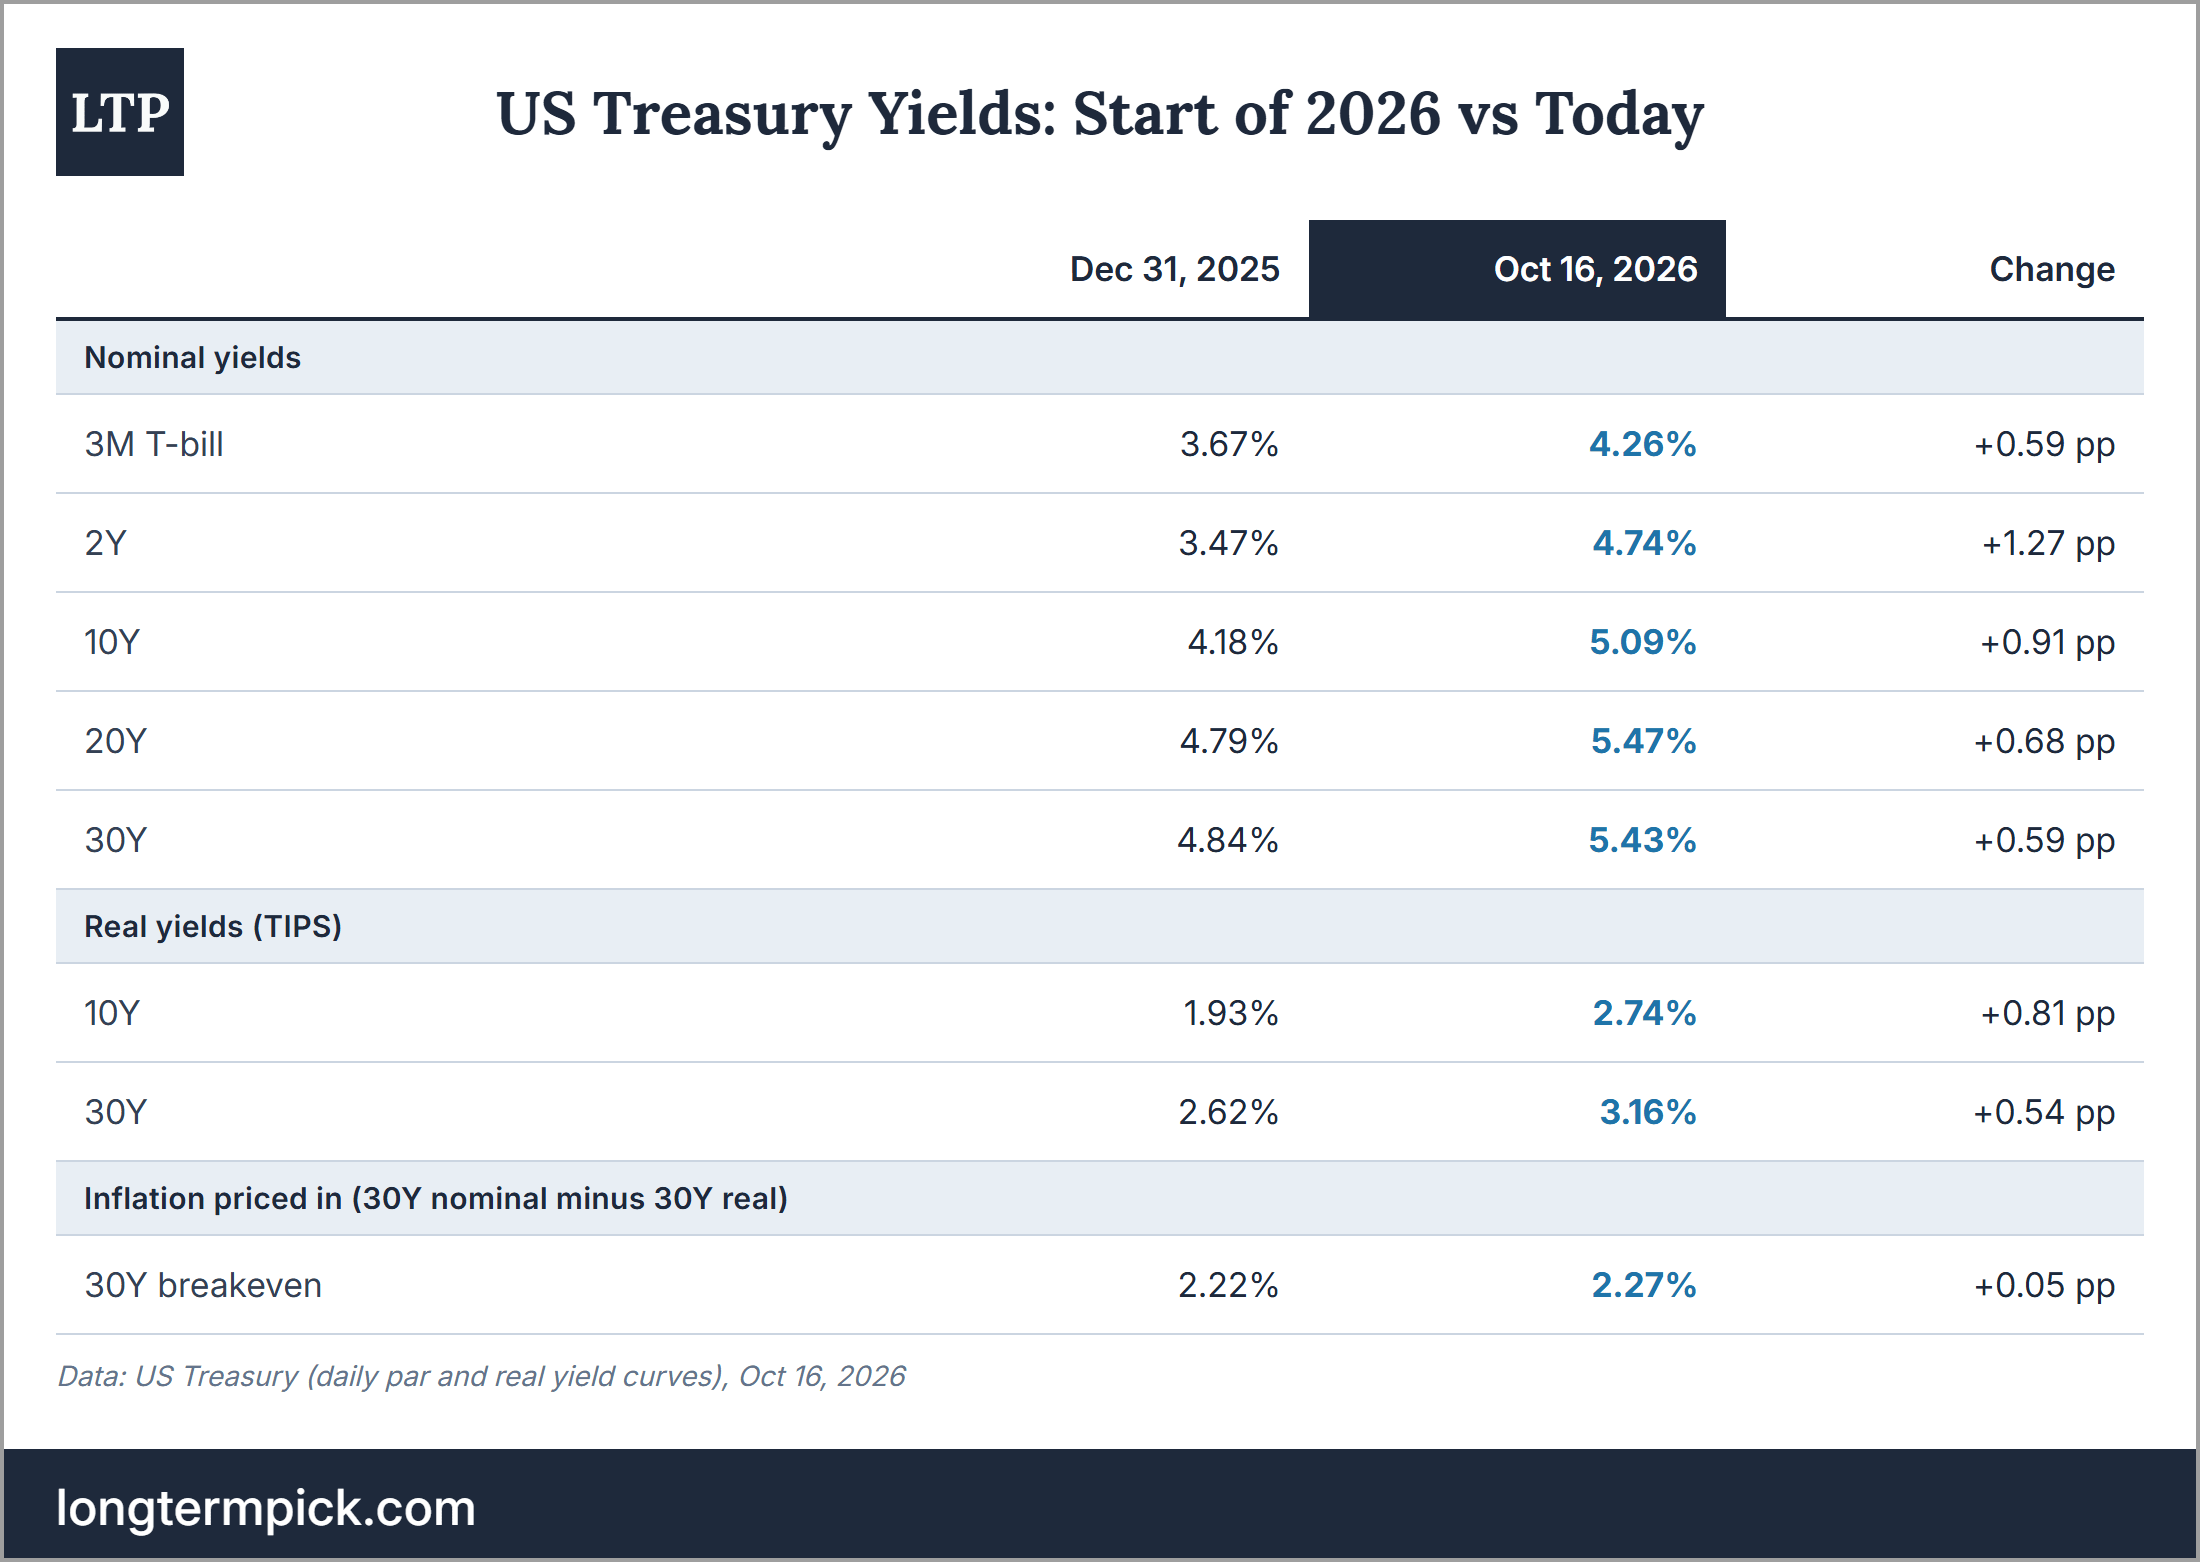
Yields increased across the whole curve, and the short end increased too. Since Dec 31, the 10Y Treasury yield increased from 4.18% to 5.09%, and the 30Y from 4.84% to 5.43%. On Oct 05, the 10Y reached 5.31%, and on Oct 07, the 20Y reached 5.71%. In the Treasury's own data, both are the highest since 2002. By Oct 16, both had come down by more than 0.2 points. At the same time, the 3M T-bill increased from 3.67% to 4.26%, and the 2Y from 3.47% to 4.74%. The market is not pricing in rate cuts anymore. It is pricing in hikes.
The Fed raised rates on Sep 16, for the first time since 2023. The vote was 12-0, and the target range moved to 3.75-4.00%. The statement is short: “Inflation remains elevated. Today’s policy action will support a timelier return to the Committee’s 2 percent goal.” According to CNBC, 16 of the 18 participants expected another hike this year, and the officials do not expect inflation at 2% before 2029. Before the next meeting on Oct 27-28, futures price in a more than 85% chance that the Fed holds, and the next hike is expected in December.
Inflation is the main reason. According to the minutes of the September meeting, Fed staff estimated that PCE inflation increased to 3.8% in August, and core PCE stayed at 3.4%. The staff attributed it mostly to past tariff increases, higher energy and input costs from geopolitical developments, and more expensive technology goods because of the AI buildout. The September CPI was hotter than expected: 3.7% YoY, up from 3.4% in August, and gasoline alone increased 9.1% in a month. Core CPI was 2.6%. Oil prices are the part that moves every day: Reuters connects the global bond selloff with the Iran war, energy costs, and government spending.
Investors also want more pay for lending for 30 years. The minutes list what the market pointed to besides the Fed: geopolitical developments, uncertainty about the Treasury’s buyback program, and competition for capital from heavy private debt issuance to finance AI infrastructure. All of it pushes up the term premium. The Treasury tried to help: in mid-August, Treasury Secretary Scott Bessent expanded the buyback program, but according to Bloomberg, it has had little sustained impact.
Worth noting what did not change: the inflation that the market expects over 30 years. The 30Y real yield (TIPS) increased from 2.62% to 3.16%, almost as much as the nominal yield. So the inflation priced in for the next 30 years moved only from 2.22% to 2.27%. The minutes say the same: longer-term inflation expectations remained stable. In other words, the market does not price a return of the 1970s. It prices a higher real price of money.
As a result, long bonds and stocks went in different directions. YTD, EDV is at -7.9% (including distributions), while the S&P 500 total return is +12.9% (Yahoo Finance, Oct 16).
What EDV is
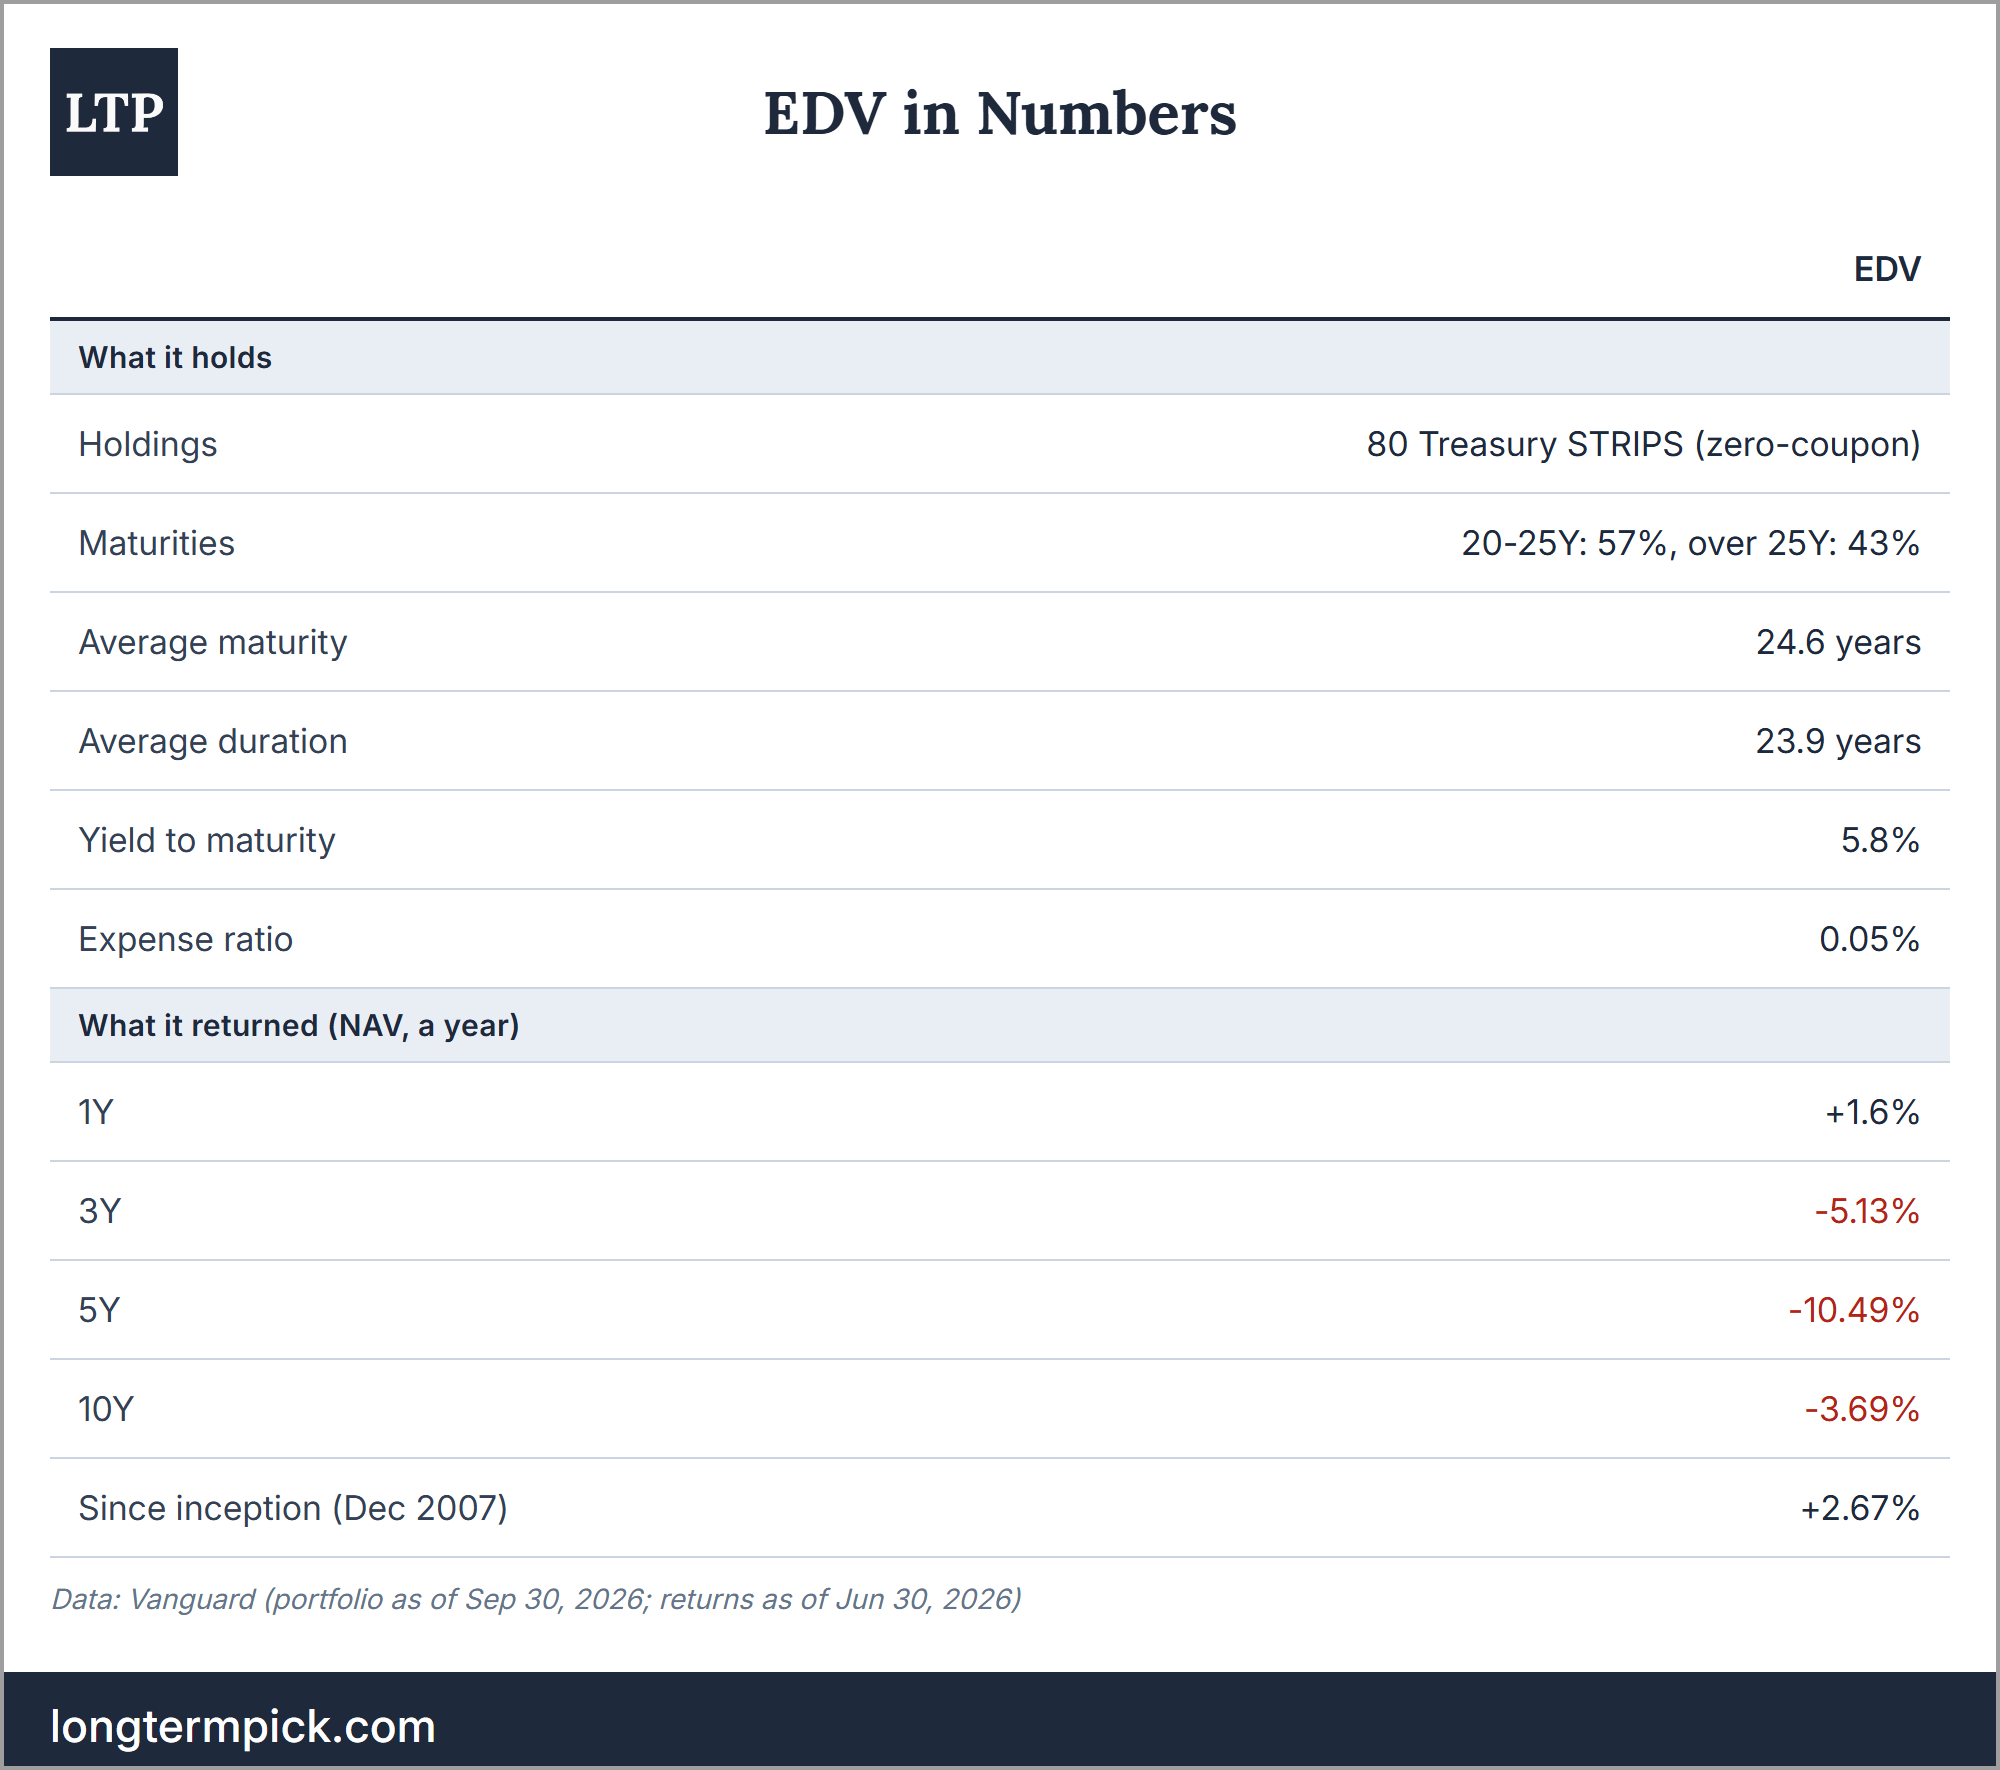
EDV holds only the longest part of the Treasury market, and not even ordinary bonds. It holds 80 Treasury STRIPS: zero-coupon securities that pay nothing until maturity and then pay everything at once. The index is the Bloomberg US Treasury STRIPS 20-30 Year Equal Par Bond Index. As of Sep 30, the average duration was 23.9 years, the yield to maturity 5.8%, and the expense ratio 0.05% (Vanguard).
Analyst’s note:
For readers in Europe: EDV, TLT and SGOV are US-listed ETFs, and European brokers often do not offer them. I did not find a UCITS ETF that holds Treasury STRIPS, so EDV has no exact analog. The closest one is the iShares $ Treasury Bond 20+yr UCITS ETF: DTLA (accumulating, ISIN IE00BFM6TC58) or IDTL (distributing). It tracks the ICE US Treasury 20+ Year Bond Index, the same index as TLT, with a 0.07% expense ratio. Its duration is 14.82 years (Oct 16), against 23.9 years for EDV, so it moves ~40% less for the same change in yields. For SGOV, the analog is the iShares $ Treasury Bond 0-3 Month UCITS ETF (US03, ISIN IE000PBKBK34, 0.07%), which holds T-bills with a duration of less than 0.1 years.
Duration 24 means that EDV moves ~24% for every 1 percentage point of change in 20-30Y yields. The move is not symmetric because of convexity: by my model, an immediate increase of 1 point costs ~21%, and a decrease of 1 point brings ~27%. That is why EDV is more volatile than the stock market. Since 2008, the annualized volatility of its daily returns was 22.2%, against 19.8% for the S&P 500. Since 2021, it was 21.0% against 16.5% (Yahoo Finance, my calculation). Vanguard itself writes that the fund “is primarily intended for institutional investors with extremely long-term liabilities.”
The long-term result is weak. According to the fact sheet (PDF), as of Jun 30, EDV returned -3.69% per year over 10 years and +2.67% per year since its start in December 2007. To compare, from Jan 29, 2008 (the first price in Yahoo Finance) to Oct 16, 2026, EDV returned 2.0% per year, and the S&P 500 returned 11.8% per year.
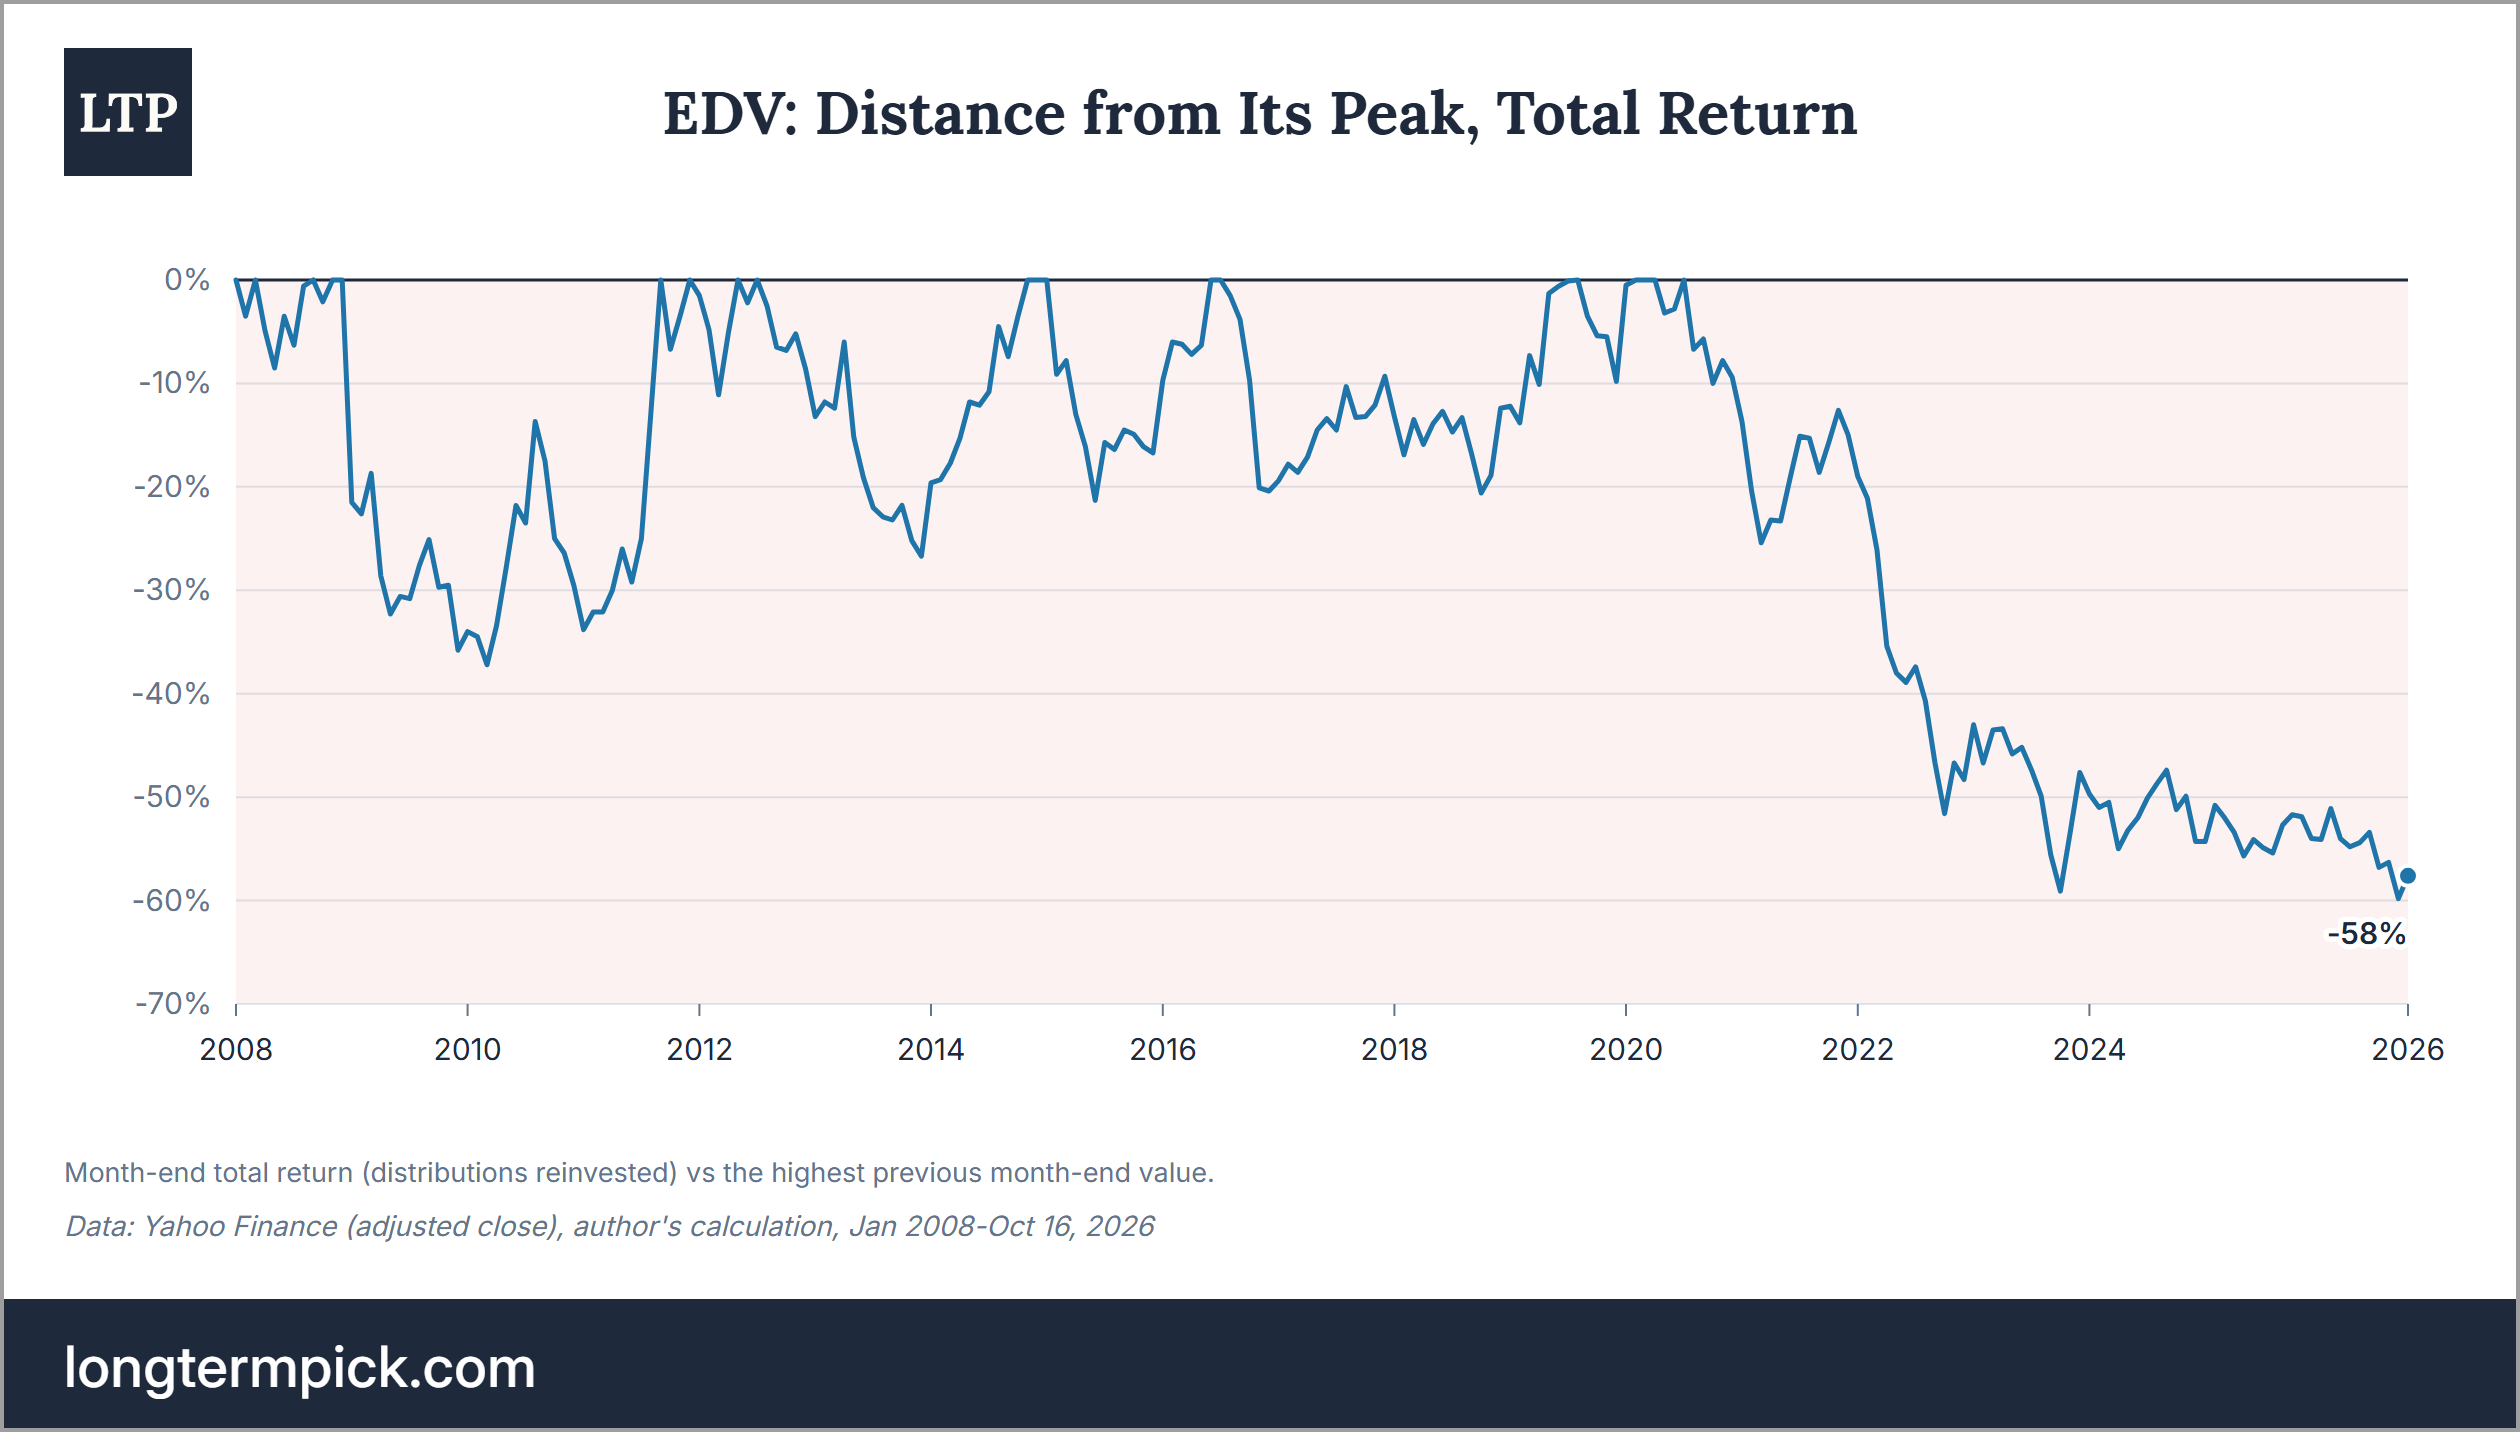
The chart shows two different stories. Until 2020, EDV had deep but temporary drawdowns: the worst was -41% from December 2008 to April 2010, and EDV was back at its high by September 2011. Then, on Mar 09, 2020, EDV reached its all-time high on the day when the 30Y yield was 0.99%. From that day, it lost up to ~60% (Oct 07), distributions included, and on Oct 16, it was ~58% below the peak.
