
📝 LTP Notes 002: Wind Power Takes the Lead Over Coal, Google's $300B Revolution, The ROIC Advantage, and Others
Some investing notes that may help you gain insights or make long-term decisions.


💨 Wind Power Takes the Lead Over Coal

In a significant shift, wind energy is now generating more electricity in the US than coal. The chart shows a clear decline in coal-generated electricity since the mid-2000s, contrasted by a steady rise in wind power. By 2023, wind energy surpassed coal in terms of megawatt-hours produced.
This trend highlights the growing importance of renewable energy sources in the US energy mix. The increase in wind power generation reflects advancements in technology and a shift towards more sustainable energy solutions, while the decline in coal usage underscores the nation's move away from fossil fuels.
🔍 Google's $300B Revolution

Google's (GOOGL) journey from $3B to $311B in 20 years is a masterclass in tech dominance. Starting with Android ($50M) and YouTube ($1.65B) in the mid-2000s, they've strategically acquired game-changers like Motorola, Nest, DeepMind, and Fitbit.
Each purchase fueled exponential growth, transforming Google from a search engine into Alphabet - a diversified tech powerhouse. A story of relentless expansion and smart bets on emerging technologies.
📈 The ROIC Advantage

High ROIC companies deliver superior returns over time. This chart shows the stark difference in growth between a company with 30% ROIC (Company X) versus one with 10% ROIC (Company Y), both reinvesting 50% of profits.
Starting with $100, Company X's value soars to $105.54 after 10 years, while Company Y crawls to just $15.51. The compounding effect is clear – higher ROIC leads to exponentially greater wealth creation, even with identical reinvestment rates.
📊 The S&P 500's 5-Year Volatility Journey

The S&P 500's daily returns from 2020 to 2024 reveal a fascinating story of market volatility and stability. 2020 stands out with wild swings, dots scattered from -12% to +8%. 2021 and 2022 show tighter clusters, suggesting more consistent performance. 2023 marks a turning point - the last >2% drop was on Feb 21, 2023.
Fast forward to 2024, and we see a remarkably tight cluster, with only one day (Feb 22) breaking the 2% threshold. This visual perfectly captures how US stocks have indeed been "chill" in 2024, displaying unusually low volatility compared to recent years.
🏠 Millennials Drive Housing Market Shift

Millennials are leading a surprising homeownership surge. From 2016 to 2022, the under-35 age group saw a remarkable 4.5 percentage point increase in homeownership rates, the highest among all age brackets. The 35-44 group followed with a 3.6 point jump. Interestingly, older age groups experienced minimal changes, with those 65+ seeing just a 0.3 point rise.
This data challenges the narrative of millennials being perpetual renters, suggesting a shift in their housing preferences and financial capabilities.
😲 When 23% Carries the S&P 500

The S&P 500 is experiencing unprecedented concentration. Since 1980, the percentage of stocks outperforming the index has fluctuated, with peaks nearing 70% in 1980 and 2000. However, recent years have shown a dramatic decline. By 2024, only about 23% of stocks are outperforming the index - a record low.
This trend suggests a market is increasingly driven by a small number of high-performing stocks, potentially signalling heightened risk and reduced diversification benefits within the index.
⚖️ The 60/40 Portfolio: Not So Balanced Anymore
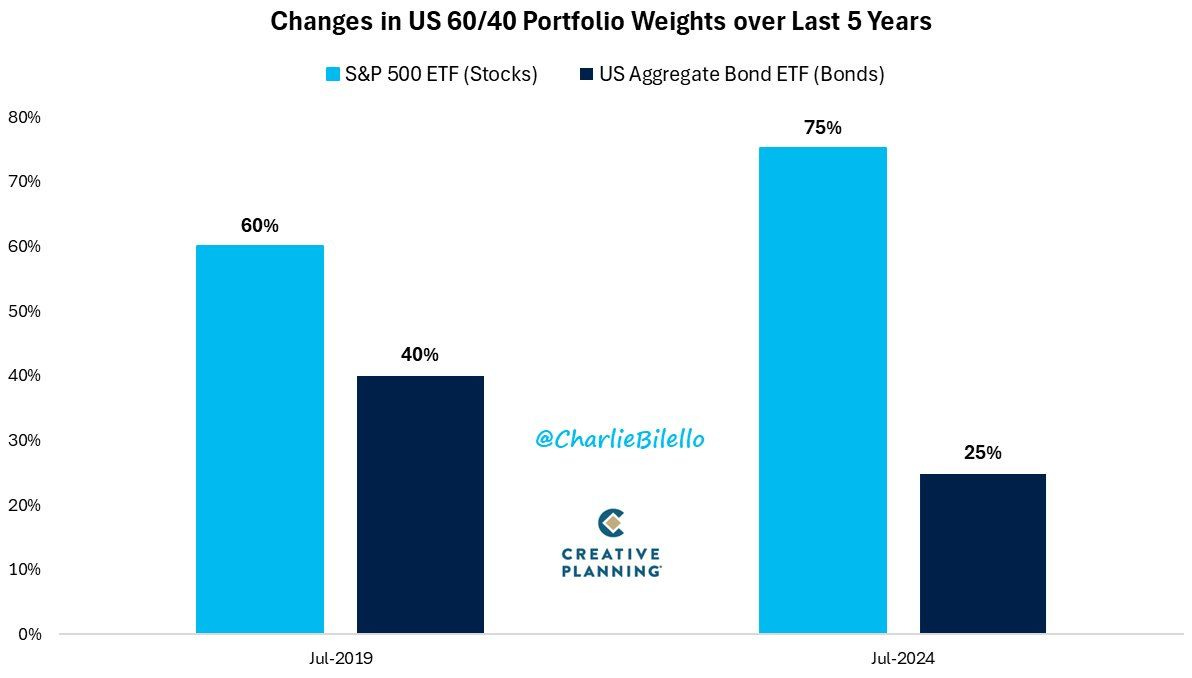
This image illustrates the changes in a US 60/40 portfolio allocation over 5 years from July 2019 to July 2024. It compares the weights of S&P 500 ETF (representing stocks) and US Aggregate Bond ETF (representing bonds) in the portfolio. In 2019, the split was 60% stocks and 40% bonds, adhering to the traditional 60/40 portfolio strategy.
By 2024, the allocation shifted dramatically. Stocks grew to occupy 75% of the portfolio, while bonds shrank to just 25%. This significant change reflects a substantial increase in the proportion of equities and a corresponding decrease in fixed-income assets over the five-year timeframe.