
📝 LTP Notes 003: Corporate Confidence, Global Credit Card Hierarchy, Brand Value, and Others
Some investing notes that may help you gain insights or make long-term decisions.


📢 Dear reader, if you're a Twitter/X user, feel free to join Long-Term Pick right now 👉 https://x.com/long_term_pick There you will find lots of insights absent on the website!
🏢 Corporate Confidence: S&P 500's Buyback Boom
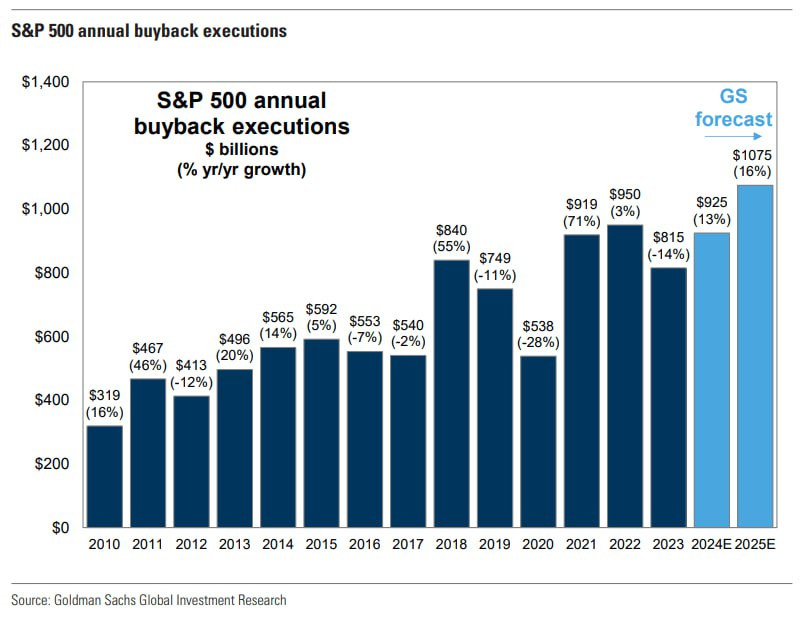
The chart illustrates the annual expenditure on share buybacks by S&P 500 companies from 2010 to 2025, with predictions for the last two years provided by Goldman Sachs.
Key points:
- Companies have generally increased spending on buybacks over time, with some fluctuations.
- The highest amount spent on buybacks was $950 billion in 2022.
- In 2023, buybacks decreased by 14% to $815 billion.
- Goldman Sachs anticipates a significant increase in buybacks in 2024 and 2025, with a projected amount of $1,075 billion by 2025.
This trend indicates that major U.S. companies are optimistic about the future. They may have surplus cash and feel that their stocks are a good investment. Increased buybacks could contribute to higher stock prices and enhance the value of each share, which is valuable information for investors considering where to allocate their funds.
📊 Skin in the Game: Founder-CEOs Outperform
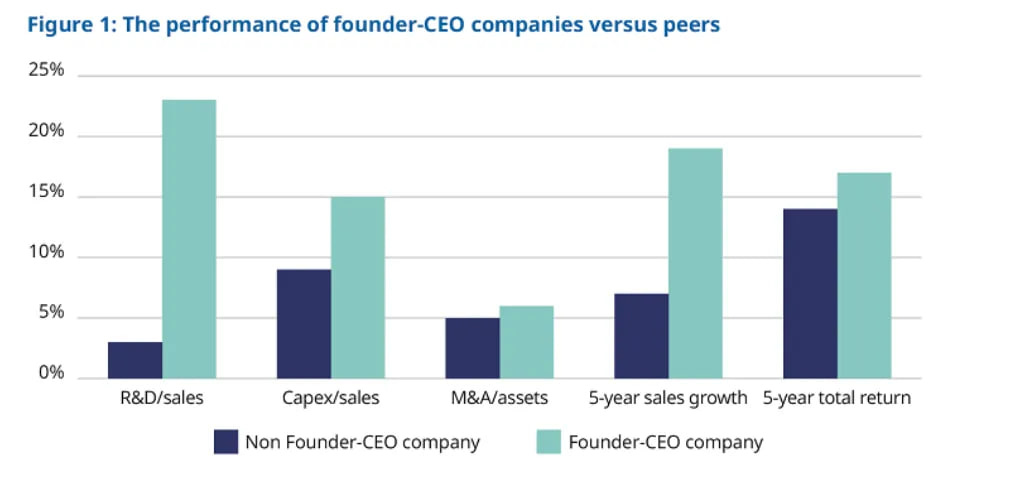
This chart compares the performance of companies led by founder-CEOs to those with non-founder CEOs across five key metrics.
Key points:
Founder-CEO companies spend a lot more on R&D compared to sales (22% vs 2.5%).
They also invest more in capital expenses (14.5% vs 9% of sales).
M&A activity is similar for both types but slightly higher for founder-led firms.
Founder-CEO companies experience much faster sales growth over 5 years (18.5% vs 6.5%).
The total 5-year return is better for founder-led companies (16.5% vs 13.5%).
Companies still run by their founders tend to perform better overall. They invest more in growth and innovation, which seems to pay off with faster sales growth and better returns for investors. This might mean it's worth paying attention to whether a company's founder is still managing.
💳 The Global Credit Card Hierarchy
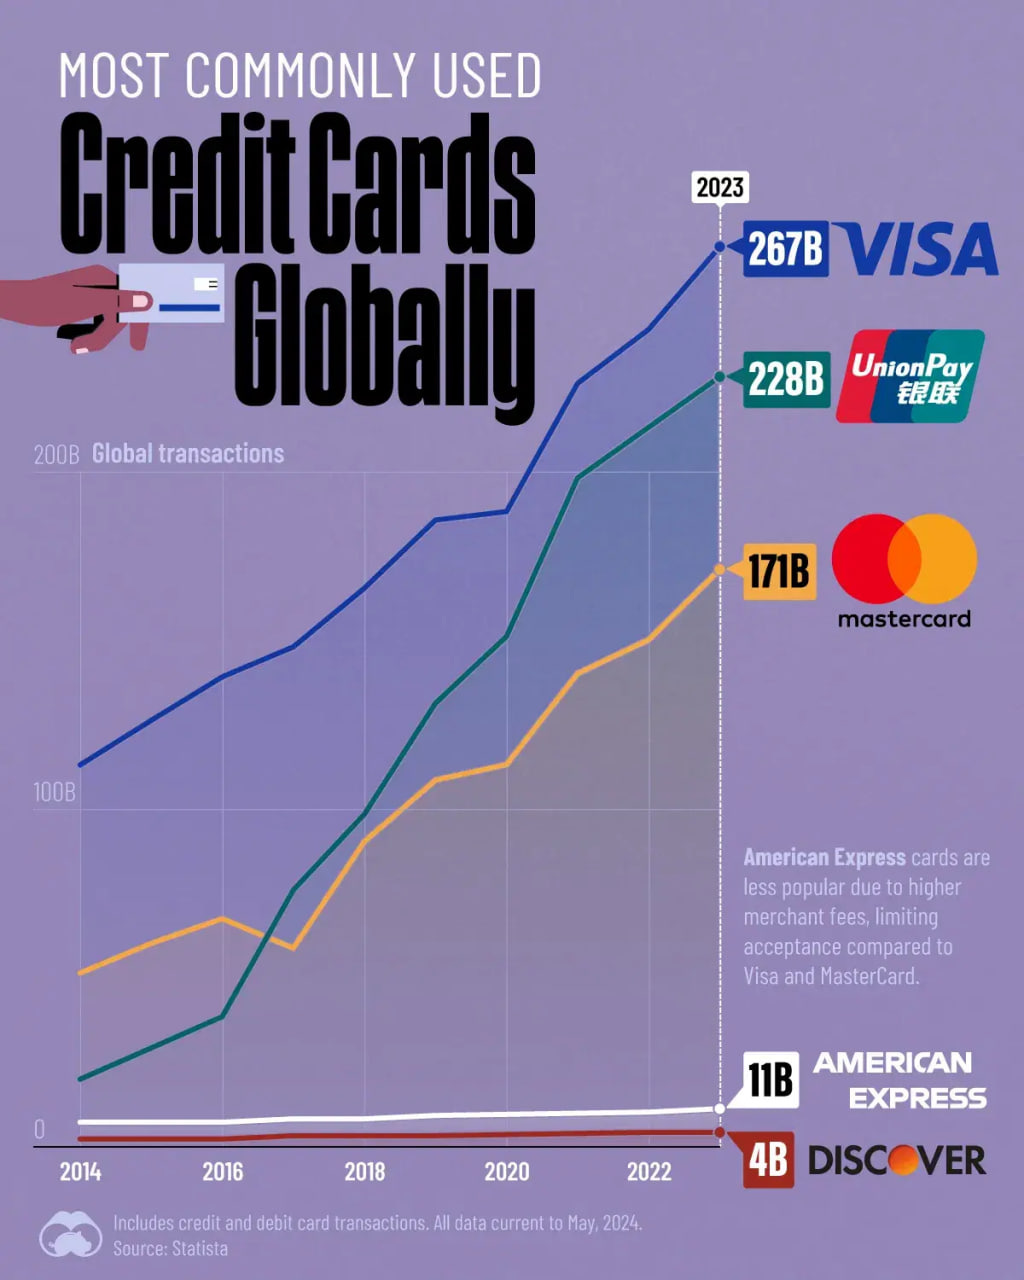
The chart illustrates the frequency of credit card usage worldwide from 2014 to 2023.
Key points:
- Visa leads with 267 billion transactions in 2023.
- UnionPay, a Chinese company, surprisingly takes second place with 228 billion transactions.
- Mastercard follows with 171 billion transactions.
- American Express and Discover lag significantly, with only 11 billion and 4 billion transactions, respectively.
- All major card brands have experienced substantial growth since 2014, but UnionPay has shown the fastest growth.
The chart highlights that American Express is less popular due to the higher fees stores must pay to accept it, resulting in fewer businesses opting to do so when compared to Visa and Mastercard.
🍿 The Cost of Digital Entertainment
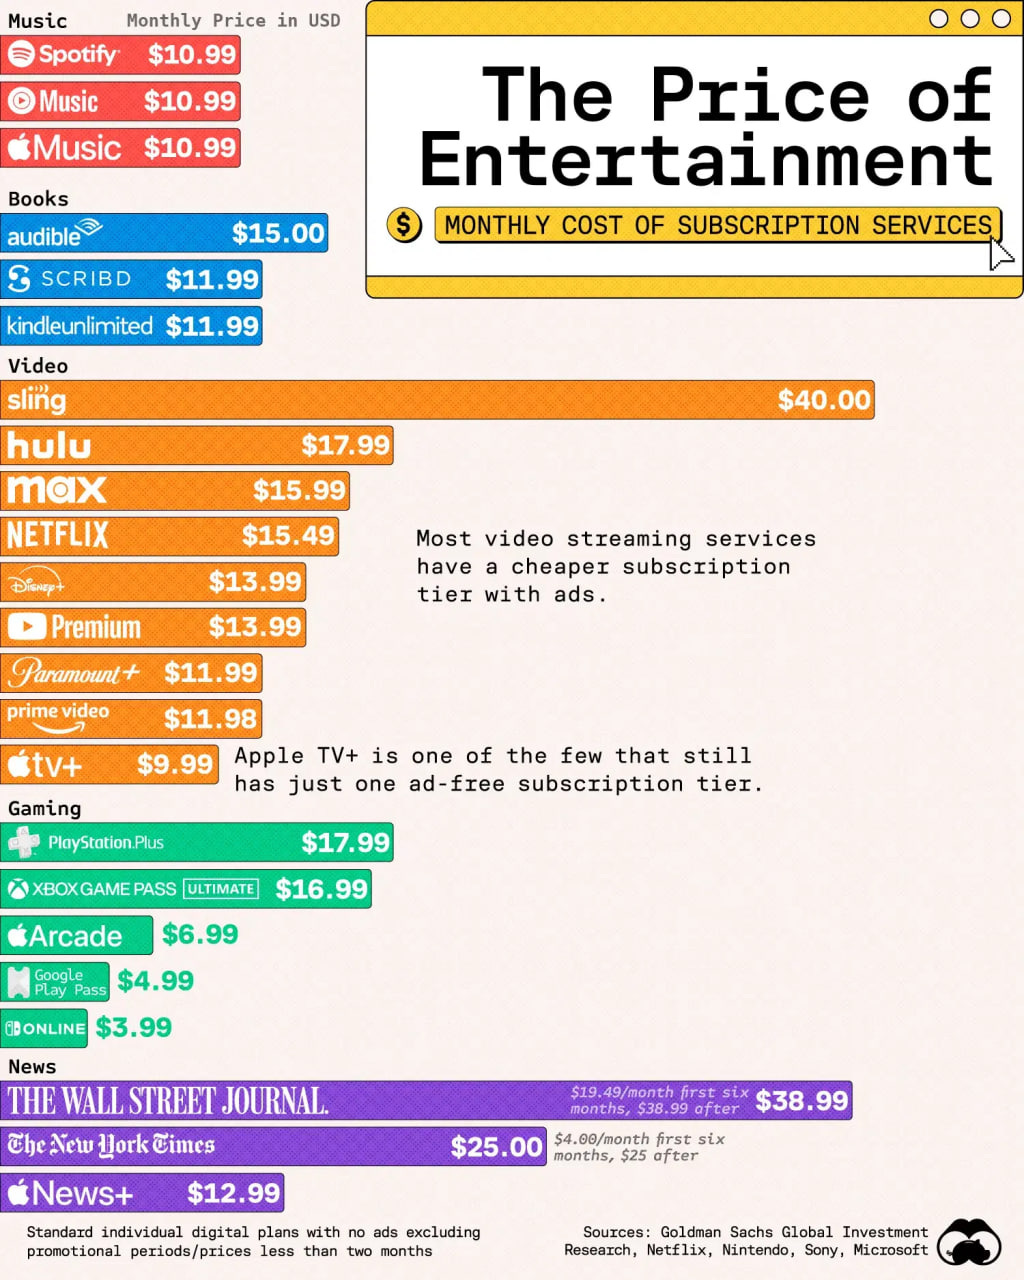
The image displays the monthly prices of various entertainment subscription services in the US.
Key points:
- Music streaming services (Spotify, YouTube Music, Apple Music) all cost $10.99 per month.
- Book services vary: Audible is the most expensive at $15, while Scribd and Kindle Unlimited both cost $11.99.
- Video streaming services have a wide range of prices: Sling is the most expensive at $40, Apple TV+ is the cheapest at $9.99, and Popular services like Netflix ($15.49) and Hulu ($17.99) fall in the middle.
- Gaming subscriptions range from $3.99 (Nintendo Online) to $17.99 (PlayStation Plus).
- News subscriptions can be pricey, with The Wall Street Journal at $38.99 after a promotional period.
Most video services now offer cheaper plans with ads, while Apple TV+ still has only one ad-free tier. This variety in pricing demonstrates the competitiveness of the streaming market, with companies applying different strategies to attract subscribers. For investors, this breakdown provides an understanding of the subscription economy and how different companies are positioning themselves in various entertainment sectors.
👜 Brand Value
"In the long-term, there is no misalignment between customer success and shareholder success" (J. Bezos, 1999).
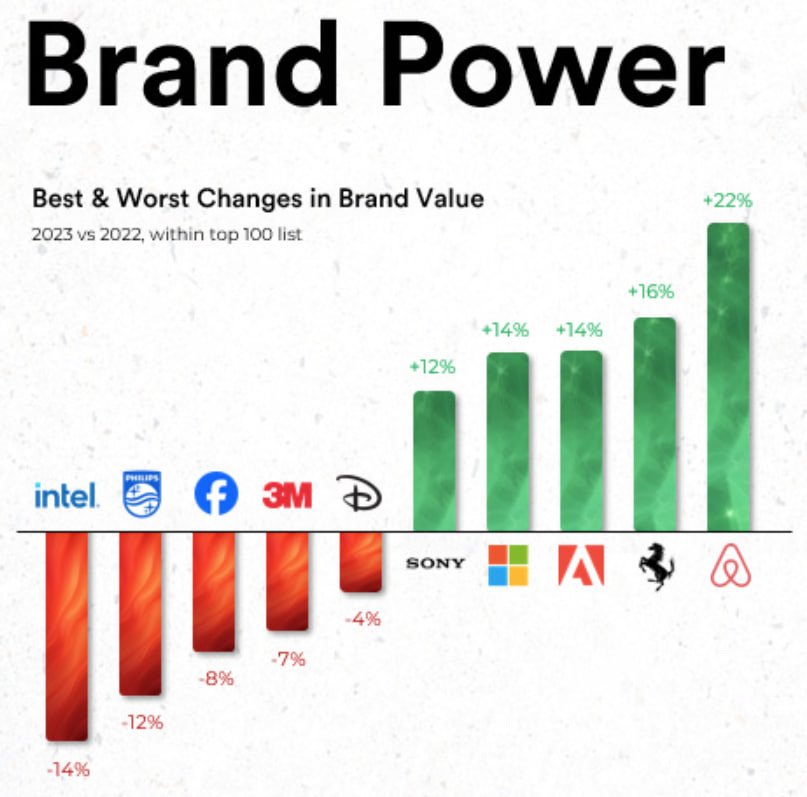
Brand value reflects the popularity, demand, and appreciation of end customers. An increasing brand value may indicate several positive developments: higher adoption of products/services, higher perceived value, and greater switching costs and pricing power.
That's why it's important to always keep an eye on global brand rankings and pay attention to how brands increase or decrease in value over time.
🤔 Is Individual Stock Picking worth it?

Time Horizon Advantage:
Unlike large investment funds constrained by short-term performance metrics, individual investors have the luxury of playing the long game. This flexibility allows you to decrease market downturns and capitalize on upswings, especially when dealing with stocks that demonstrate gradual but steady growth potential.
Access to Small Caps:
While major funds often bypass smaller companies due to liquidity concerns or size limitations, individual investors can uncover these overlooked opportunities. By identifying promising small-cap stocks early in their growth trajectory, you may position yourself for substantial returns as these companies gain recognition and market share.
Focused Portfolio:
In contrast to institutional investors who must diversify extensively to mitigate risk, individual stock pickers can concentrate their investments in a handful of carefully selected companies. This focused approach allows you to leverage your convictions and potentially amplify your returns through a few well-chosen winners.
Expertise Knowledge:
Your professional background and personal experiences can serve as a valuable edge in stock selection. For example, if you're immersed in the technology sector, you might spot emerging trends or innovative companies before they hit the radar of mainstream investors. Similarly, healthcare professionals may recognize groundbreaking advancements that could reshape the industry.
To sum up, a strategic combination of individual stock picks and broader market investments like ETFs can be a powerful approach to building wealth. By leveraging your unique insights, maintaining patience, and focusing on your areas of expertise, you can potentially outperform the average investor while managing risk effectively.
🔵 Blue Ocean Industries

What sets a blue ocean apart from a red ocean industry? Blue ocean industries are typically new or rapidly growing with medium to high operating margins, where there can be multiple successful businesses. Examples include SaaS, Advertising, Online Education, and Soft Drinks.
On the other hand, a red ocean industry often represents low-margin businesses in mature markets where competition is based on price rather than value. Examples include shopping retail, retail banks, telecommunications, and streaming services.
It is advisable to concentrate on blue ocean businesses to increase the probability of success.
This is not a financial or investing recommendation. It is solely for educational purposes.