
💻 LTP Notes 004: Freelance Revolution, The Price of Perfect Timing, 2050 Projections, and Others
Some investing notes that may help you gain insights or make long-term decisions.


| 📢 Dear reader, if you like the content you read, please share Long-Term Pick with your friends and colleagues. It will force me to write more quality content in the future 😉 Also, you can subscribe to: the Telegram channel, Twitter (X), and LinkedIn newsletter.
📊 The Price of Perfect Timing
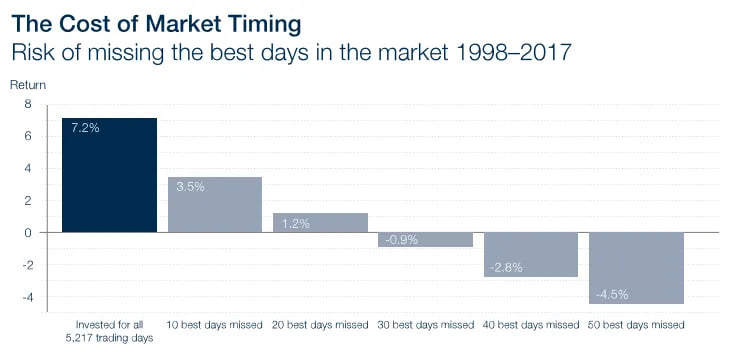
This chart illustrates the impact of missing the best trading days in the market over a 20-year period from 1998 to 2017.
Key points:
Staying fully invested for all 5,217 trading days yielded a 7.2% return.
Missing just the 10 best days reduced returns to 3.5%.
Absence from the 20 best days further lowered returns to 1.2%.
Missing the 30 best days resulted in a negative return of -0.9%.
The loss increased to -2.8% when missing the 40 best days.
Sitting out the 50 best days led to a substantial -4.5% return.
This data strongly emphasizes the importance of consistent market participation. Attempting to time the market by stepping out, even for short periods, can significantly erode long-term returns. The stark contrast between staying fully invested and missing just a few key days underscores that time in the market, rather than timing the market, is crucial for maximizing investment growth potential.
🌍 Global Economic Landscape: 2050 Projections
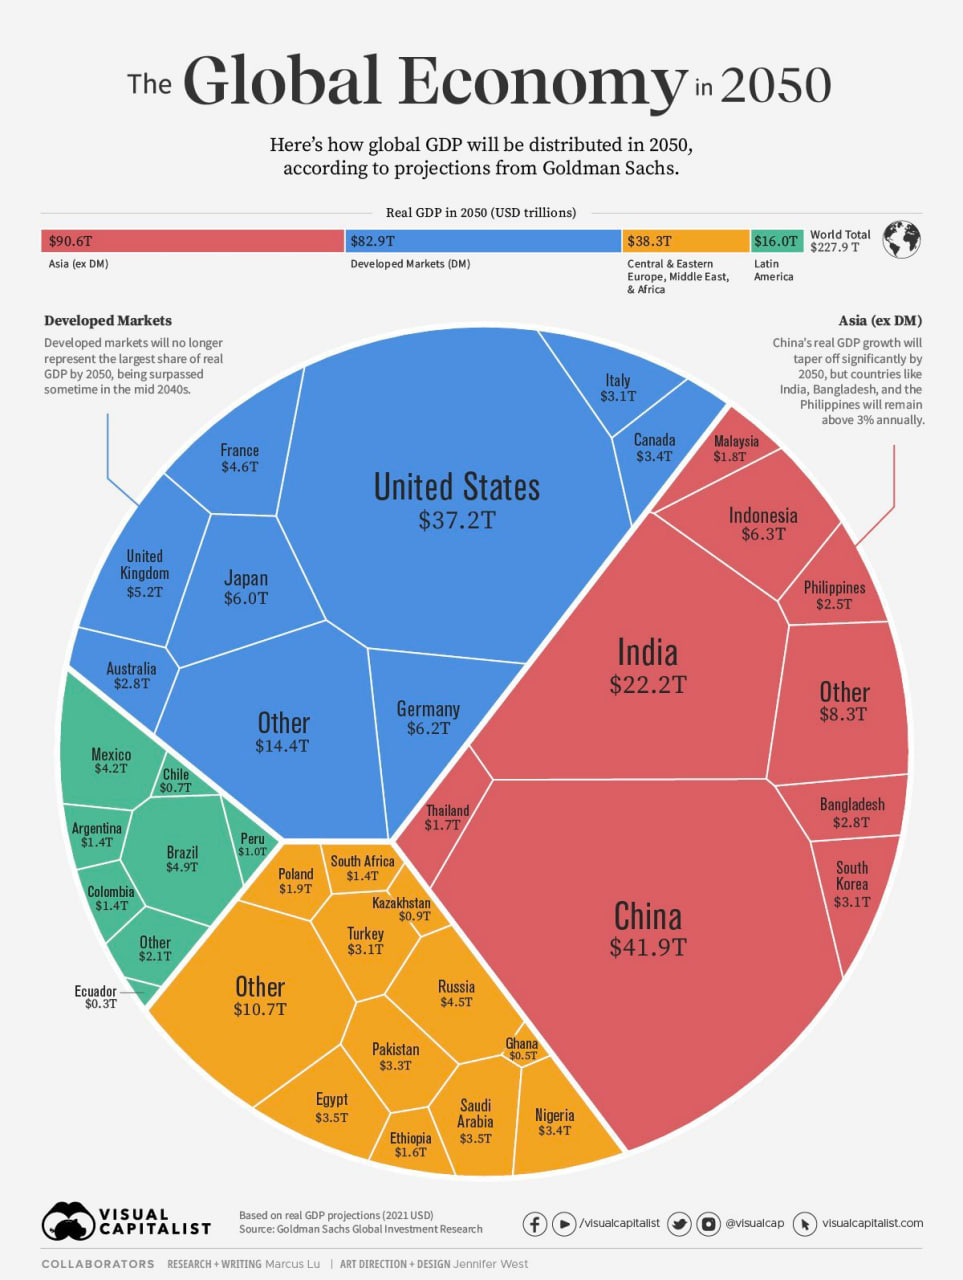
This infographic presents Goldman Sachs' projections for the distribution of global GDP in 2050, offering a glimpse into the future economic landscape.
| 🔗 Related Article: 🇮🇳 India: The Next Global Manufacturing Hub
Key points:
The total world GDP is projected to reach $227.9 trillion by 2050.
Asia (excluding Developed Markets) is set to become the largest economic bloc with $90.6 trillion in GDP.
China is expected to be the world's largest economy with a GDP of $41.9 trillion.
The United States follows closely with $37.2 trillion.
India is projected to be the third-largest economy with $22.2 trillion.
Developed Markets will collectively account for $82.9 trillion.
Latin America is projected to contribute $16.0 trillion to the global economy.
This forecast suggests a significant shift in global economic power towards Asia. It highlights the continued rise of emerging markets, particularly China and India, while also showing the enduring economic strength of the United States. The projections indicate a more multipolar economic world in 2050, with economic influence more widely distributed across regions and nations.
💻 Freelance Revolution
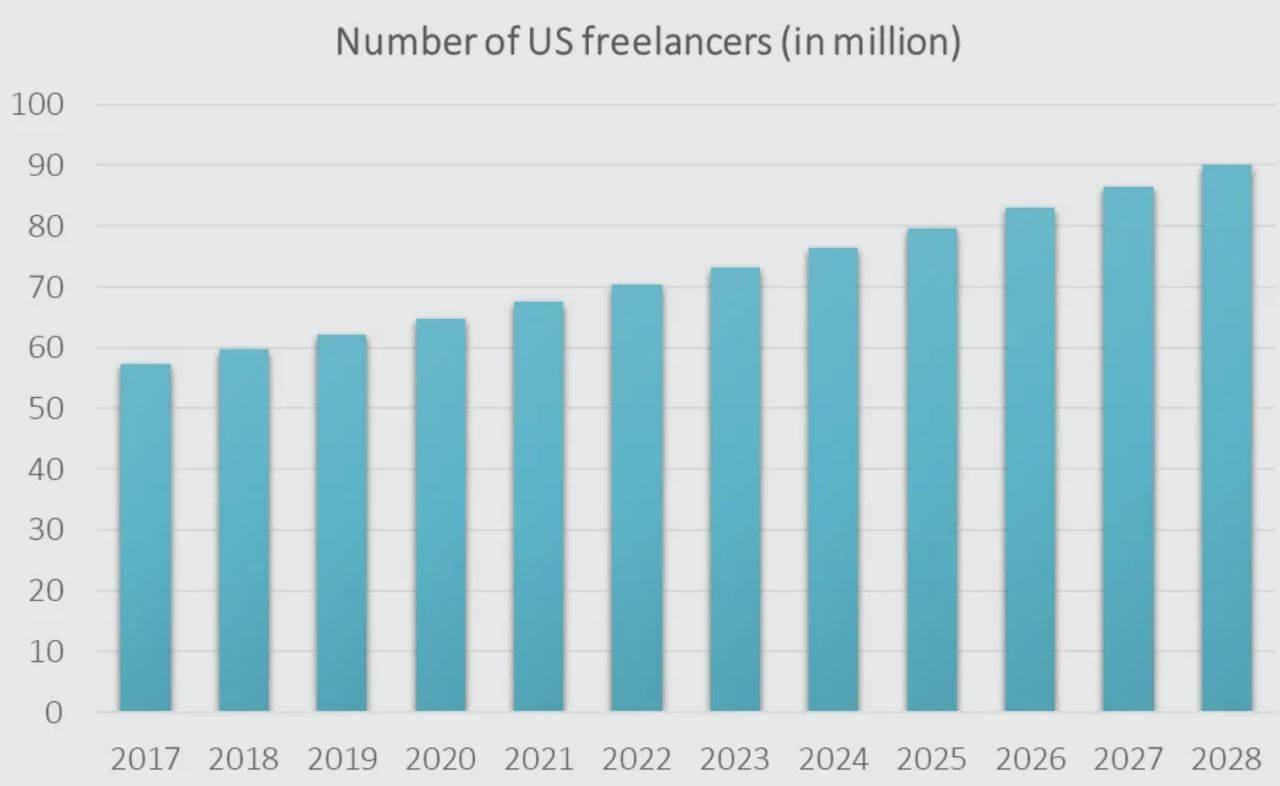
This chart illustrates the steady growth in the number of US freelancers from 2017 to 2028, with projections for future years.
Key points:
In 2017, there were approximately 57 million freelancers in the US.
By 2023, this number had grown to about 73 million.
The projection for 2028 shows an expected increase to 90 million freelancers.
The trend shows a consistent year-over-year growth in the freelance workforce.
From 2017 to 2028, there's a projected increase of about 33 million freelancers, representing a 58% growth over 11 years.
This data indicates a significant shift towards gig economy and flexible work arrangements in the US job market. The steady upward trend suggests that freelancing is becoming an increasingly popular and viable career option for many Americans.
Stocks to watch:
Upwork (UPWK): A leading global freelancing platform.
Fiverr (FVRR): An online marketplace for freelance services.
Zoom (ZM): Essential tool for remote work and freelance communications.
Dropbox (DBX): Cloud storage solution popular among freelancers.
Square (SQ): Provides payment solutions often used by independent contractors.
| 🔗 Related Article: 💎 Fintech's Hidden Gem. SQ Stock Analysis
💼 Investor's Election Guide
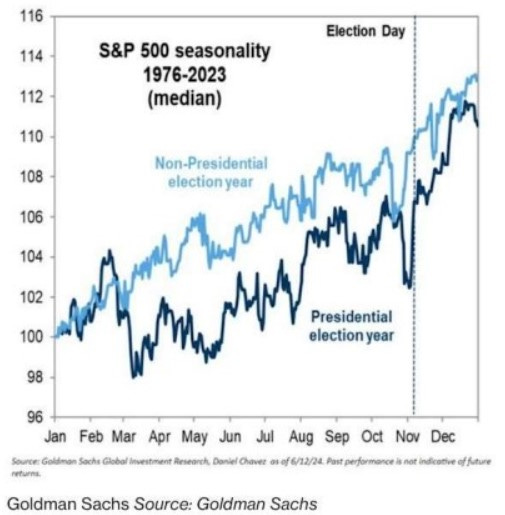
This chart from Goldman Sachs illustrates the median S&P 500 performance during presidential and non-presidential election years from 1976 to 2023.
Key points:
The chart compares market seasonality between presidential election years and non-presidential election years.
Non-presidential election years (blue line) generally show stronger and more consistent growth throughout the year.
Presidential election years (black line) display more volatility and lower overall returns.
Both types of years show a significant uptick after Election Day in November.
The largest divergence occurs in the middle of the year, with non-presidential years performing notably better.
By year-end, the gap narrows, but non-presidential years still finish higher.
This data suggests that electoral uncertainty may impact market performance, with investors showing more caution during presidential election years. The post-election rally in both scenarios indicates a preference for political clarity, regardless of the outcome.
⚡ What Powered the World in 2023
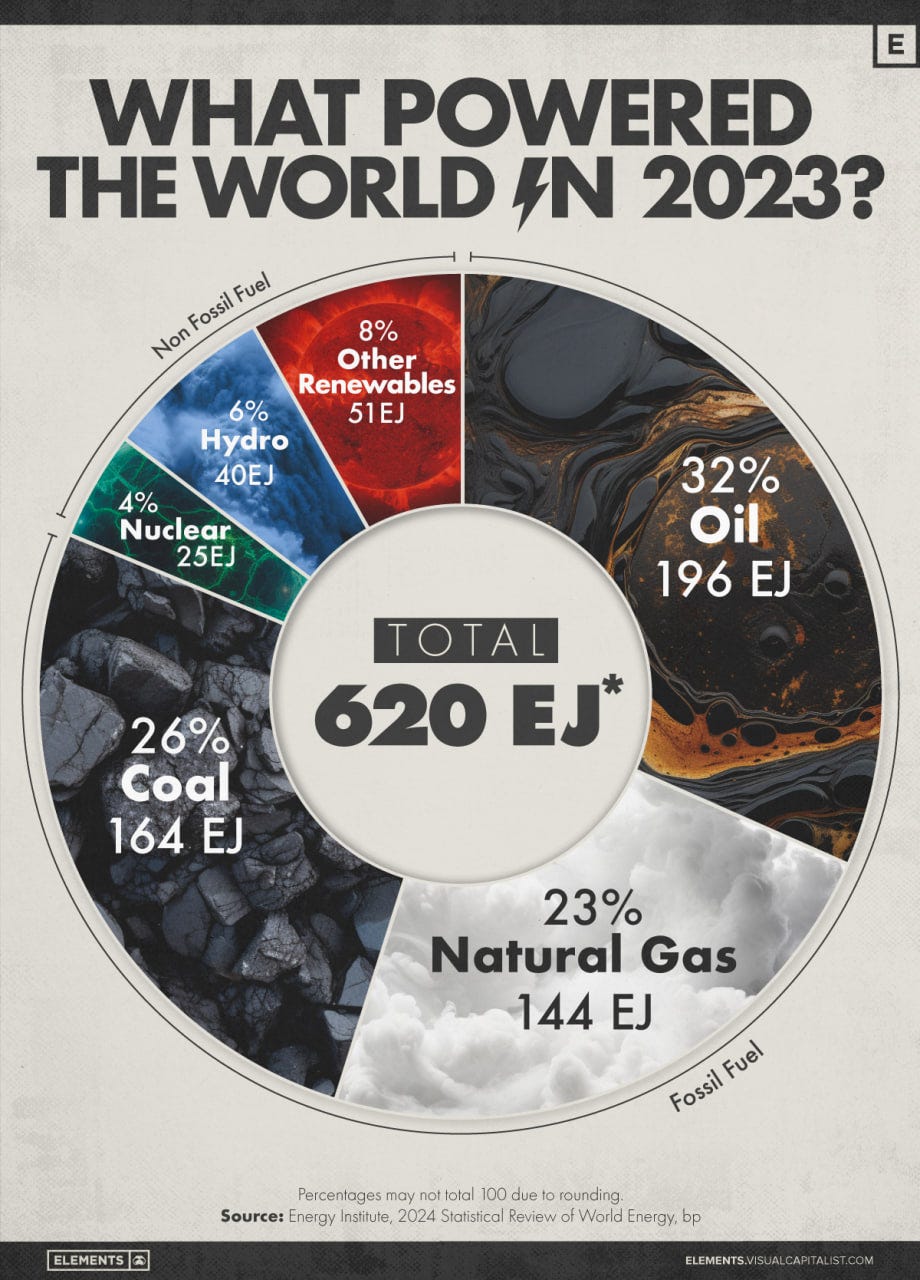
The total global energy consumption reached a staggering 620 EJ in 2023, with fossil fuels (oil, coal, natural gas) accounting for a dominant 81% of the energy mix. Oil remains the largest energy source at 32% (196 EJ), followed closely by coal at 26% (164 EJ) and natural gas at 23% (144 EJ).
Non-fossil fuel sources collectively represent 19% of energy consumption, with Other Renewables (likely wind and solar) contributing 8% (51 EJ), Hydroelectric power at 6% (40 EJ), and Nuclear energy at 4% (25 EJ).
This data highlights the continued reliance on fossil fuels in the global energy landscape, despite growing concerns about climate change. However, the presence of renewables and nuclear suggests a gradual shift towards cleaner energy sources.
The challenge ahead lies in accelerating the transition to renewable energy while meeting the world's growing energy demands. Investors and policymakers may focus on technologies and policies that can expedite this transition in the coming years, potentially reshaping the global energy mix in future decades.
This is not a financial or investing recommendation. It is solely for educational purposes.