
LTP Notes 015: ASML's Hidden $6B Recurring Revenue, Renewable Energy to Double by 2050, Ad Market Projection by 2030, TSMC Controls 72% of Chip Manufacturing, and Others
Some investing notes that may help you gain insights or make long-term decisions.


Content:
• Adobe Trades at Half Its Normal Valuation
• Google, Meta, and Amazon to Control $934B Ad Market by 2030
• Top 10 Stocks Hit Extreme Valuation Levels
• ASML’s Hidden $6B Recurring Revenue
• TSMC Controls 72% of Global Chip Manufacturing
• Renewable Energy to Nearly Double by 2050
• The World’s Largest Economies in 2025
• China Dominates 71% of Global Battery Manufacturing
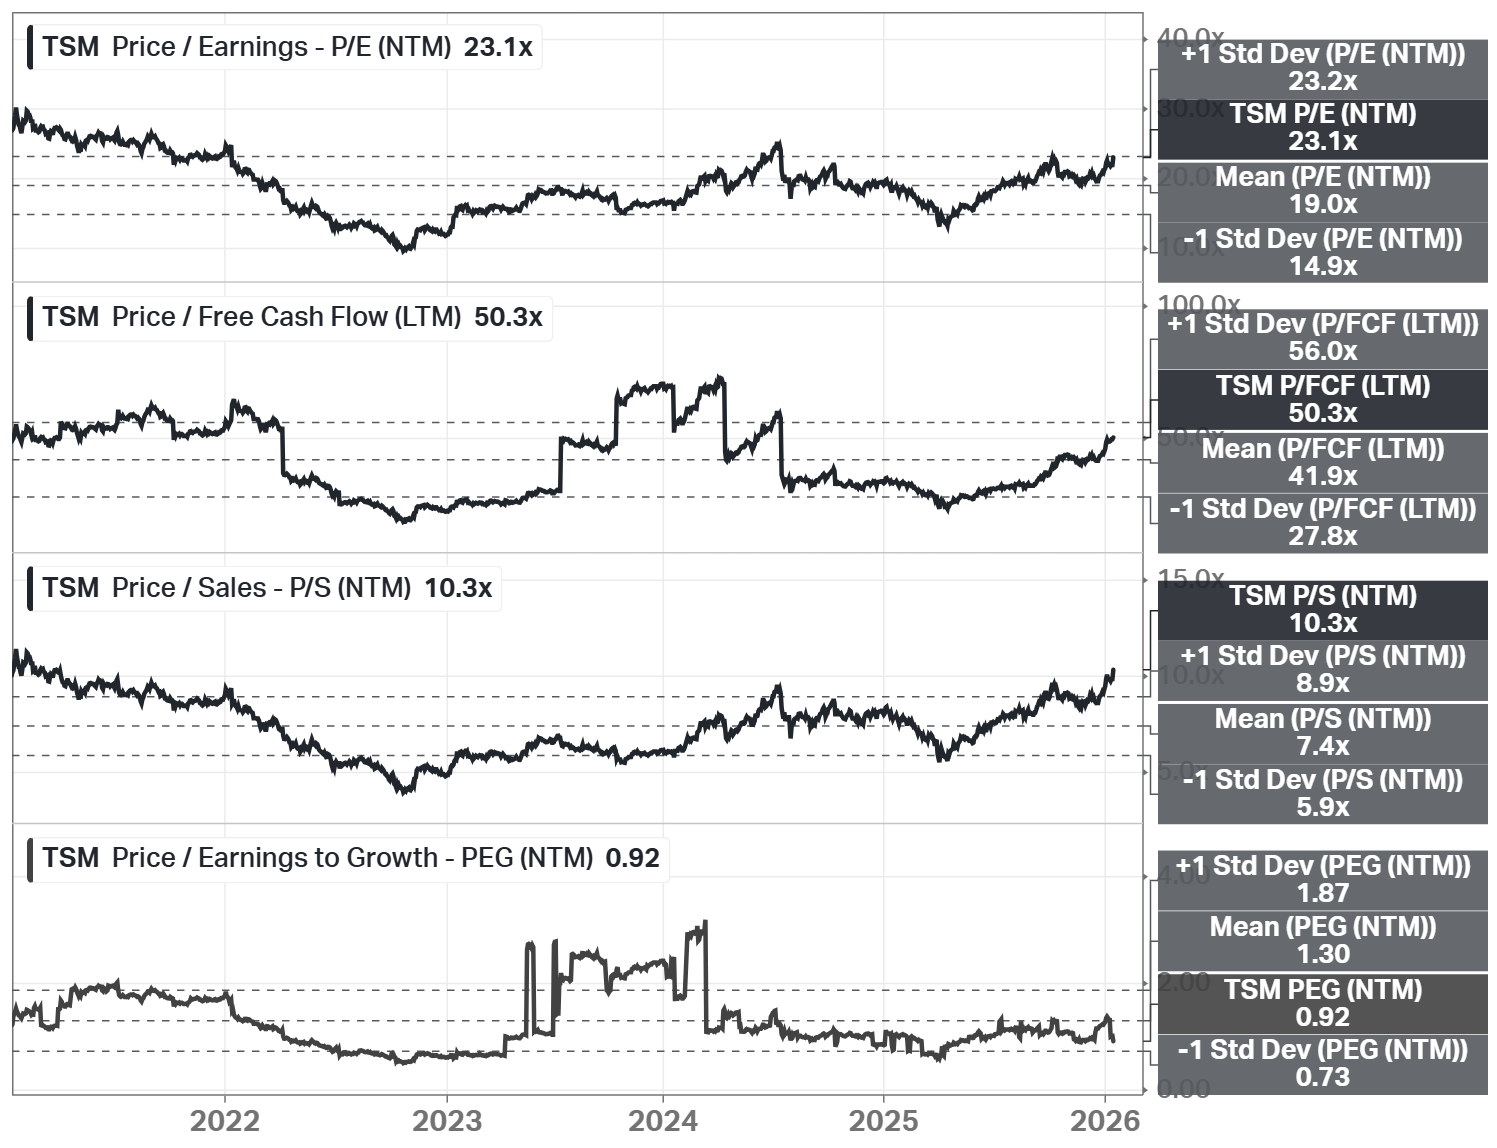
Adobe Trades at Half Its Normal Valuation
Adobe (ADBE) is now trading at its lowest valuation in years. The stock’s forward Price/Earnings ratio has dropped to just 13.2, far below its historical average of 29.0. Adobe’s Price to Free Cash Flow ratio is only 15.0, compared to its average of 30.6. This means Adobe is trading at less than half its normal valuation.
The company’s buyback yield has reached 8%, more than double its historical average of 3.43%. This shows the company is aggressively buying back its own shares at these low prices, which is a strong signal that management believes the stock is undervalued.
Meanwhile, the company’s Return on Invested Capital (ROIC) has climbed to 38.71%, well above its average of 29.63%. This means the company is generating more profits from its investments than ever before.
The combination of low valuation, high buybacks, and strong returns makes Adobe look very attractive right now. The company still dominates creative software (Photoshop, Illustrator) and is growing fast in AI with tools like Firefly.
Google, Meta, and Amazon to Control $934B Ad Market by 2030
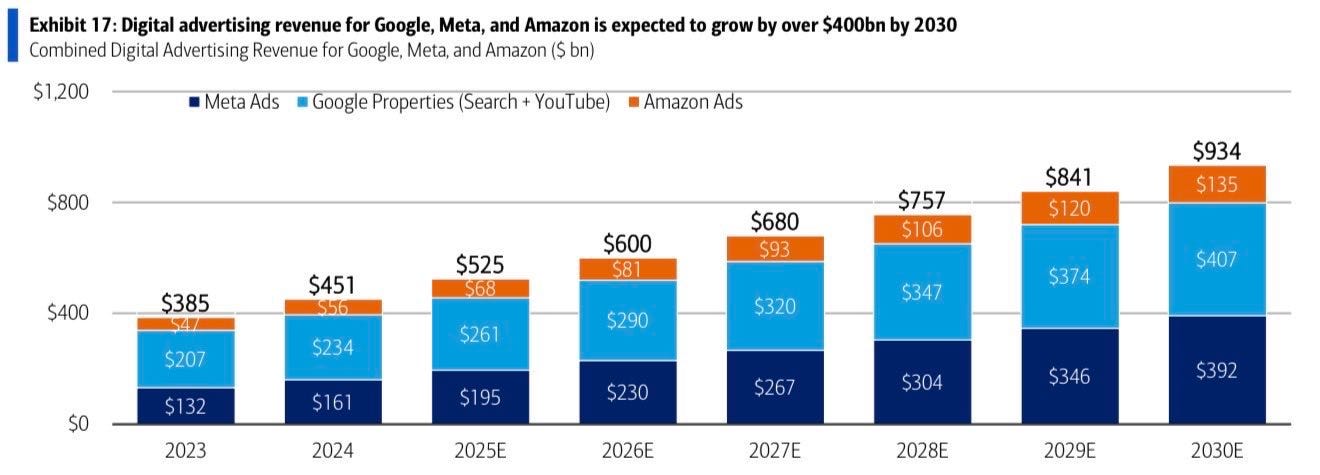
Digital advertising is booming, and three tech giants will dominate the market. Combined revenue for Google, Meta (Facebook, Instagram, WhatsApp), and Amazon is expected to reach $934 billion by 2030, up from $385 billion in 2023. That’s a 142% increase in just seven years. Google Properties (Search and YouTube) will remain the largest player.
This growth is driven by businesses moving more advertising budgets to digital platforms. These three companies have massive user bases and advanced targeting technology that traditional media cannot match.

Stocks to watch:
GOOGL (Alphabet/Google) - largest digital ad platform
META (Meta Platforms) - Facebook, Instagram, WhatsApp
AMZN (Amazon) - fastest-growing ad business
SNAP (Snap Inc.) - smaller social media advertising
PINS (Pinterest) - visual discovery advertising
TTD (The Trade Desk) - programmatic advertising platform
ROKU (Roku) - connected TV advertising
Top 10 Stocks Hit Extreme Valuation Levels
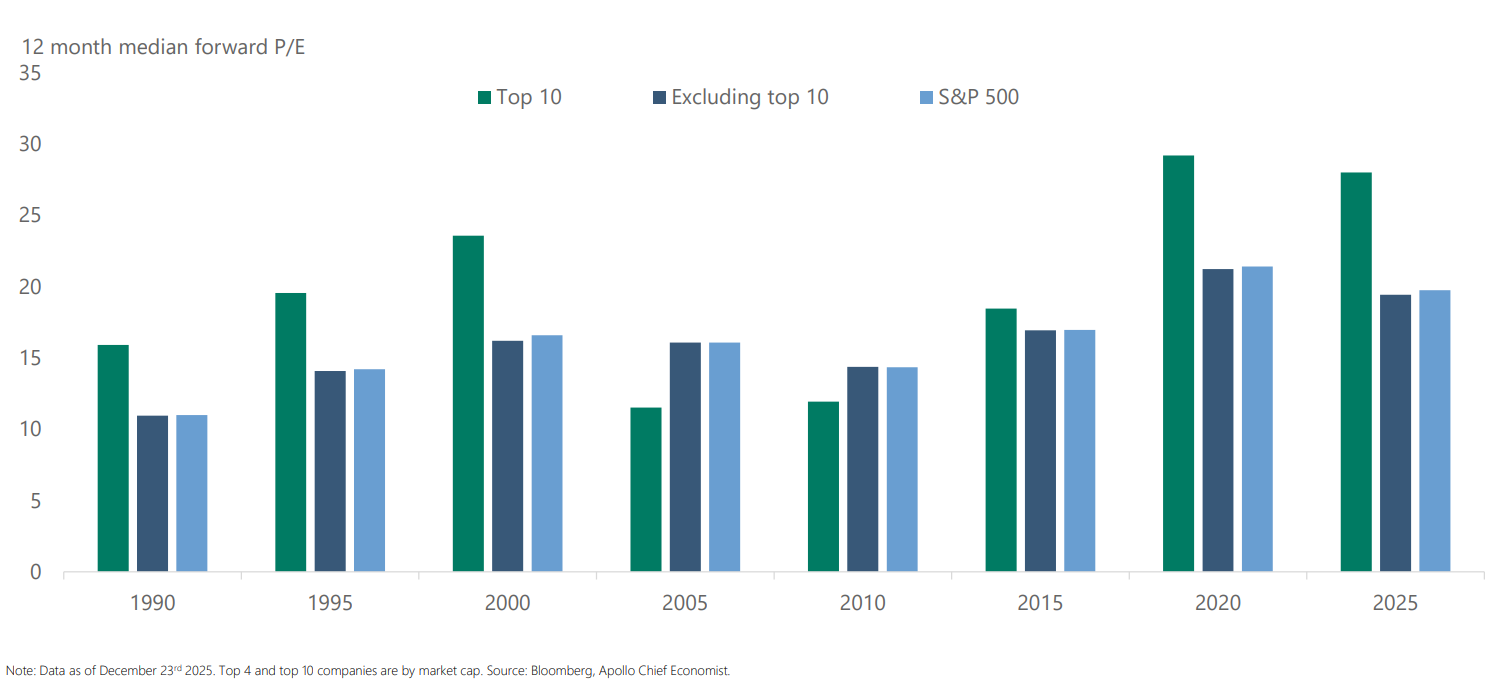
The biggest companies in the S&P 500 are trading at their highest valuations in decades. The top 10 stocks now have a forward P/E ratio of 27.8, compared to just 19.8 for the rest of the market. This is a huge gap.
In 2020, the top 10 stocks had a forward P/E of 29.1 – the highest ever recorded. We’re now close to that level again at 27.8. Meanwhile, the other 490 stocks in the S&P 500 trade at only 19.5, which is much more reasonable.
This creates a dangerous situation. When a few mega-cap stocks become extremely expensive, they drive the entire market higher. But if these top 10 stocks fall, they can drag down the whole market with them.
ETFs to watch:
RSP (Invesco S&P 500 Equal Weight ETF) - spreads risk evenly
VTV (Vanguard Value ETF) - focuses on cheaper stocks
SCHD (Schwab U.S. Dividend Equity ETF) - dividend value stocks
COWZ (Pacer US Cash Cows 100 ETF) - free cash flow focused
QUAL (iShares MSCI USA Quality Factor ETF) - quality companies
SPLV (Invesco S&P 500 Low Volatility ETF) - defensive positioning
ASML's Hidden $6B Recurring Revenue
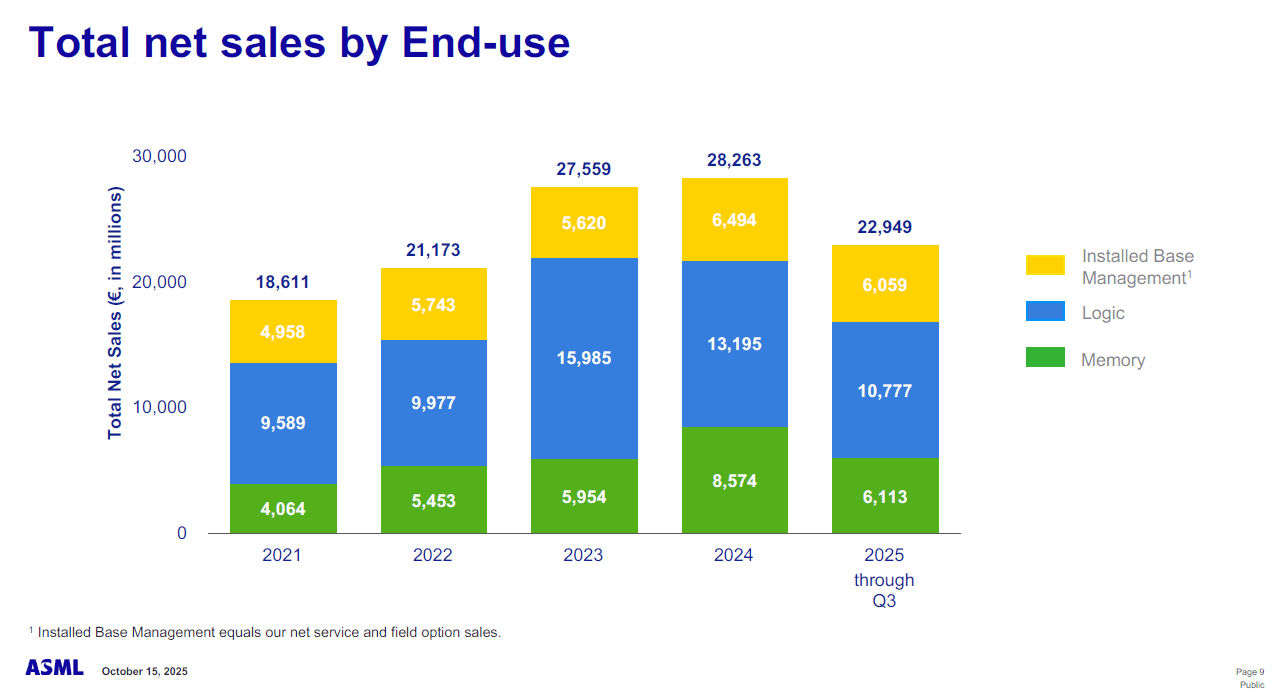
ASML is best known for selling advanced chip-making machines, but its real profit engine is the recurring revenue that comes after the sale. The company’s Installed Base Management business (service, upgrades, and maintenance) has grown to over €6 billion per year.
When ASML sells a machine, customers must keep paying for maintenance, upgrades, and service for many years. These machines are incredibly complex and cost over $100 million each, so customers have no choice but to work with ASML to keep them running.
TSMC Controls 72% of Global Chip Manufacturing
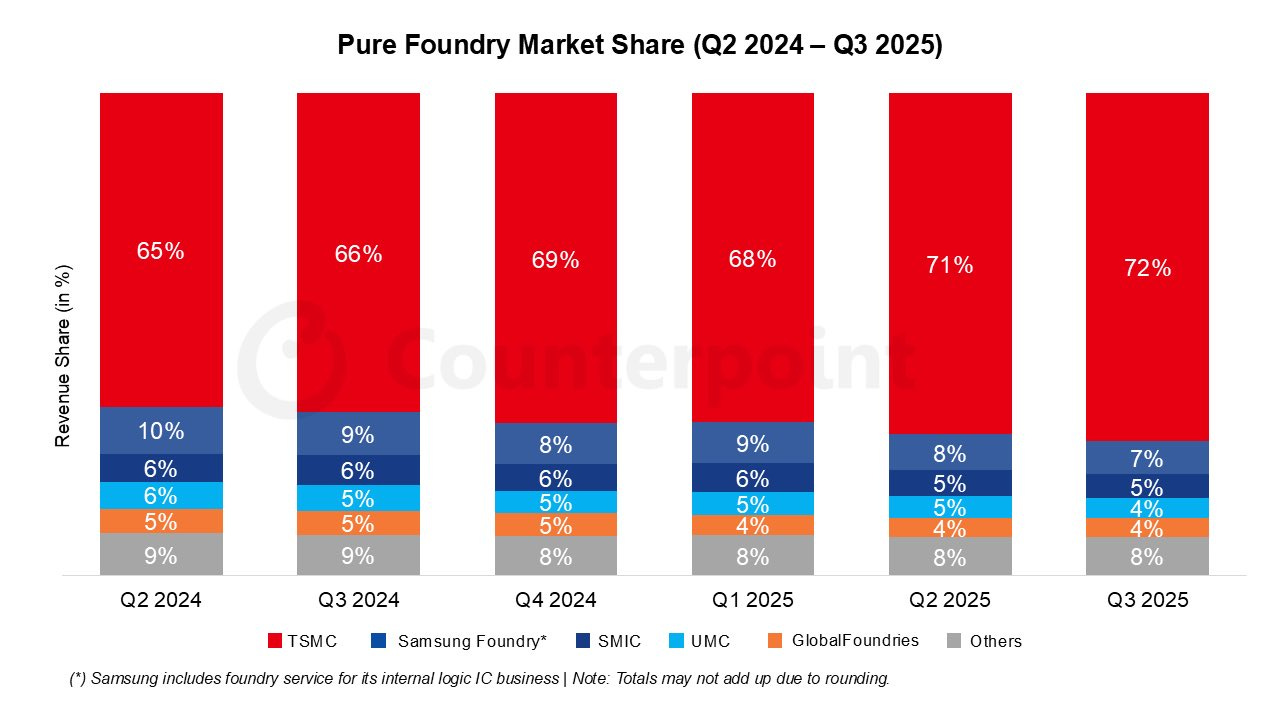
TSMC dominates the pure foundry market like no other company. Its market share has grown from 65% in Q2 2024 to 72% in Q3 2025. This means nearly three out of every four advanced chips made worldwide come from TSMC.
Samsung Foundry holds second place but is losing ground, dropping from 10% to just 7% market share. SMIC remains steady at around 5-6%, while UMC holds 4-5%. GlobalFoundries and other smaller players split the remaining 12%.
TSMC’s dominance keeps growing because it has the most advanced technology. The company is the only one that can mass-produce the most advanced 3nm chips for companies like Apple, NVIDIA, and AMD.
This near-monopoly gives TSMC incredible pricing power. As AI and advanced computing grow, demand for cutting-edge chips will only increase. TSMC can raise prices because customers have almost no alternatives for the most advanced nodes.
Renewable Energy to Nearly Double by 2050
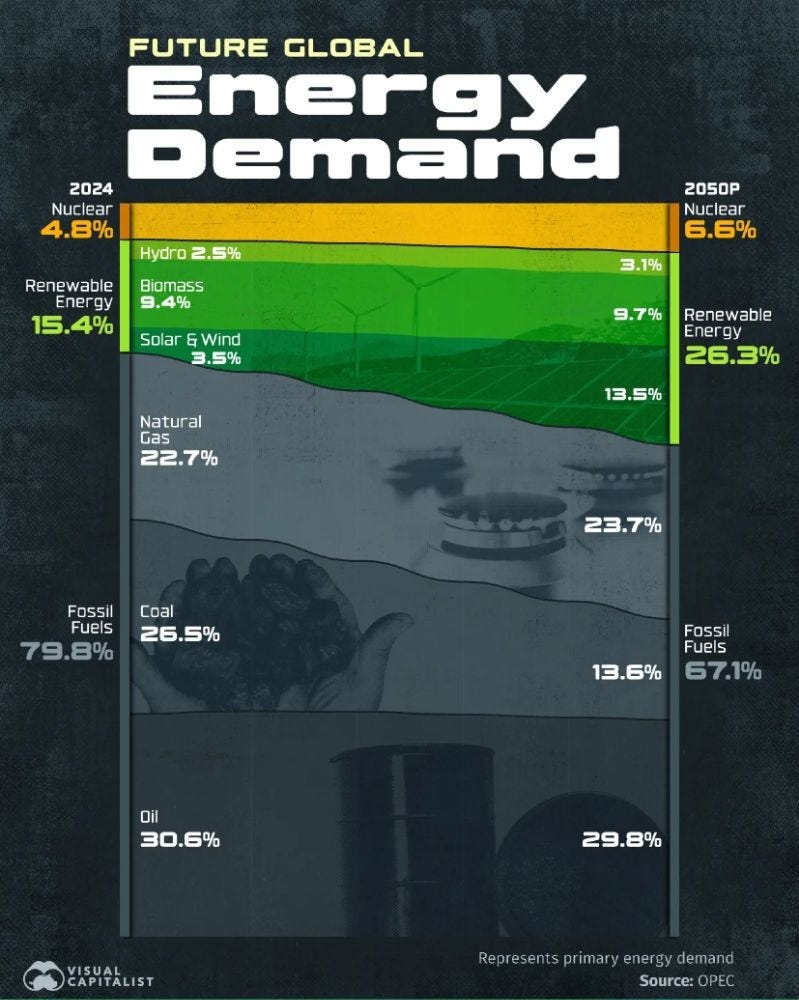
Renewable energy will grow from just 15.4% in 2024 to 23.3% by 2050. This means renewables will nearly double their share of total energy demand in just 26 years.
Fossil fuels will still dominate, but will decline from 79.8% today to 67.1% by 2050. Oil will drop slightly from 30.6% to 29.8%, while coal will fall dramatically from 26.5% to 13.6%. Natural gas will stay relatively stable.
Nuclear energy will grow from 4.8% to 6.6%, showing a comeback for nuclear power as countries look for clean baseload energy. Solar and wind will lead renewable growth, jumping from 3.5% to 13.5% of global energy.
However, the change is slower than many people expect. Even by 2050, two-thirds of energy will still come from fossil fuels.
Stocks and ETFs to watch:
ICLN (iShares Global Clean Energy ETF) - renewable energy
TAN (Invesco Solar ETF) - solar power companies
FAN (First Trust Global Wind Energy ETF) - wind power
NEE (NextEra Energy) - largest renewable energy producer
ENPH (Enphase Energy) - solar technology
FSLR (First Solar) - solar manufacturing
SMR (NuScale Power) - small modular reactors
CCJ (Cameco) - uranium mining for nuclear
URA (Global X Uranium ETF) - nuclear energy exposure
The World's Largest Economies in 2025
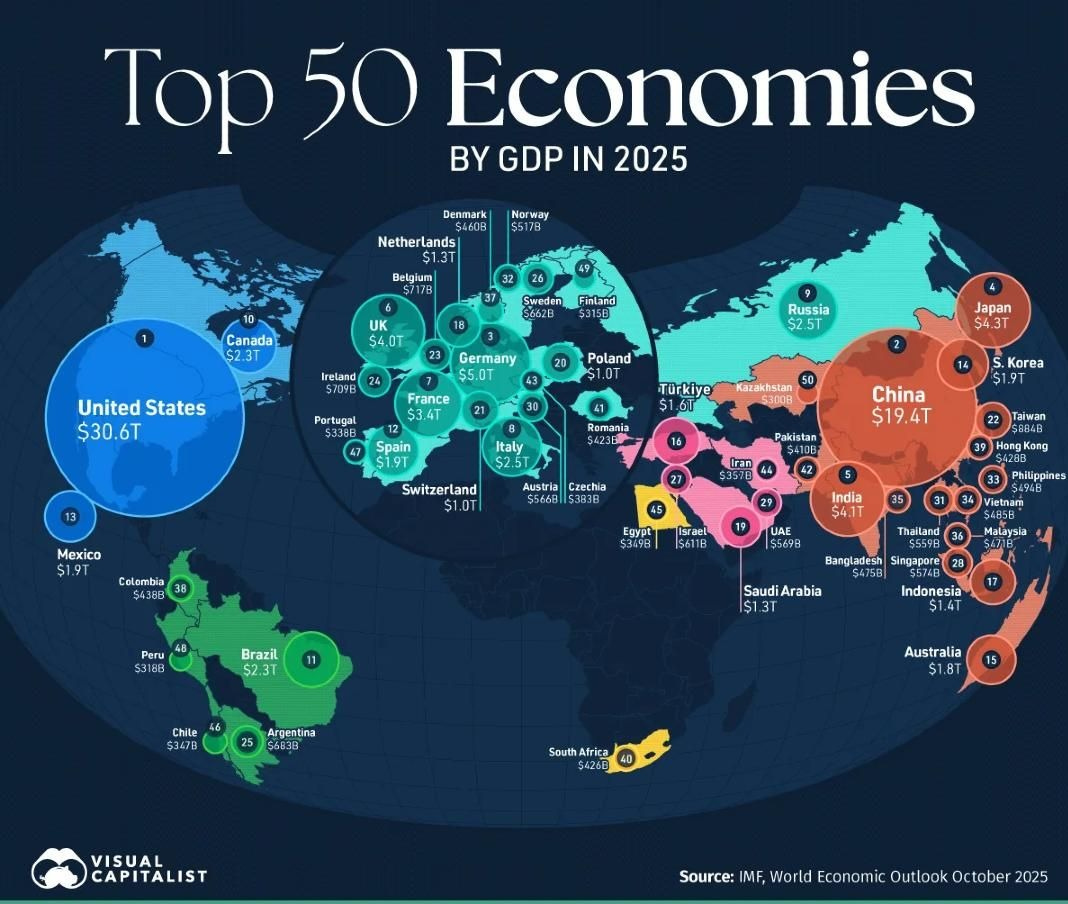
The United States remains the world’s largest economy by far, with a GDP of $30.6 trillion in 2025. China is second at $19.4 trillion, followed by Japan at $4.3 trillion, India with $4.4 trillion, and Germany at $5.0 trillion. The gap between the U.S. and China is still very large at over $11 trillion.
The UK comes in sixth at $4.0 trillion. France, Italy, Brazil, and Canada round out the top ten.
Emerging markets like Indonesia, Mexico, Turkey, and Saudi Arabia are growing fast. These countries offer strong growth potential as their middle classes expand.
ETFs to watch:
INDA (iShares MSCI India ETF) - India growth
VWO (Vanguard FTSE Emerging Markets) - emerging markets
VEA (Vanguard FTSE Developed Markets) - developed international
VTI (Vanguard Total Stock Market) - total U.S. market
China Dominates 71% of Global Battery Manufacturing
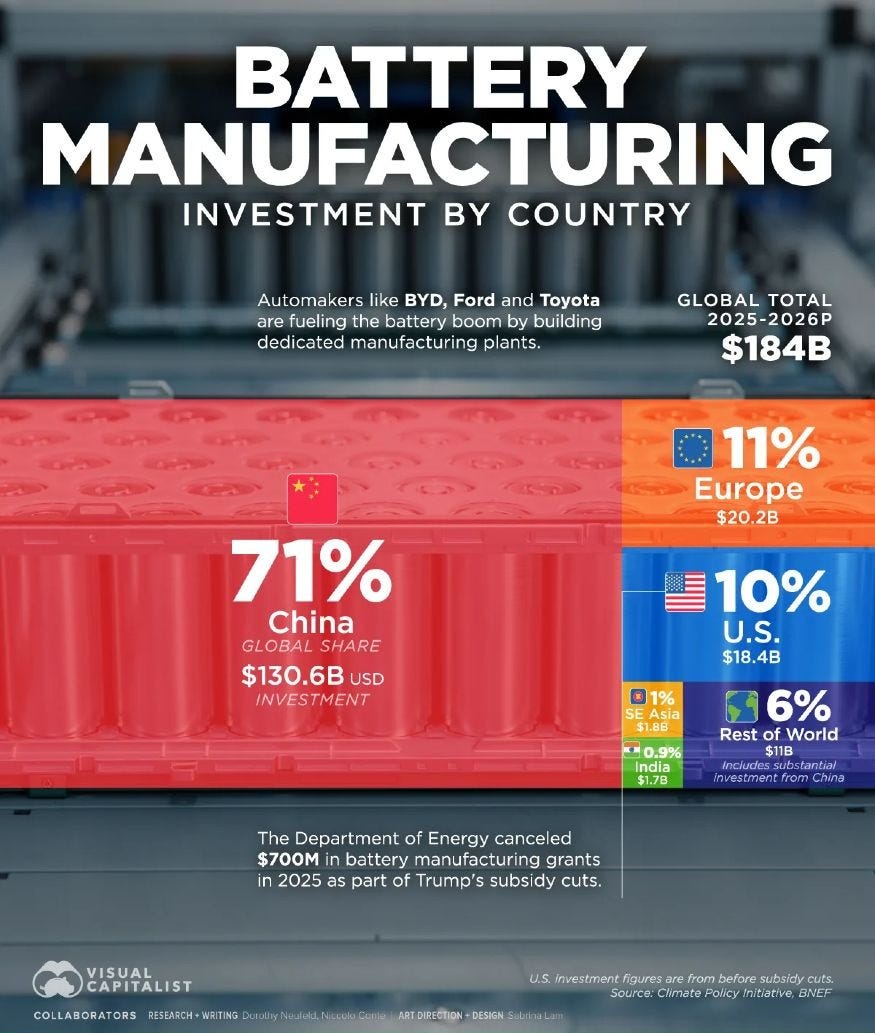
China controls the global battery manufacturing industry with a massive 71% share of all investment. Out of $184 billion in total battery manufacturing investment for 2025-2026, China is investing $130.6 billion. This gives China an enormous lead in the race to supply batteries for electric vehicles and energy storage.
Europe comes in second with just 11% ($20.2 billion), followed by the United States at 10% ($18.4 billion).
This dominance means China controls the entire battery supply chain, from raw materials to finished batteries. Companies like BYD are building massive factories.
Stocks and ETFs to watch:
LIT (Global X Lithium & Battery Tech ETF) - battery industry
BATT (Amplify Lithium & Battery Technology ETF) - battery tech
CATL (Contemporary Amperex) - Chinese battery leader
BYD (BYD Company) - Chinese EV and battery giant
This is not a financial or investing recommendation. It is solely for educational purposes.
Koyfin was used for charts in this analysis. Use this URL to get a special pricing offer of 20% off all Koyfin plans.