

TL;DR: August: +2.50% vs +2.88% for the S&P 500. Since December 2021, the portfolio is up +99.68% vs +66.58% for the index. The August plan from #001 was executed: I sold more SGOV, added to NVDA the day after its report, and started a small RDDT position. One trade was not in the plan (UBER), and I explain it below. Treasuries went from 40% to 33% of the portfolio. This month, every stock position has an updated fair price model, and 6 of 9 stocks are in or at their buy zones. The full math is in the Quick overview at the end of this post.
The track record
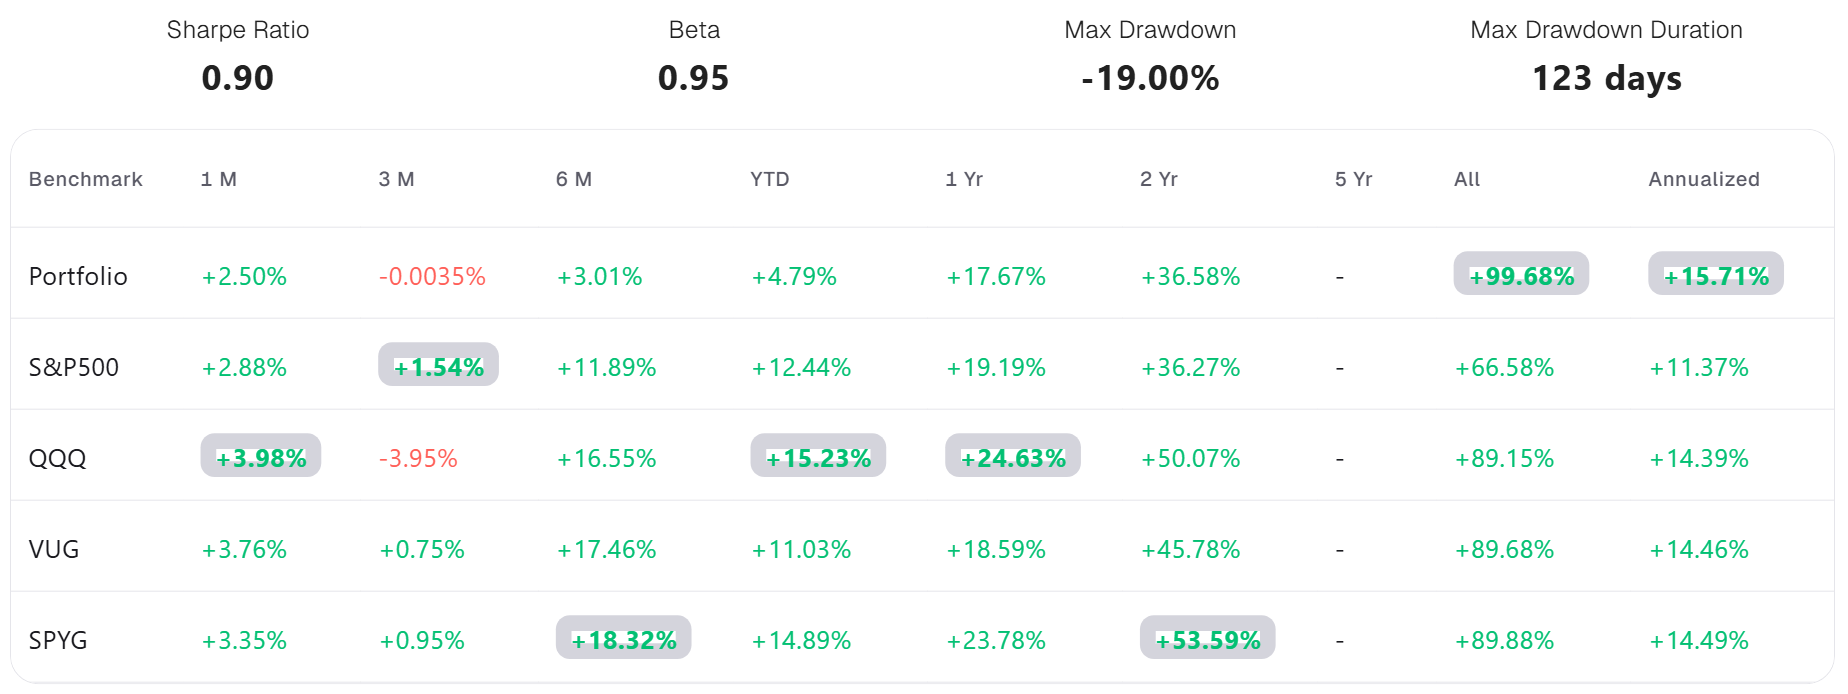
Since inception in December 2021, the portfolio compounds at 15.71% a year - ahead of the S&P 500 (11.37%), QQQ (14.39%), VUG (14.46%), and SPYG (14.49%). Beta is 0.95; the max drawdown is -19%. The method is unchanged and documented in issue #001: TWR returns via Portseido, percentages and not dollars, 4 benchmarks.
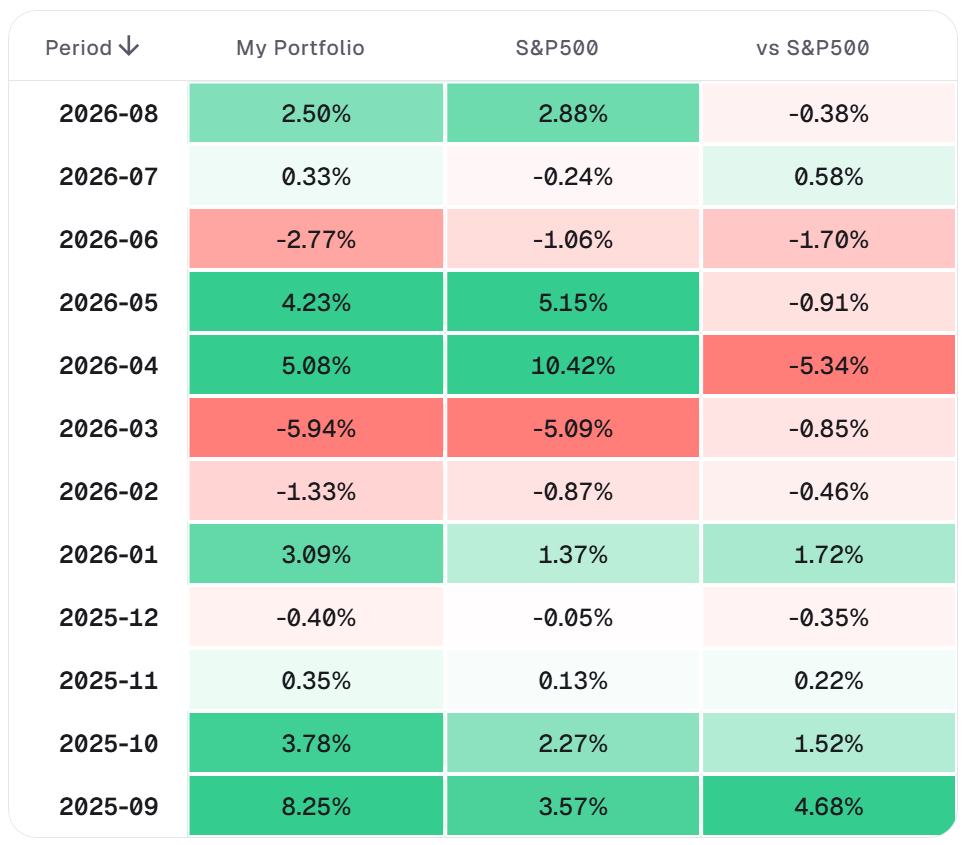
August was an average month: +2.50% vs +2.88% for the index. YTD, I remain behind: +4.79% vs +12.44%. The reason is the same as in #001: a large treasury block while the market keeps running. That block got smaller in August - the details are below.
Analyst’s note:
All numbers in this issue are as of August 30, 2026 - the last trading day included is Friday, August 28.
