

In Part 1, I made the following argument: the lowest-cost energy is now also the fastest-growing, and market prices have not fully adjusted to that fact. Solar met about 75% of the growth in global electricity demand in 2025. A four-hour battery undercut a new gas plant for the first time, at $78 against $102 per MWh. And investors worldwide committed roughly two dollars to clean energy for every one to oil, gas, and coal.
This part is the watch list. Below are the companies I selected as the most interesting to watch.
Content:
Solar: First Solar
Power & Nuclear: Vistra
The Grid: Hubbell
Materials: SQM
Transport: Geely Automobile
Other Companies and Funds
Solar: First Solar (FSLR)
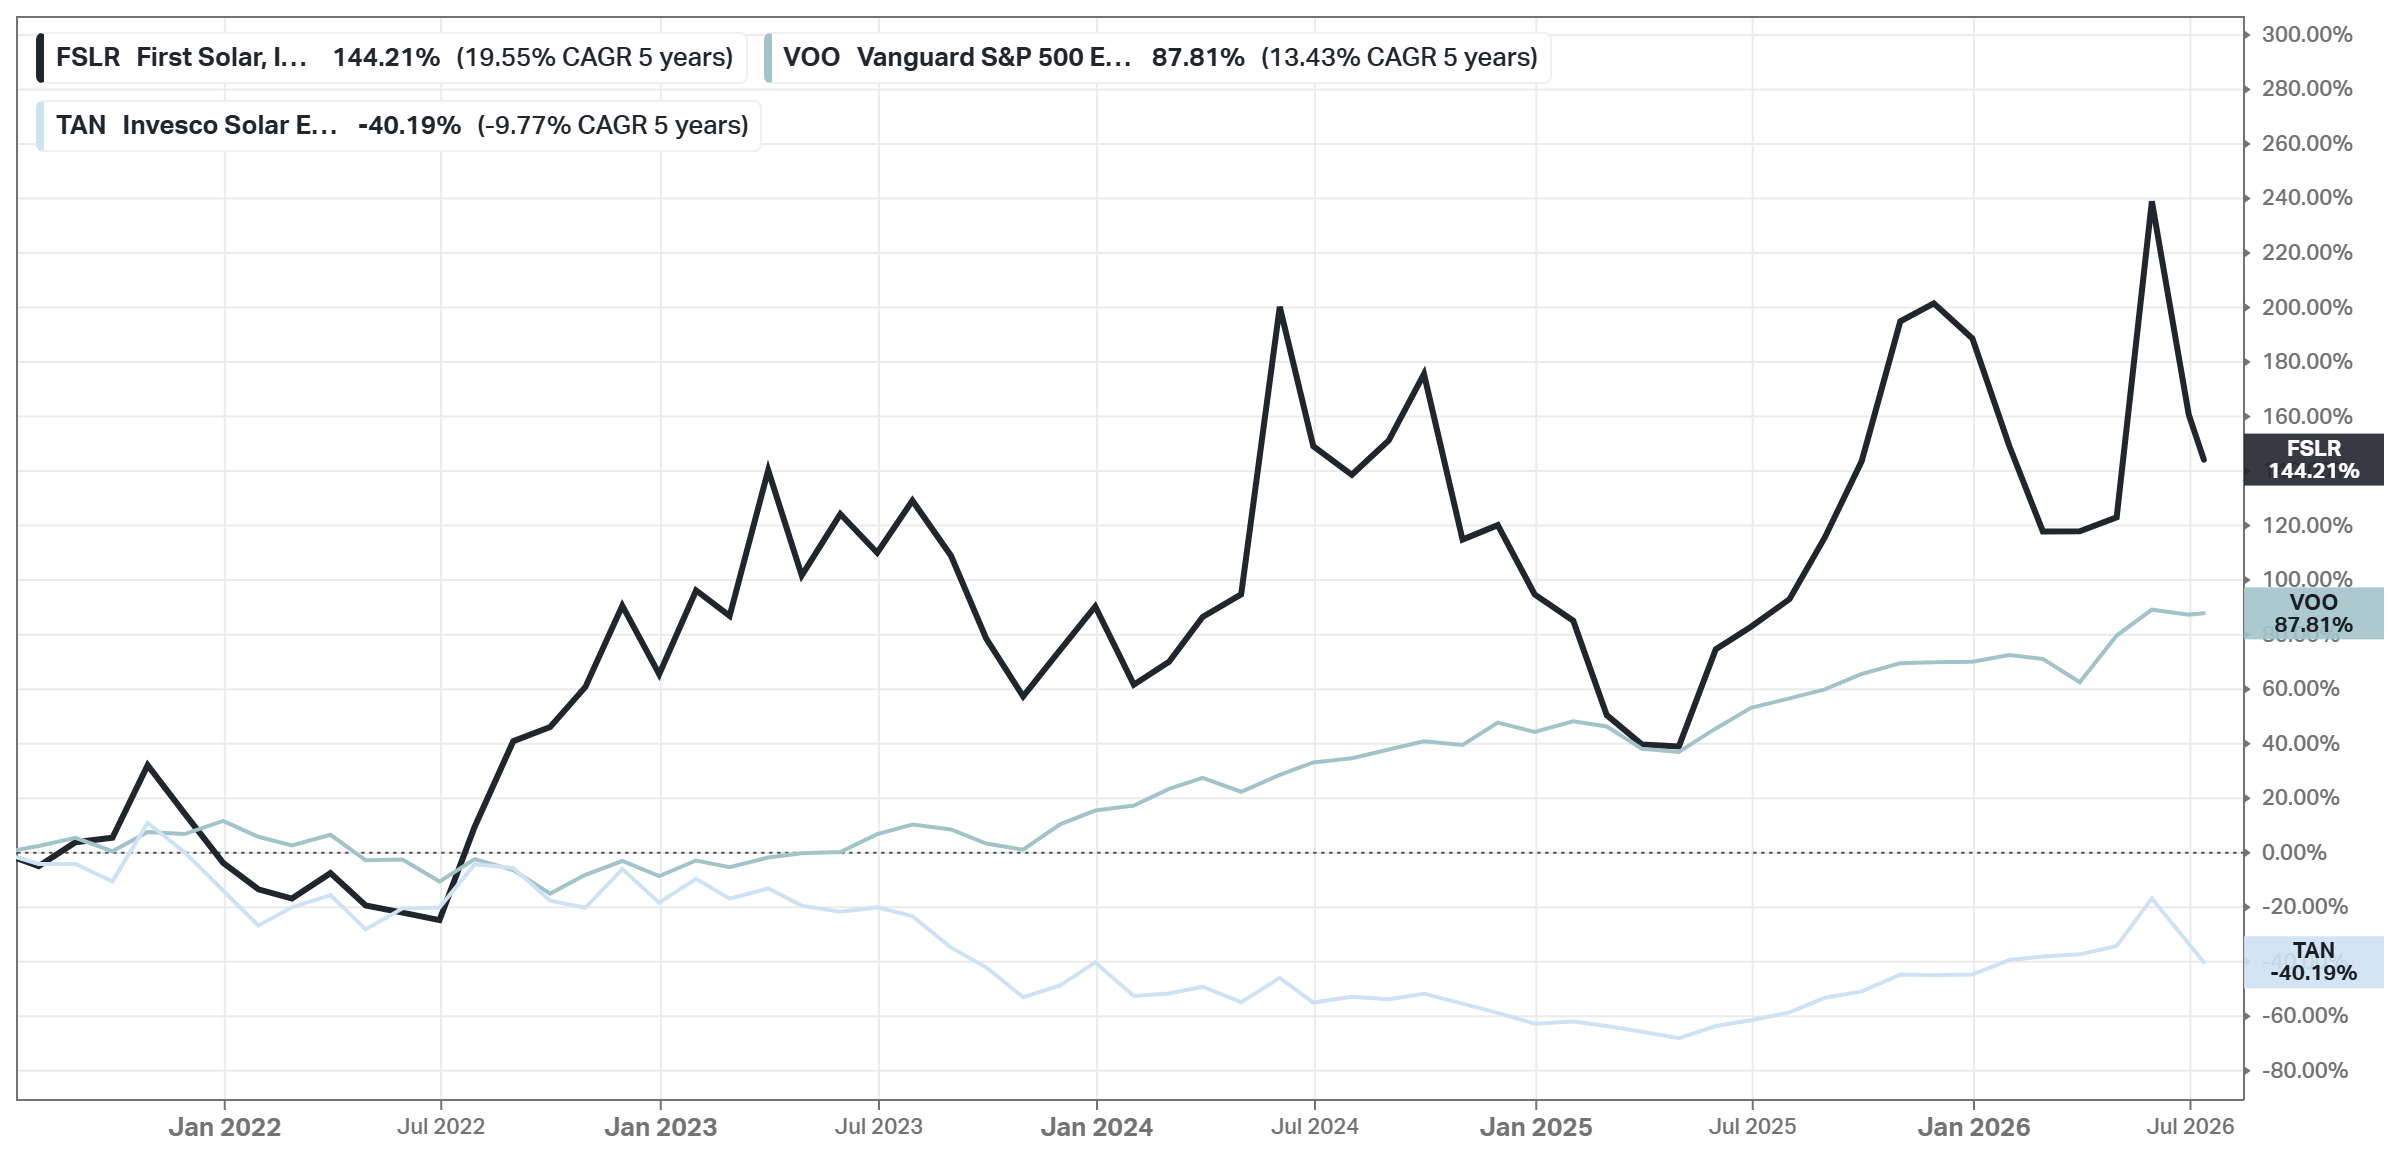
First Solar designs and manufactures solar photovoltaic panels, modules, and systems for use in utility-scale development projects. The company's solar modules use cadmium telluride to convert sunlight into electricity. This is commonly called thin-film technology. First Solar is the world’s largest thin-film solar module manufacturer. It has production lines in Vietnam, Malaysia, the United States, and India.
A supply chain with no polysilicon and almost no Chinese materials.
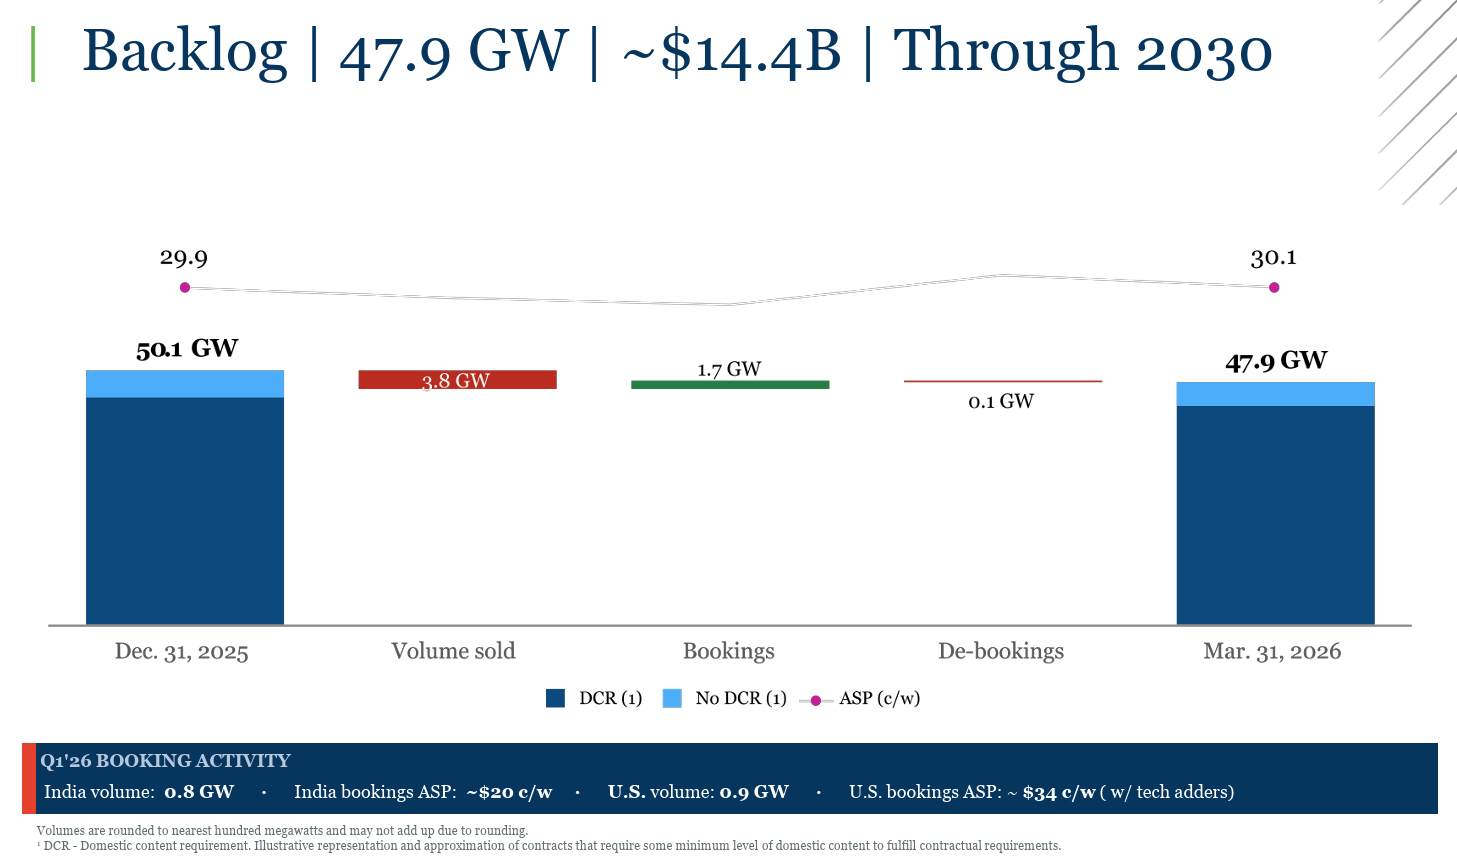
Q1 2026: revenue $1.04B (+24% YoY), EPS +65%, gross margin 47%; backlog of 47.9 GW worth $14.4B, booked through 2030.
Roughly 12x 2026 guided earnings for a 47%-gross-margin business; consensus targets $252. Cheap for a reason - and the reason is political, not operational.
Valuation (Current vs 5Y):
Price/Forward Earnings: 11.8x vs 30.8x
Price/Forward Sales: 4.6x vs 4.1x
Price/FCF: 14.7x vs 29.1x
PEG: 0.58 vs 2.31
Earnings Yield: 7.0% vs 1.56%
Growth:
EPS Forward 5Y CAGR: 20.42%
Price Analyst Estimates 1Y: $252, +14%
Analyst Rating: Buy
Financial Position:
Market Cap: $24.48B
Total Debt: $587.12M
Cash & Inv.: $2.43B
Enterprise Value: $22.64B
FCF: $1.67B
Management Effectiveness (Current vs 5Y):
ROIC: 16.15% vs 8.31%
ROE: 18.44% vs 10.72%
ROA: 8.45% vs 4.53%
Margins:
Gross Profit: 41.74% vs 30.75%
Net Income: 30.73% vs 19.40%
FCF: 30.78% vs -7.91%

Advantages:
Policy monopoly. 45X credits at full value through 2029, FEOC rules and 100–234% tariffs punish every competitor - not First Solar.
Visibility. Sold out for years, with margins a module maker has never had before.
Technology option. Its own perovskite-tandem research line (Evolar) on top of CdTe.
Disadvantages:
Politics. Earnings depend heavily on the 45X credit; Washington is the real risk, not competitors.
Post-2027. US project credit deadlines expire, which could thin the order pipeline for a while.
Single technology. Everything rides on CdTe; if Chinese tandem cells scale faster abroad, the moat becomes policy-only.
Power & Nuclear: Vistra (VST)
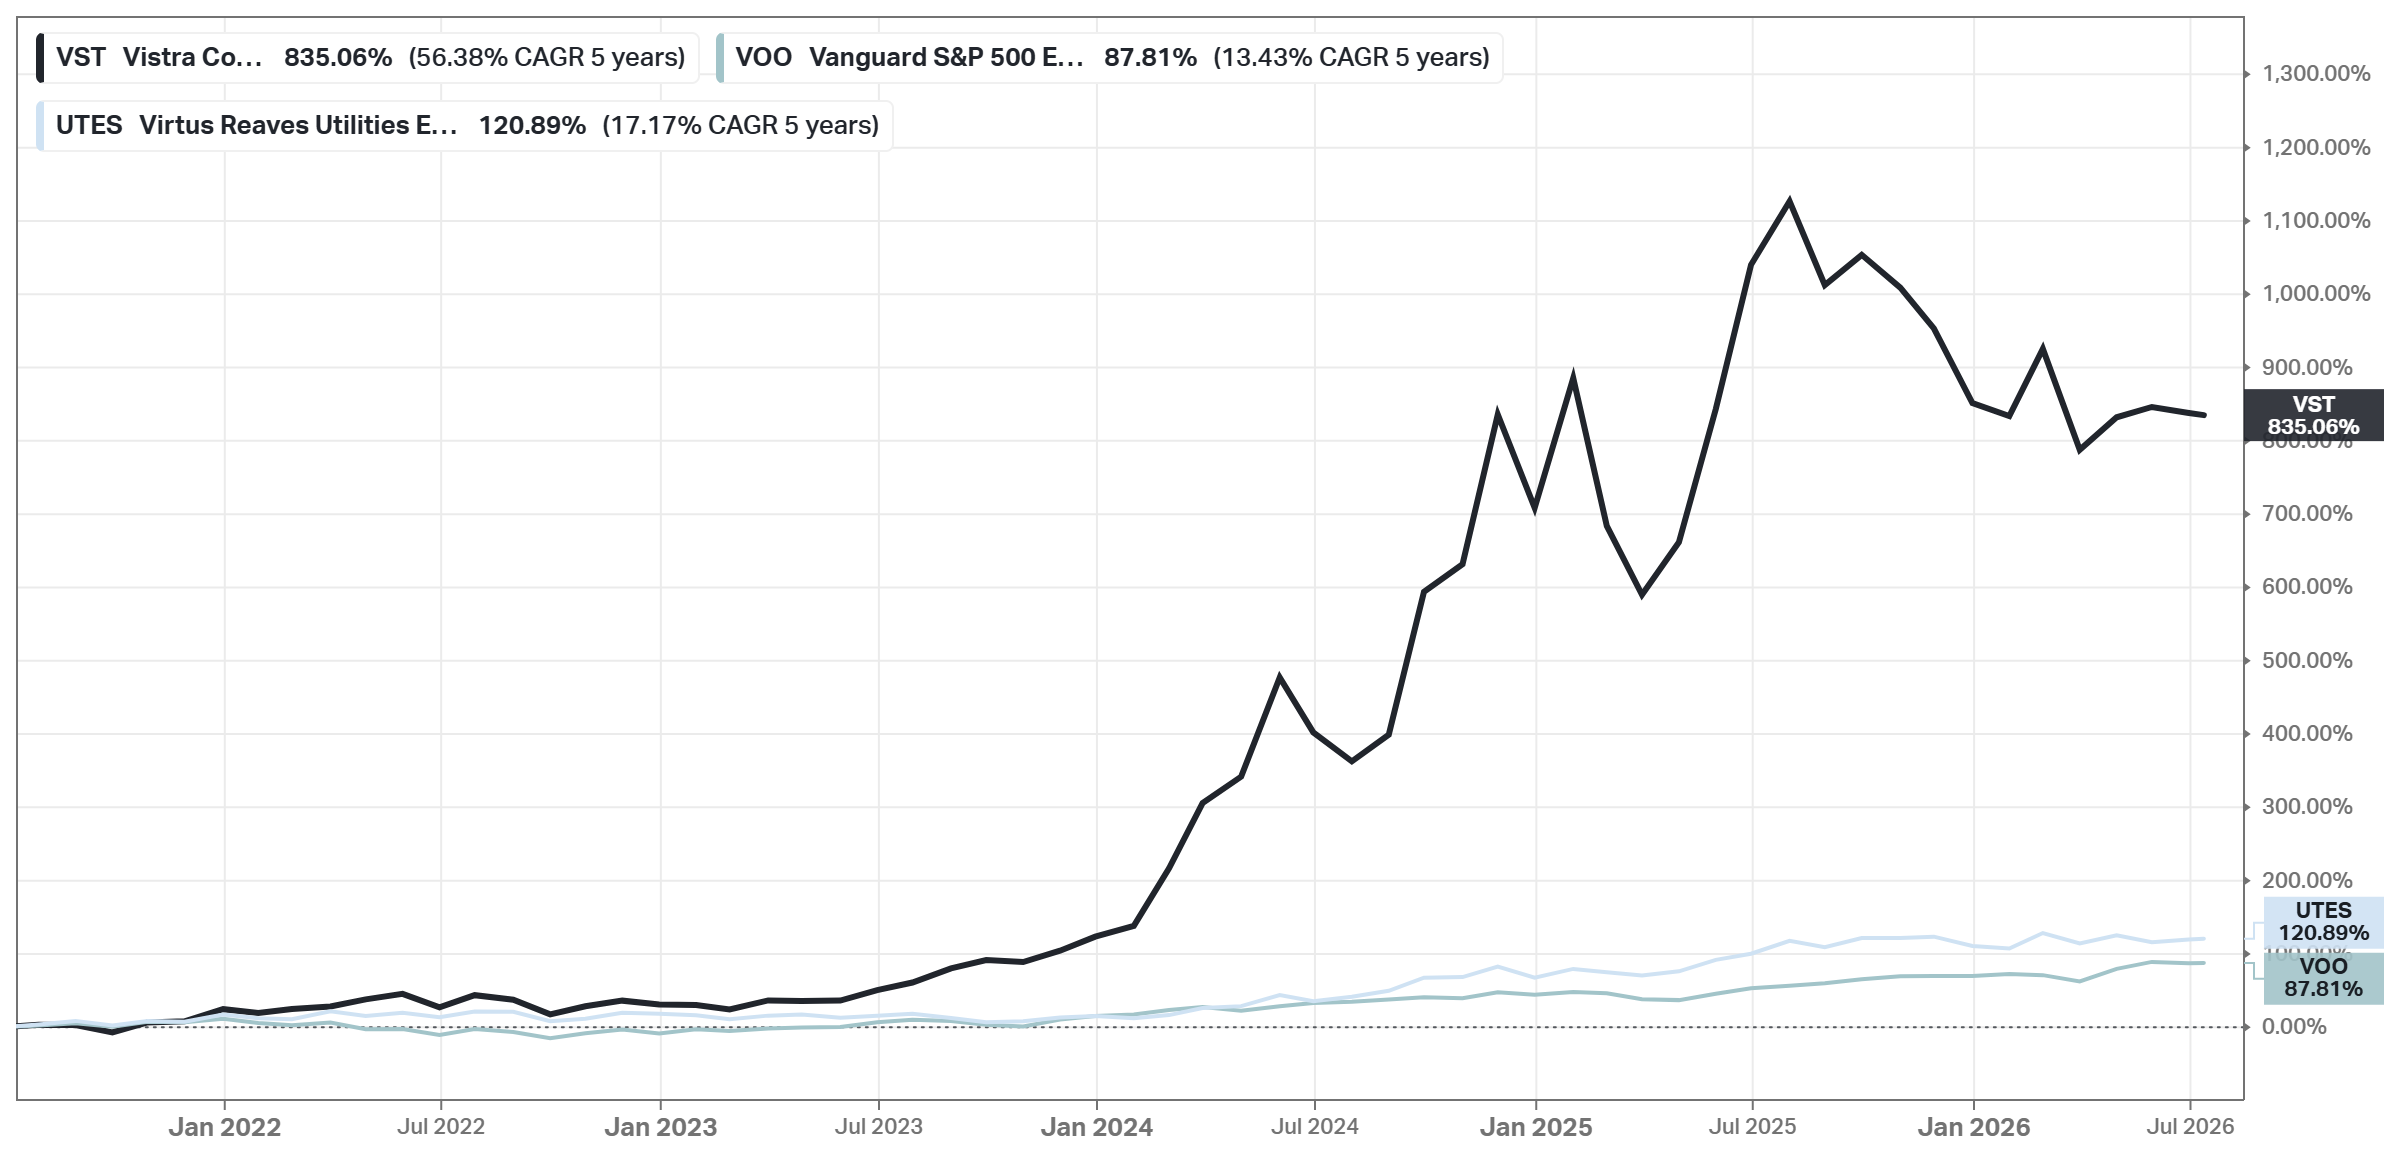
Vistra Corp. is one of the largest power producers and retail energy providers in the US. It owns 44 gigawatts of generation capacity, including natural gas (27 GW), nuclear (6.5 GW), coal (8.7 GW), and solar and battery storage (1.3 GW). The Cogentrix acquisition will add 5.5 GW of gas generation.
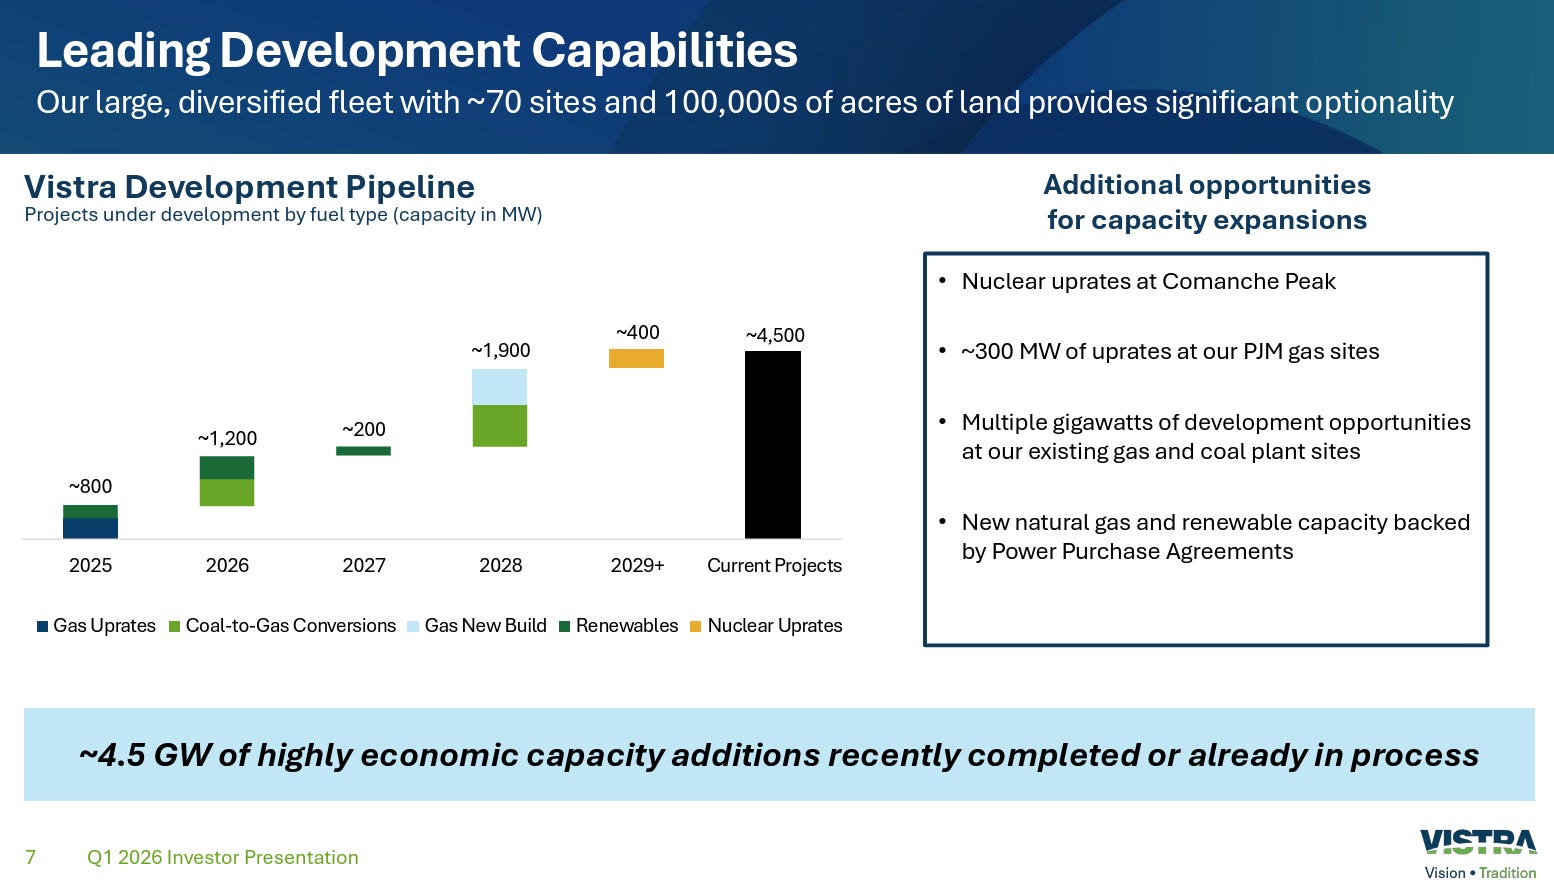
Vistra's retail electricity business serves 5 million customers in 20 states, including almost a third of all Texas electricity consumers. Vistra emerged from the Energy Future Holdings bankruptcy as a stand-alone entity in 2016.
~3,800 MW of signed hyperscaler nuclear PPAs - 1,200 MW to Amazon at Comanche Peak plus the 2,609 MW Meta deal.
Valuation (Current vs 5Y):
Price/Forward Earnings: 17.6x vs 16.4x
Price/Forward Sales: 2.0x vs 1.4x
Price/FCF: 29.7x vs 20.4x
PEG: 0.39 vs 4.37
Growth:
EPS Forward 5Y CAGR: 45.48%
Price Analyst Estimates 1Y: $223, +41%
Analyst Rating: Strong Buy
Financial Position:
Market Cap: $53.56B
Total Debt: $19.93B
Cash & Inv.: $658.00M
Enterprise Value: $75.32B
FCF: $1.80B
Management Effectiveness (Current vs 5Y):
ROIC: 12.90% vs 6.29%
ROE: 42.90% vs 14.39%
ROA: 6.02% vs 2.64%
Margins:
Gross Profit: 38.64% vs 29.65%
Net Income: 11.52% vs 3.77%
FCF: 9.27% vs 7.53%

Advantages:
Signed proof. ~3,800 MW of hyperscaler nuclear PPAs - Amazon and Meta, not letters of intent.
An actual pullback. About 27% below its high at ~10.8x EV/EBITDA - rare in this group.
Platform breadth. Nuclear, gas, storage, and retail in the fastest-growing power market (Texas), with Cogentrix adding capacity.
Disadvantages:
No regulated floor. Full merchant exposure to power prices.
The gas question. A heavy gas fleet undercuts the “clean” label and adds fuel risk.
Delivery is later. The Amazon nuclear deal starts flowing only from late 2027.
The Grid: Hubbell (HUBB)
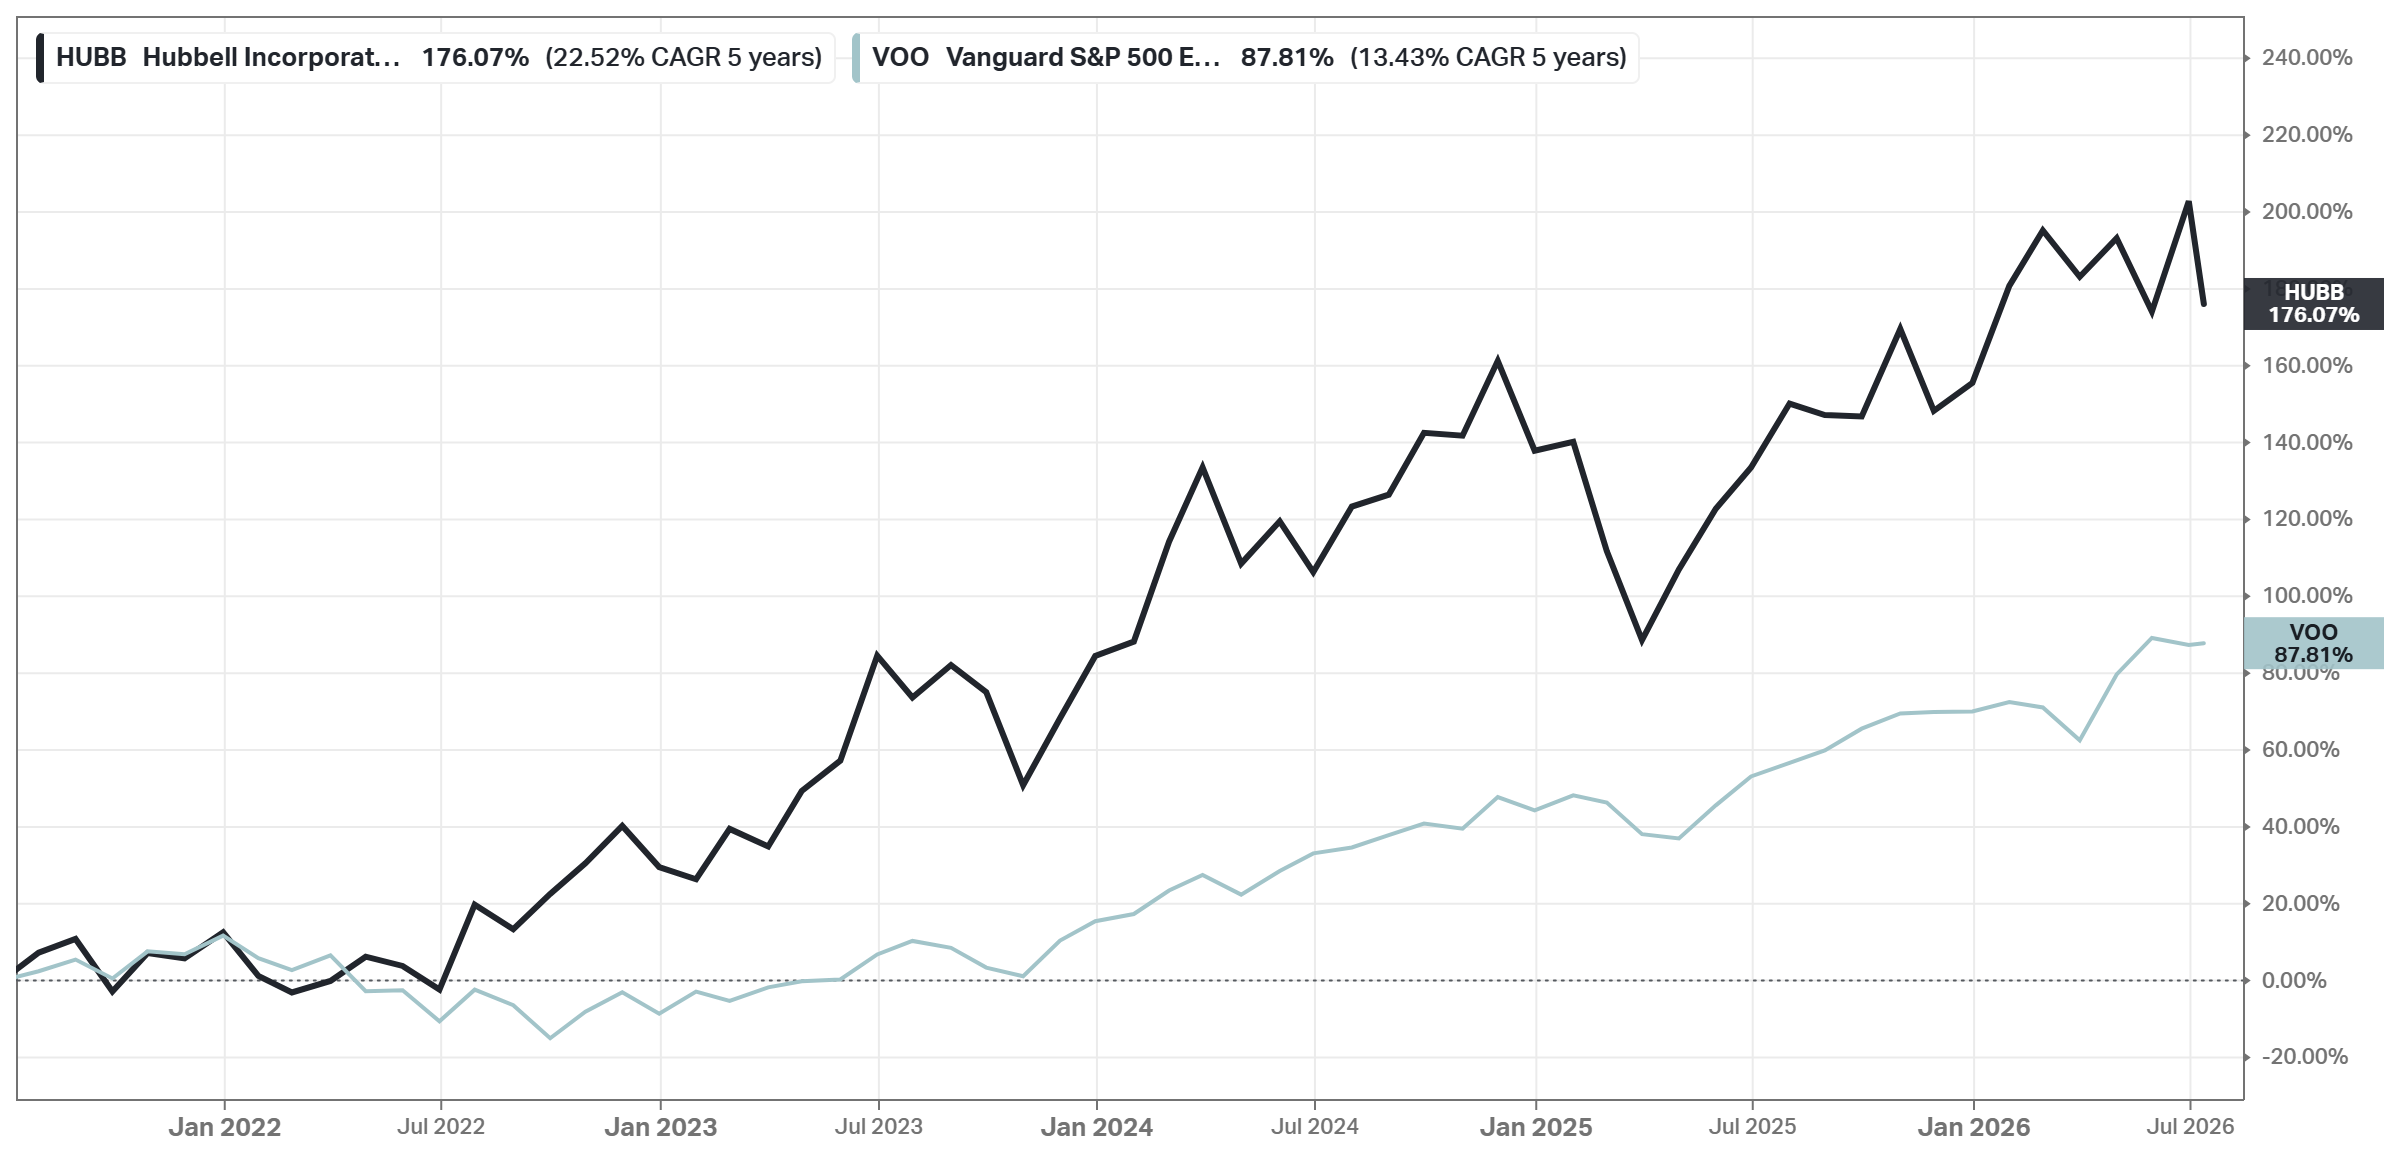
Founded in 1888 by Harvey Hubbell, the eponymous company was the conduit through which the pull-chain lamp socket was originally sold. Hubbell has since grown into an electricity transmission and distribution behemoth, housing more than 75 brands that sell components found on power lines, in electrical substations, and in commercial and industrial buildings.
The company's primary operations are in the United States, where around 90% of revenue is derived.
Connectors, enclosures, and arresters - the small parts every grid upgrade needs.
Valuation (Current vs 5Y):
Price/Forward Earnings: 23.7x vs 22.2x
Price/Forward Sales: 3.7x vs 3.1x
Price/FCF: 28.4x vs 27.9x
PEG: 2.37 vs 1.99
Earnings Yield: 3.55 vs 3.60
Growth:
EPS Forward 5Y CAGR: 10.00%
Price Analyst Estimates 1Y: $554, +17%
Analyst Rating: Buy
Financial Position:
Market Cap: $25.73B
Total Debt: $2.74B
Cash & Inv.: $516.90M
Enterprise Value: $27.96B
FCF: $909.30M
Management Effectiveness (Current vs 5Y):
ROIC: 15.82% vs 15.47%
ROE: 25.82% vs 23.95%
ROA: 10.19% vs 9.30%
Margins:
Gross Profit: 35.68% vs 32.47%
Net Income: 15.10% vs 12.79%
FCF: 15.16% vs 12.18%

Advantages:
Same wave, half the price. ~24x forward - about half Quanta’s multiple for the same utility capex cycle.
Components, not projects. Thousands of small orders instead of lumpy contracts - low single-project risk.
Raised outlook. Grid Infrastructure +18% with full-year guidance lifted.
Disadvantages:
Soft spots. The meters/automation segment is shrinking.
High expectations.
Acquisition digestion. The $3B NSI deal adds integration risk to a steady story.
Materials: SQM (SQM)
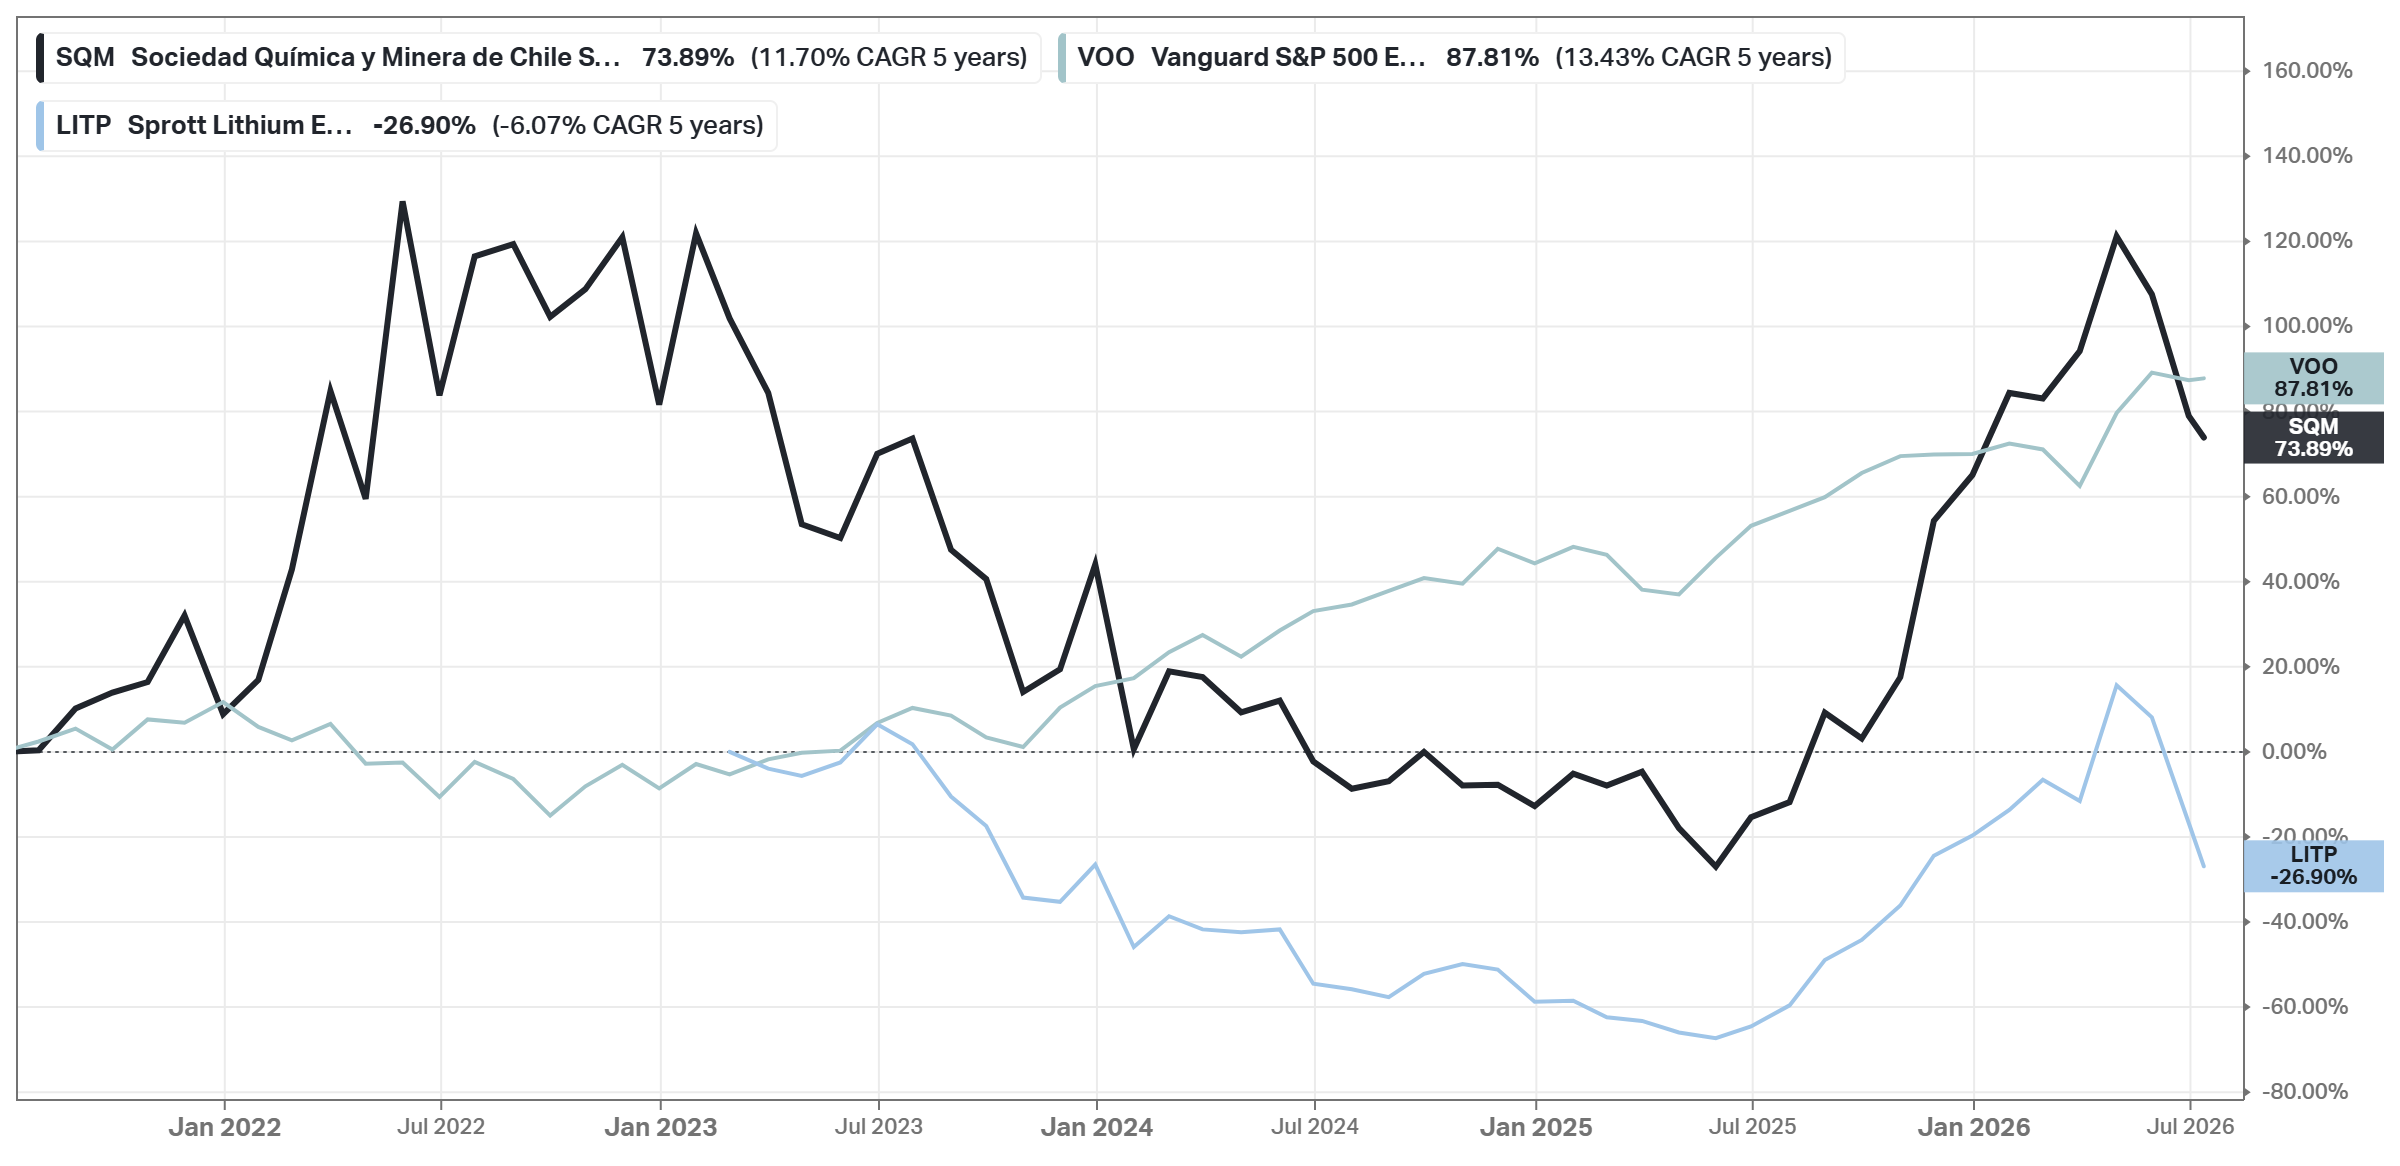
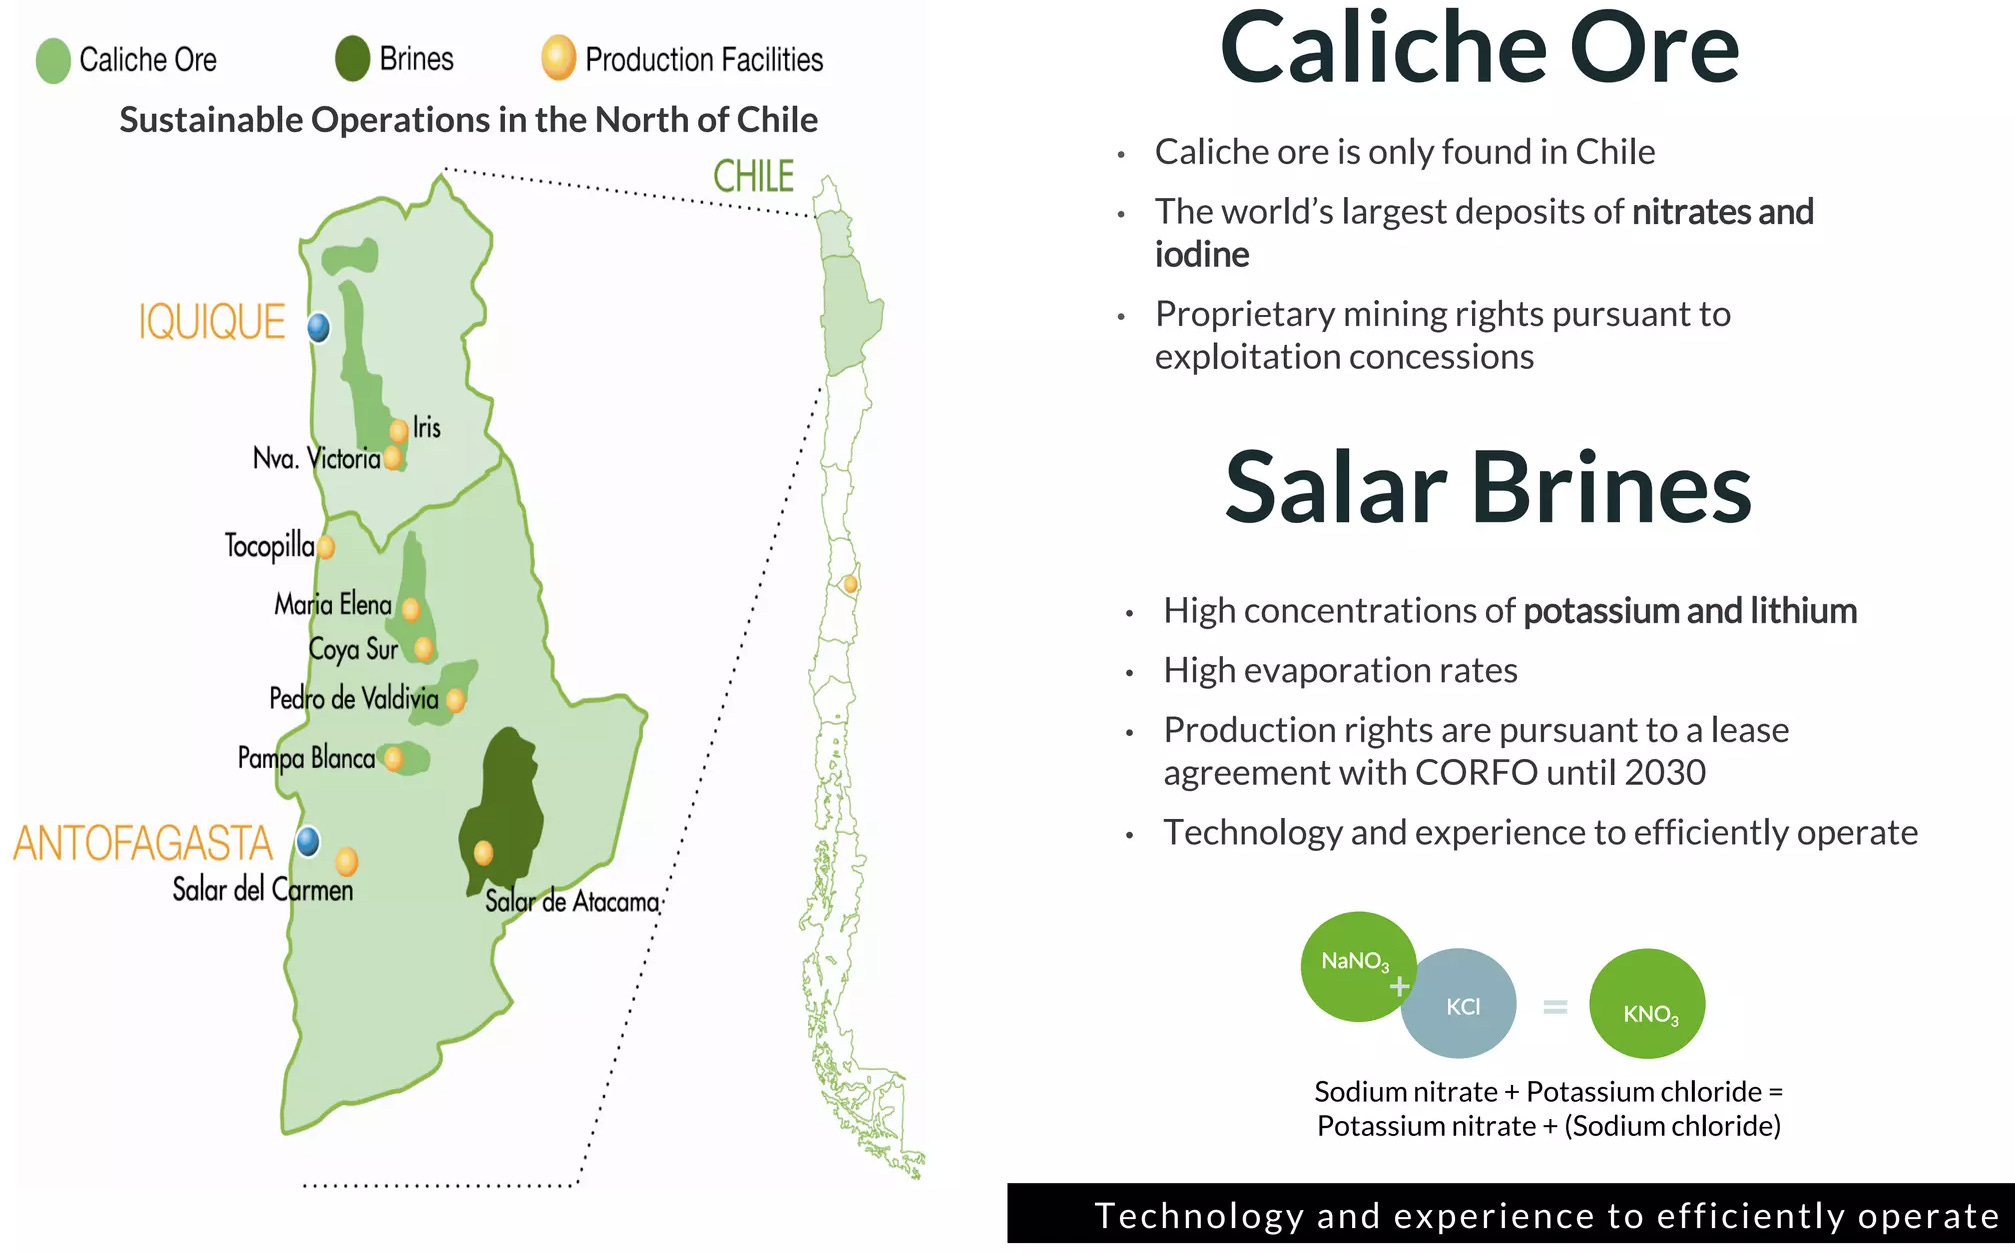
Sociedad Quimica y Minera de Chile is a Chilean commodities producer with significant operations in lithium (primarily used in batteries for electric vehicles and energy storage systems), specialty and standard potassium fertilizers, iodine (primarily used in X-ray contrast media), and solar salts. The company extracts these materials through its high-quality salt brine deposits and caliche ore.
SQM also sells lithium concentrate from a joint venture hard rock lithium project in Australia and is expanding its lithium refining assets in China.
Valuation (Current vs 5Y):
Price/Forward Earnings: 8.5x vs 12.2x
Price/Forward Sales: 2.4x vs 2.9x
Price/FCF: 19.1x vs 80.7x
PEG: 0.17 vs 1.44
Earnings Yield: 3.97% vs 2.11%
Growth:
EPS Forward 5Y CAGR: 49.69%
Price Analyst Estimates 1Y: $84.50, +18%
Analyst Rating: Buy
Financial Position:
Market Cap: $20.69B
Total Debt: $5.21B
Cash & Inv.: $3.86B
Enterprise Value: $24.42B
FCF: $1.08B
Management Effectiveness (Current vs 5Y):
ROIC: 19.03% vs 7.93%
ROE: 33.64% vs 13.40%
ROA: 15.77% vs 7.20%
Margins:
Gross Profit: 34.46% vs 39.02%
Net Income: 15.38% vs 18.65%
FCF: 15.16% vs 12.18%

Advantages:
Bottom of the cost curve. The cheapest lithium on Earth, at ~8.5x forward earnings.
Tenure solved. The Codelco deal locks Atacama rights to 2060 and adds quota.
A built-in cushion. The iodine business carried margins through the entire lithium winter.
Disadvantages:
Shared economics. Chile takes a large slice, and Codelco assumes operational control from 2031.
Re-glut risk. Restarting Chinese and African supply would hit prices first and hardest.
Buyer concentration. Chinese converters set the marginal price for their volumes.
Transport: Geely Automobile (GELHY)
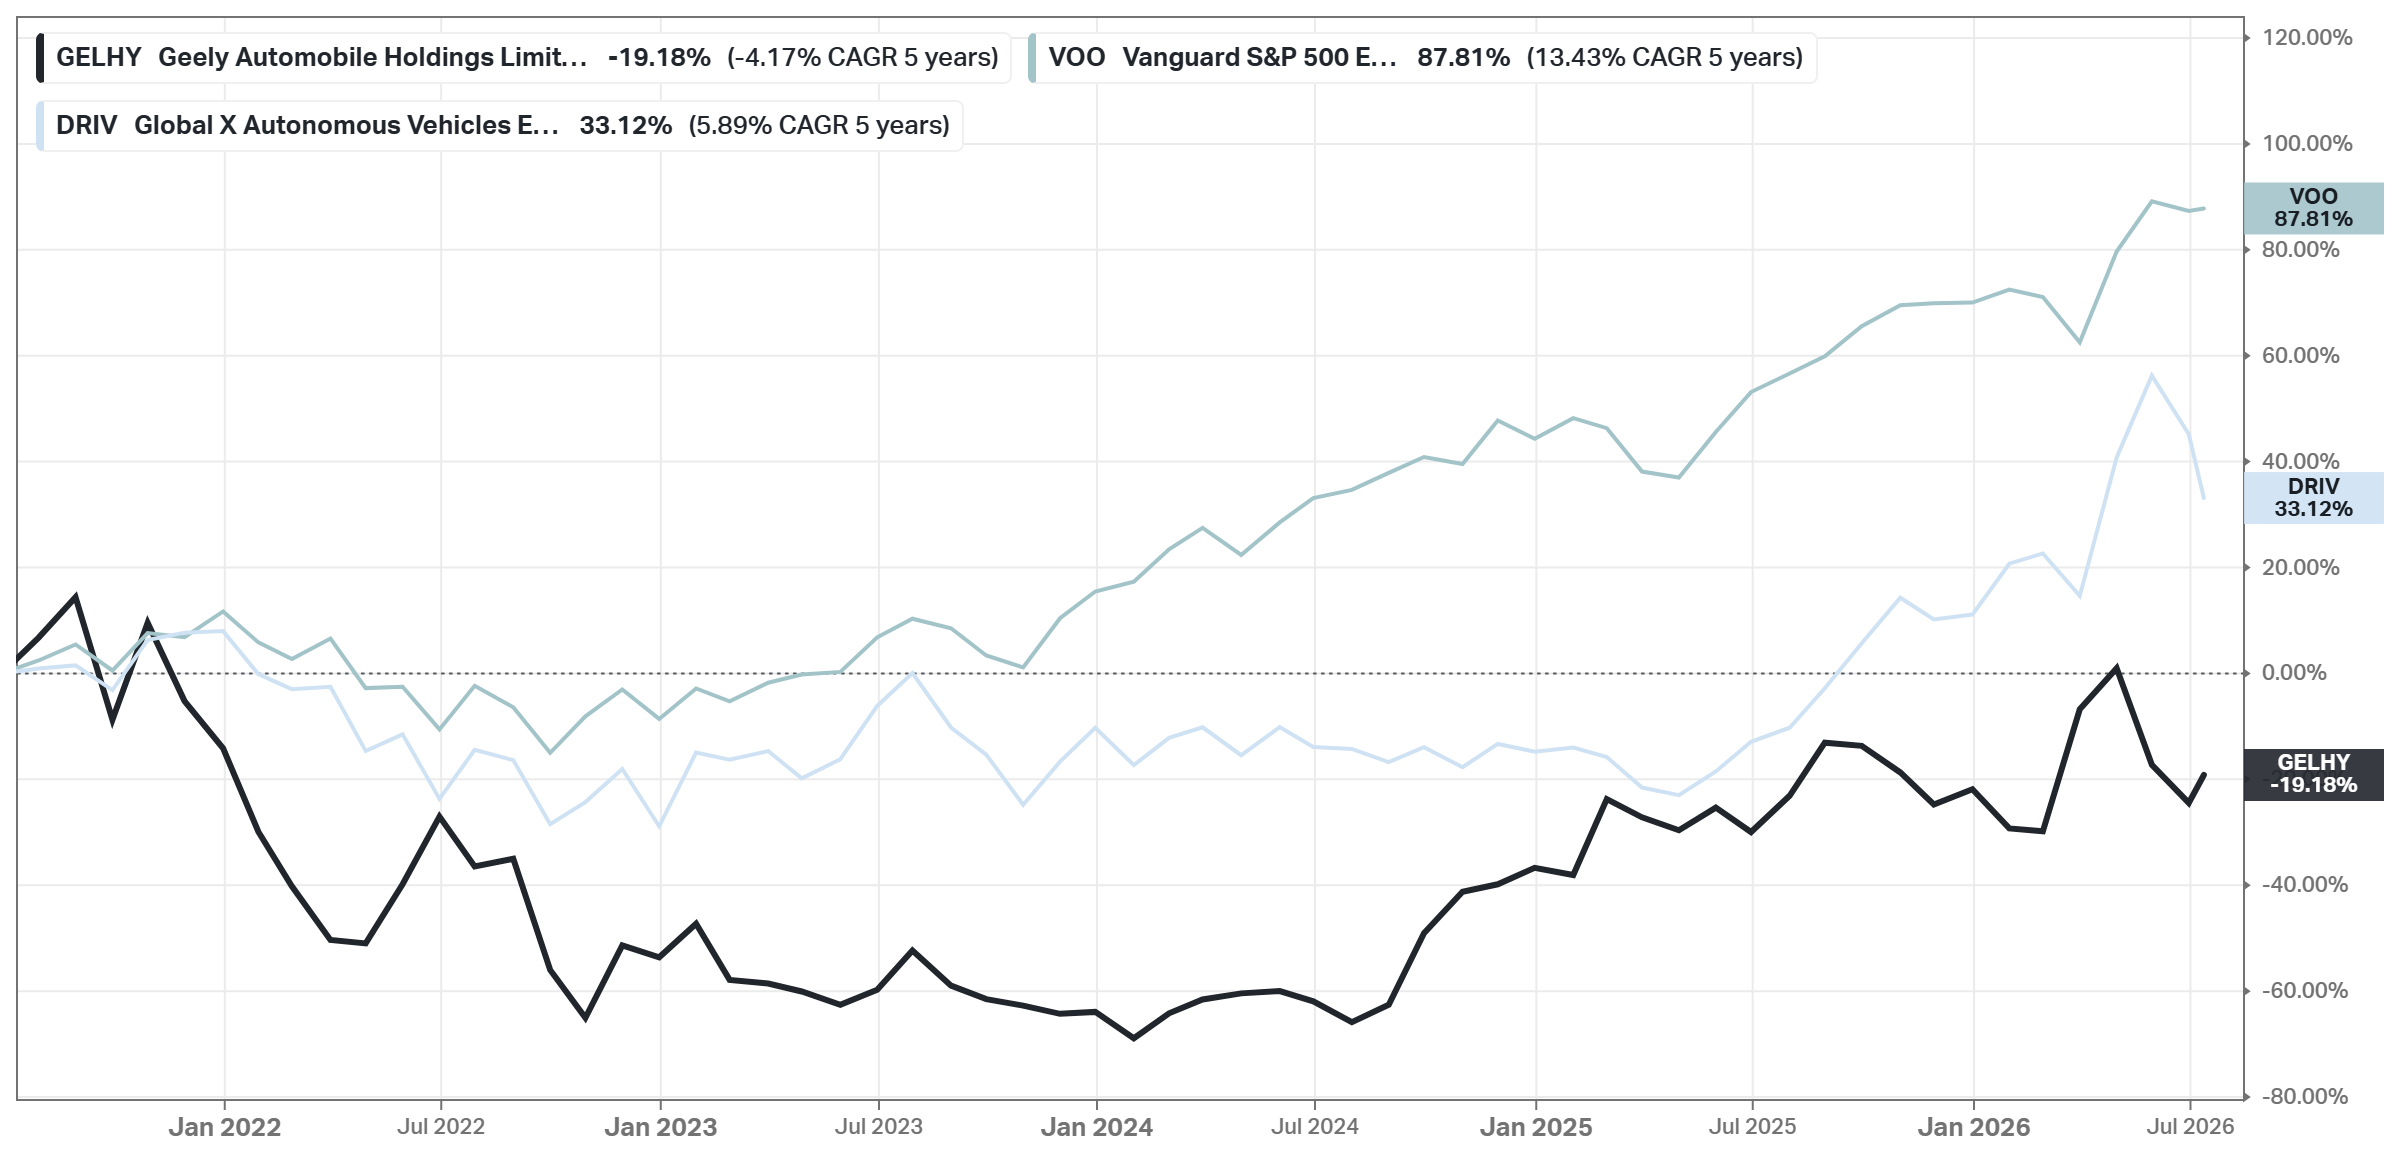
The price war’s rare profitable survivor: NEV sales +90% in 2025, and core net profit +31% in Q1 2026 - during the war; overseas sales passed 100k units a month. A ~$23B valuation for a company selling over 3 million vehicles a year.
Valuation (Current vs 5Y):
Price/Forward Earnings: 7.7x vs 14.0x
Price/Forward Sales: 0.4x vs 0.7x
Price/FCF: 4.9x vs 15.1x
PEG: 0.77 vs 0.78
Earnings Yield: 9.75% vs 5.51%
Growth:
EPS Forward 5Y CAGR: 10.00%
Financial Position:
Market Cap: $25.00B
Total Debt: $2.84B
Cash & Inv.: $8.37B
Enterprise Value: $19.65B
FCF: $6.17B
Management Effectiveness (Current vs 5Y):
ROIC: 8.01% vs 3.91%
ROE: 16.02% vs 11.04%
ROA: 3.00% vs 1.53%
Margins:
Gross Profit: 16.89% vs 15.62%
Net Income: 4.31% vs 4.70%
FCF: 12.50% vs 10.88%

Advantages:
Profitable during the war. Core net profit +31% in Q1 2026 while rivals bled.
Overseas momentum. Past 100k units a month abroad, with Zeekr deliveries +86%.
Casualty pricing. ~$23B for 3M+ annual vehicles - among the cheapest large automakers anywhere.
Disadvantages:
Bought volume. ~15% average discounts keep the machine running.
Structural complexity. Zeekr privatization and brand mergers make the group hard to read.
China risk. If Beijing can’t stop the price war, even the winners keep bleeding.
Other Companies and Funds
I’ll pull some current data first so the numbers in this section match the mid-2026 figures used throughout the piece. Here’s a draft for the closing section, written to match the voice and structure of the rest of the piece - short theses, honest caveats, and the reason each name missed the main list. Figures are current as of mid-July 2026; you may want to refresh them against Koyfin before publishing.
Other Companies and Funds
The five names above are the list. These are the runner-ups - companies I’d own at a different price, and funds for readers who want the theme without single-stock risk.
Constellation Energy (CEG)
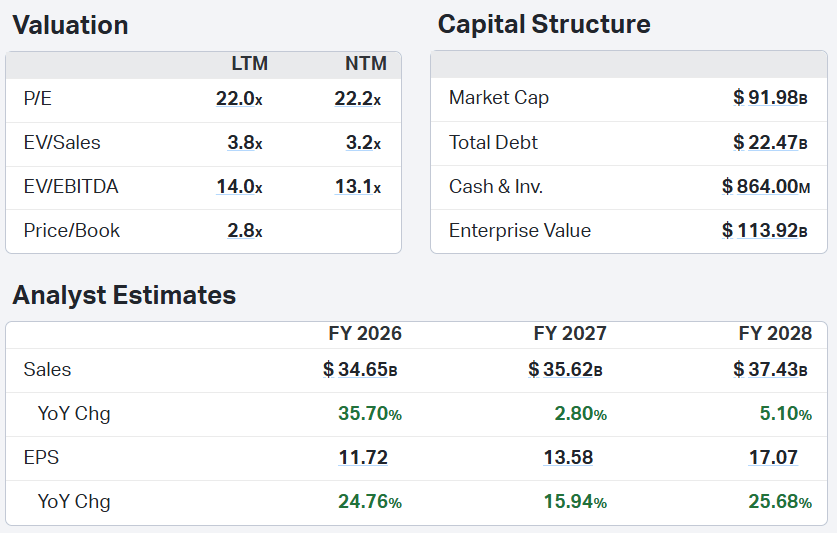
The largest carbon-free fleet in America, now with Calpine attached. Q1 2026 adjusted operating earnings came in at $2.74 per share, up 28% year over year, with revenue up 64% to $11.1B after the Calpine deal closed in January. Management expects 20%+ earnings growth through 2029, yet the stock sits roughly 40% below its October 2025 high. Why it’s not in the main list: Vistra gives you similar hyperscaler exposure at a lower multiple, and the Street’s own model shows growth stalling in early 2027. The pullback is interesting; the premium to Vistra is not.
GE Vernova (GEV)
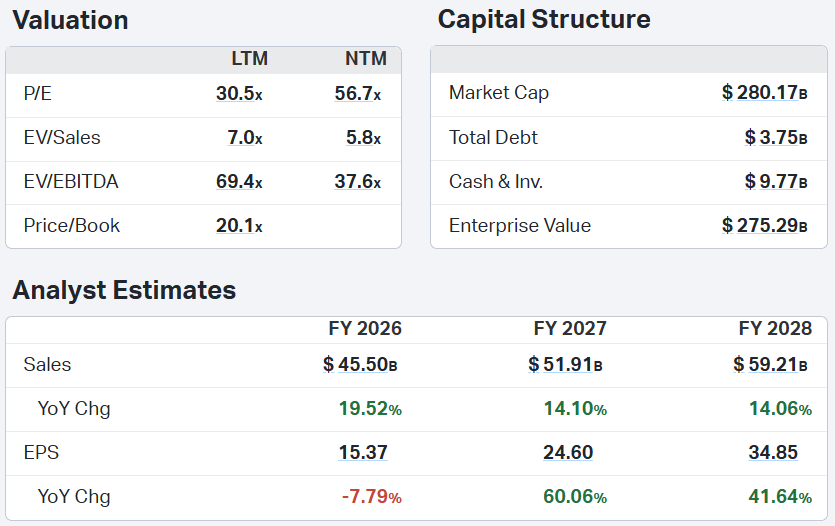
The arms dealer of the power buildout - gas turbines, grid equipment, wind. The problem is the price tag: ~56x forward earnings against an industry average near 18, with a PEG ~1.8. Wonderful business, high valuation. This is the name I’d revisit on a 25%+ drawdown.
Quanta Services (PWR)
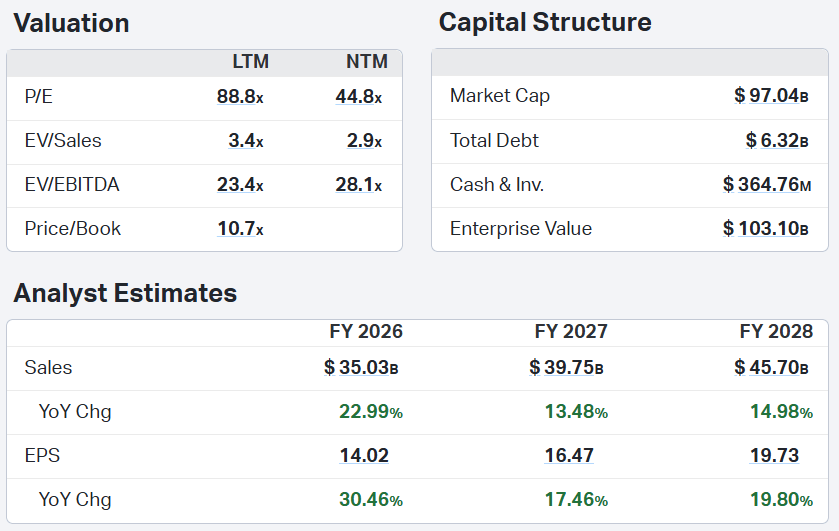
The grid’s general contractor and the purest labor play on transmission capex. I took Hubbell instead - same wave, roughly half the multiple, and components carry less single-project risk than contracts.
BYD (BYDDY)
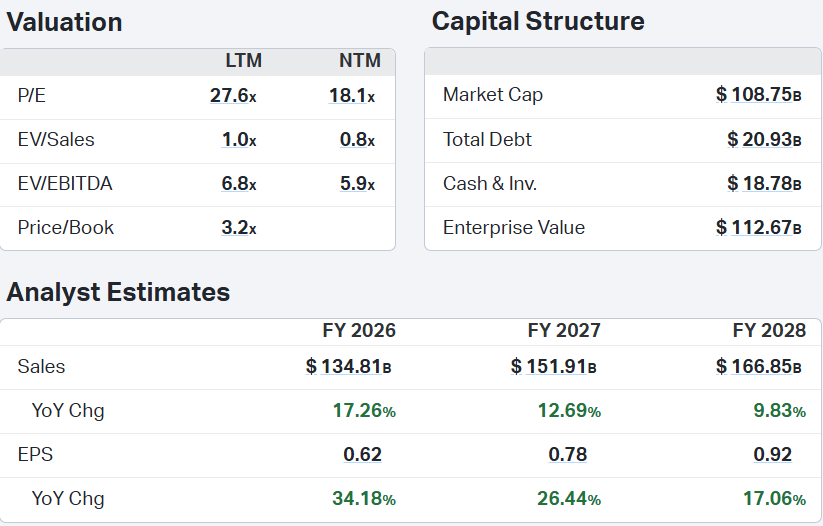
The obvious alternative to Geely, and the bigger machine. But it’s also the price war’s aggressor, and Geely offers the same survivor economics at a steeper discount to sales. If you want two Chinese autos, this is the second.
Brookfield Renewable (BEP/BEPC)
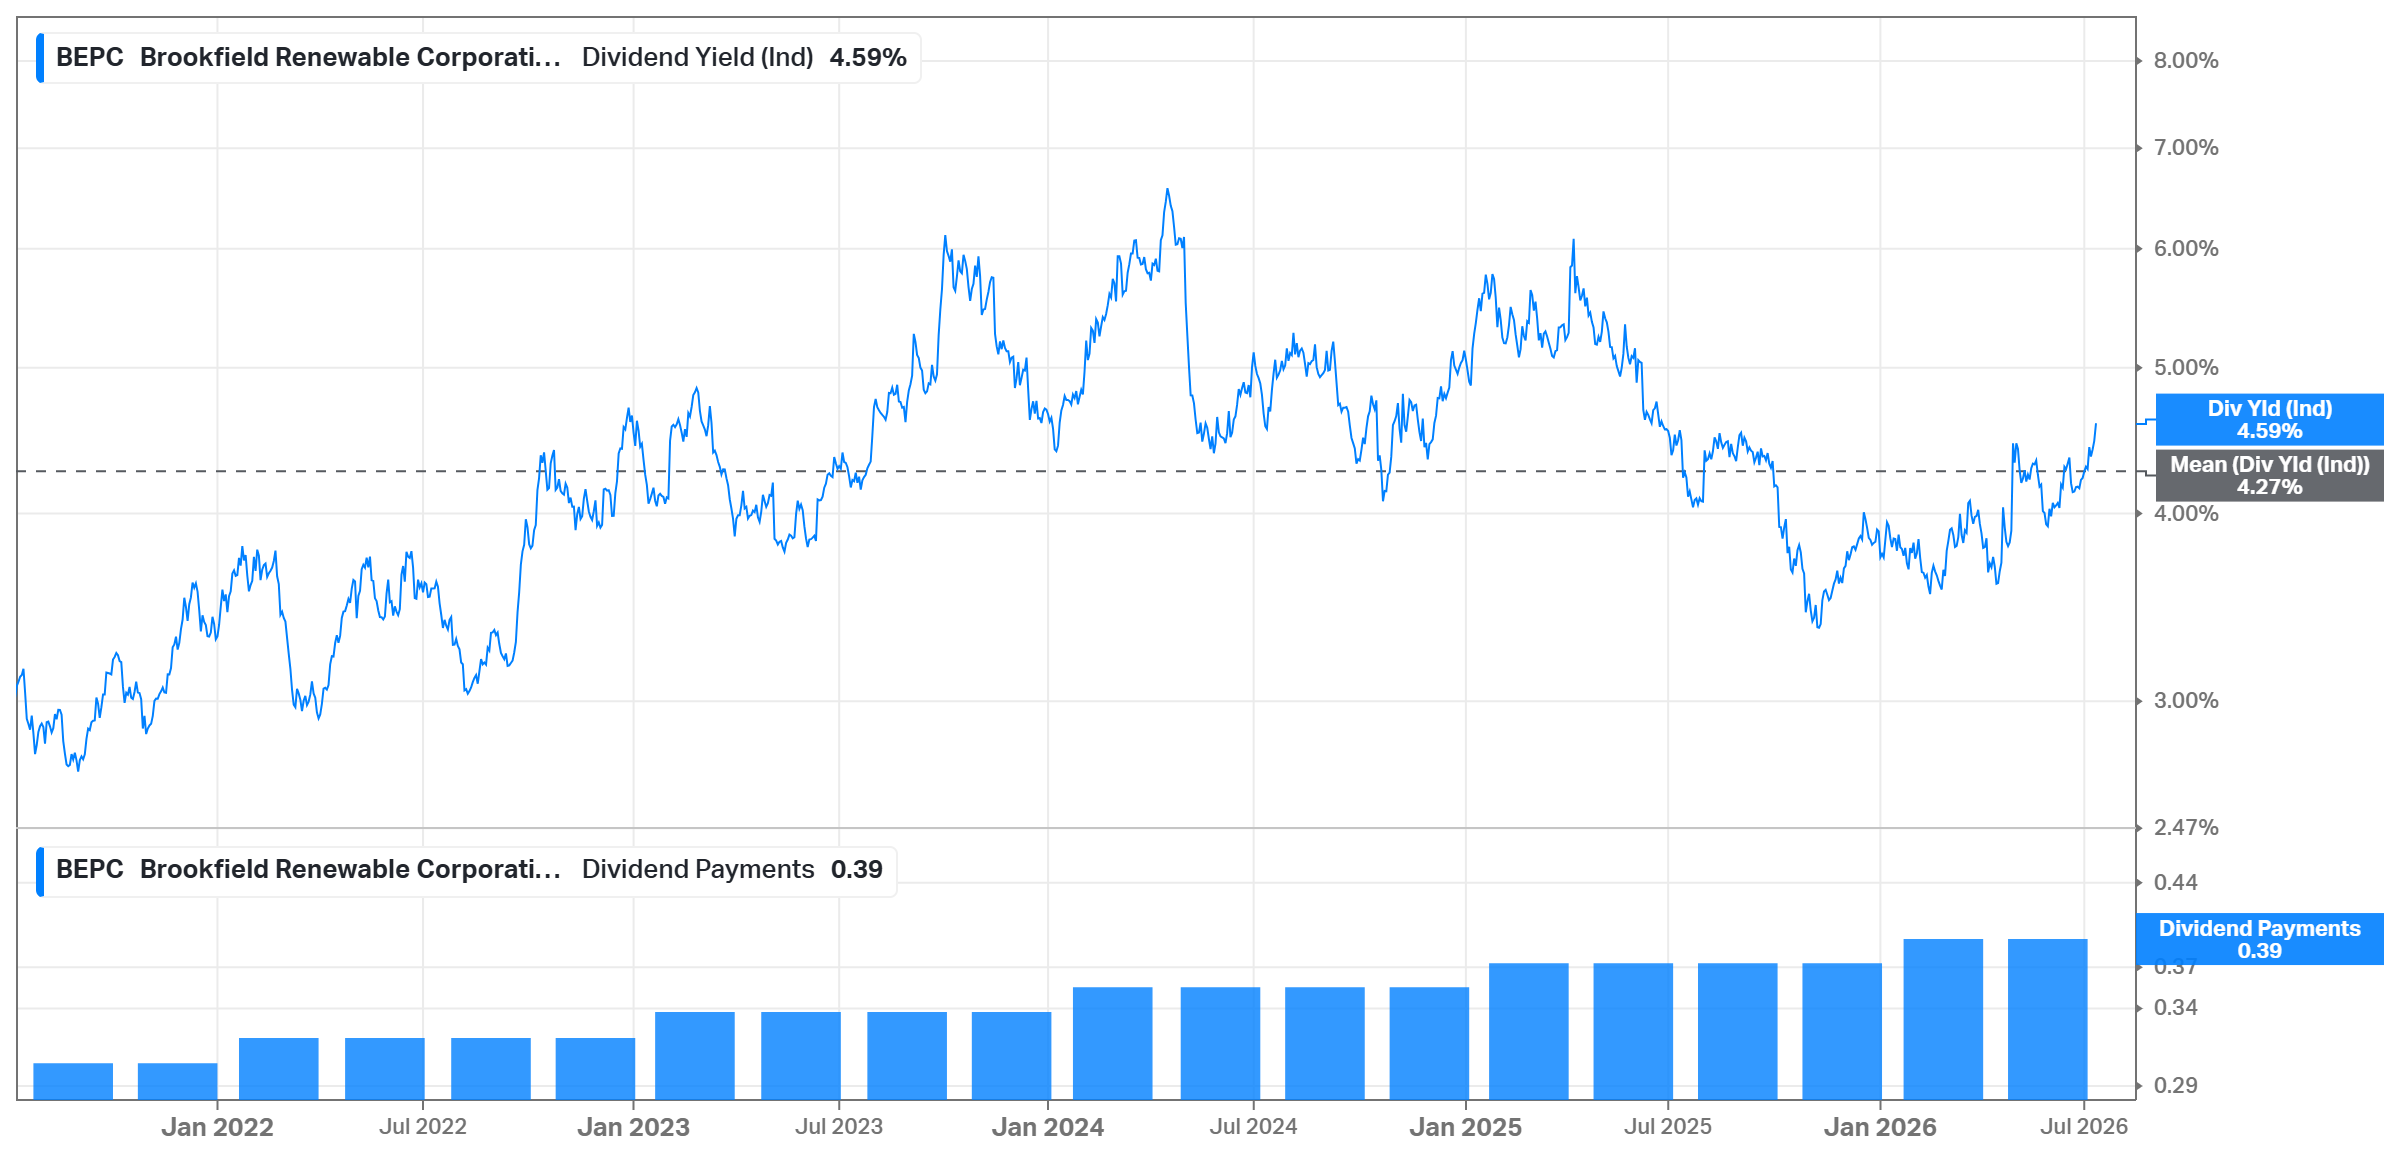
The contracted-cash-flow version of this thesis: hydro, wind, solar, and a development pipeline funded at investment grade. It trades on interest rates as much as on power. A yield instrument, not a growth one - which is why it’s here and not above.
Funds
For readers who’d rather buy the theme than the names.
ICLN
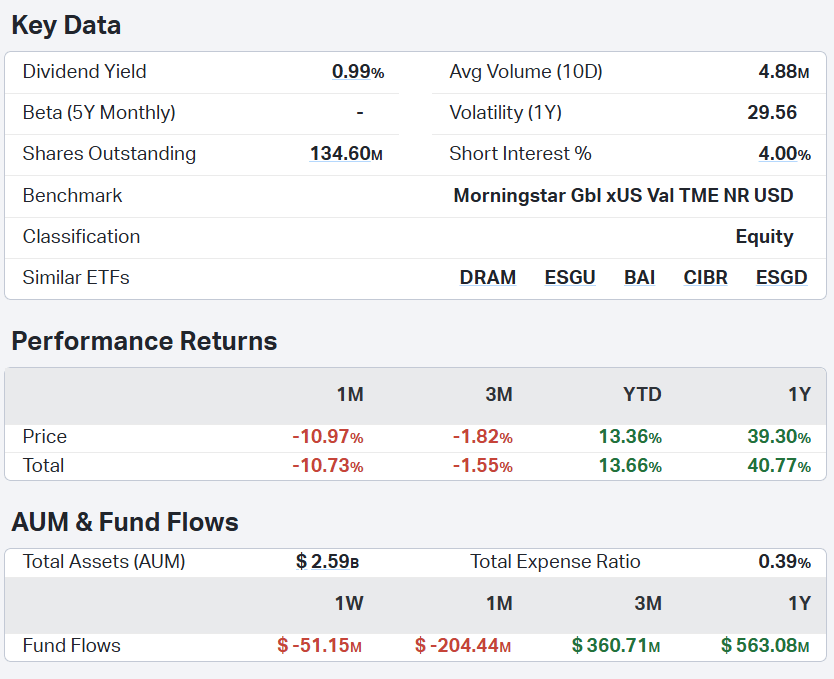
Tracks the S&P Global Clean Energy Transition Index across more than 20 countries, with the lowest fee of the major thematic funds at 0.39%. The warning: the ten largest holdings make up over 55% of the fund, so it’s less diversified than it looks.
TAN
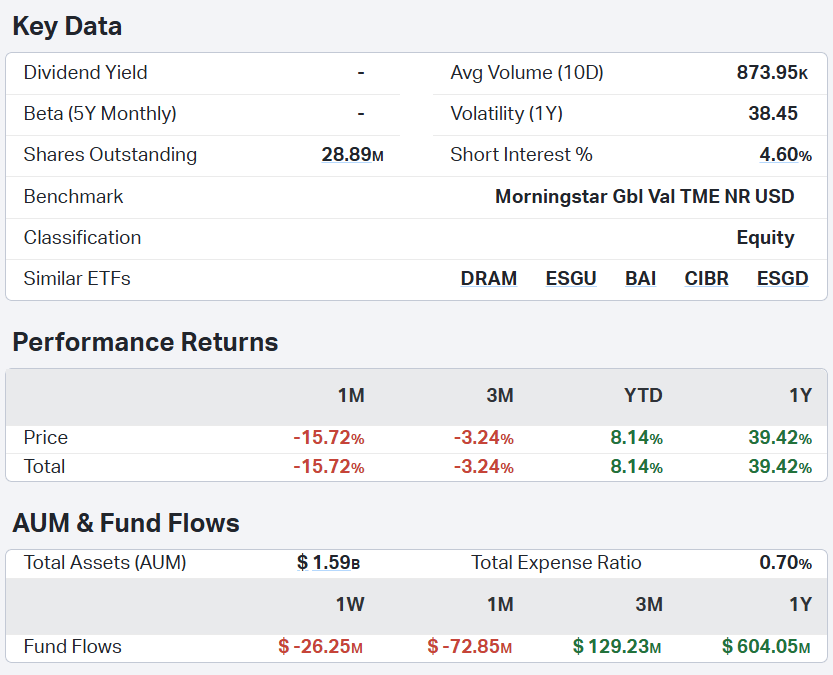
Pure solar, heavy First Solar and Enphase weighting. Remember the drawdown math: even after this year’s run, the five-year return is still negative at about -16%. Consider buying it as a trade on the solar cycle.
QCLN
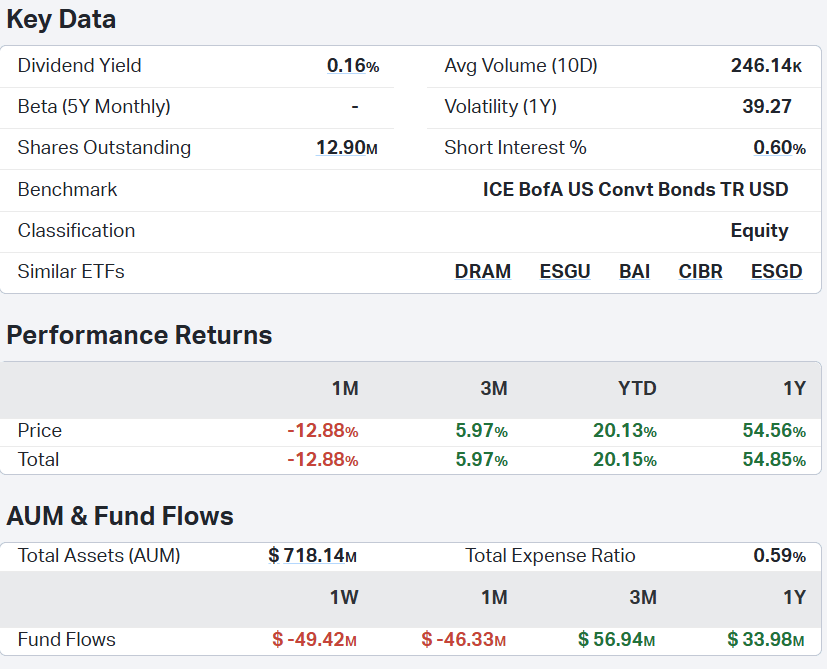
US clean tech plus EVs and power semiconductors. Up about 20% year-to-date and roughly 55% over twelve months - and it will fall just as fast when sentiment turns. Single-country, EV-heavy, highest beta of the group.
GRID
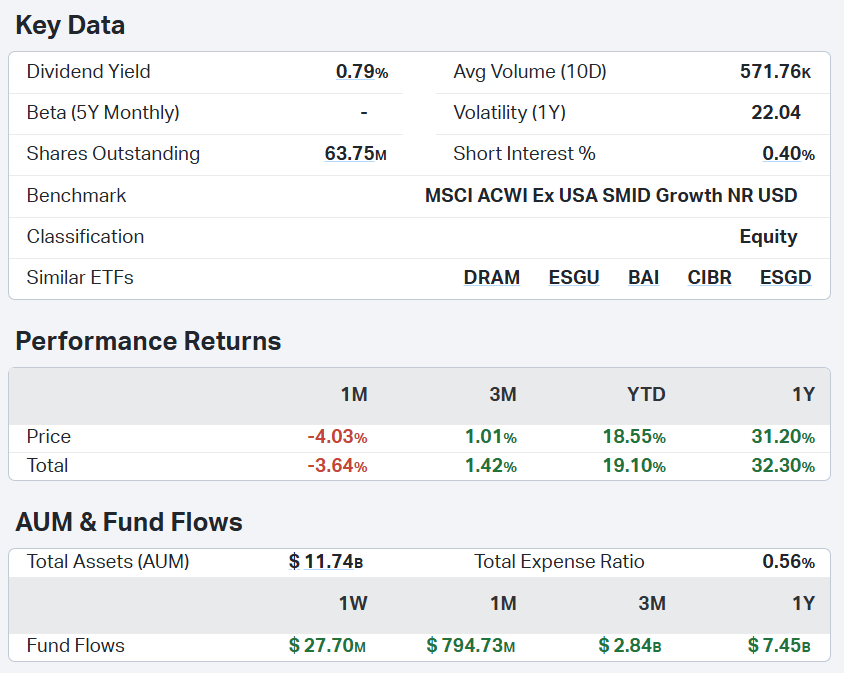
First Trust’s smart grid infrastructure fund holds about 120 names across more than $11B in assets, with a third of the fund in electrical components. If you believe in the transmission buildout but don’t want to pick between Hubbell, Eaton, and Quanta, this is the answer.
This is not a financial or investing recommendation. It is solely for educational purposes.