
The Trade Desk: Be Greedy When Others Are Fearful
A comprehensive analysis of The Trade Desk (TTD).

Content:
• Company Overview
• Open Internet
• Market Overview
• Economic Moat
• Business Strategy
• Capital Allocation
• Advantages
• Disadvantages
• Competitors
• Past
• Future
• Current Valuation
• Fair Price
• Checklist
• Due Diligence
• Investment Thesis
Company Overview
IPO Date: Sep 21, 2016
Market Cap: ~$18.43B
Sector: Communication Services
Industry: Media
Type: Mid Growth
Total Number of Employees: ~3,500
Next earnings report: Feb 18, 2026 (estimated, after-market)
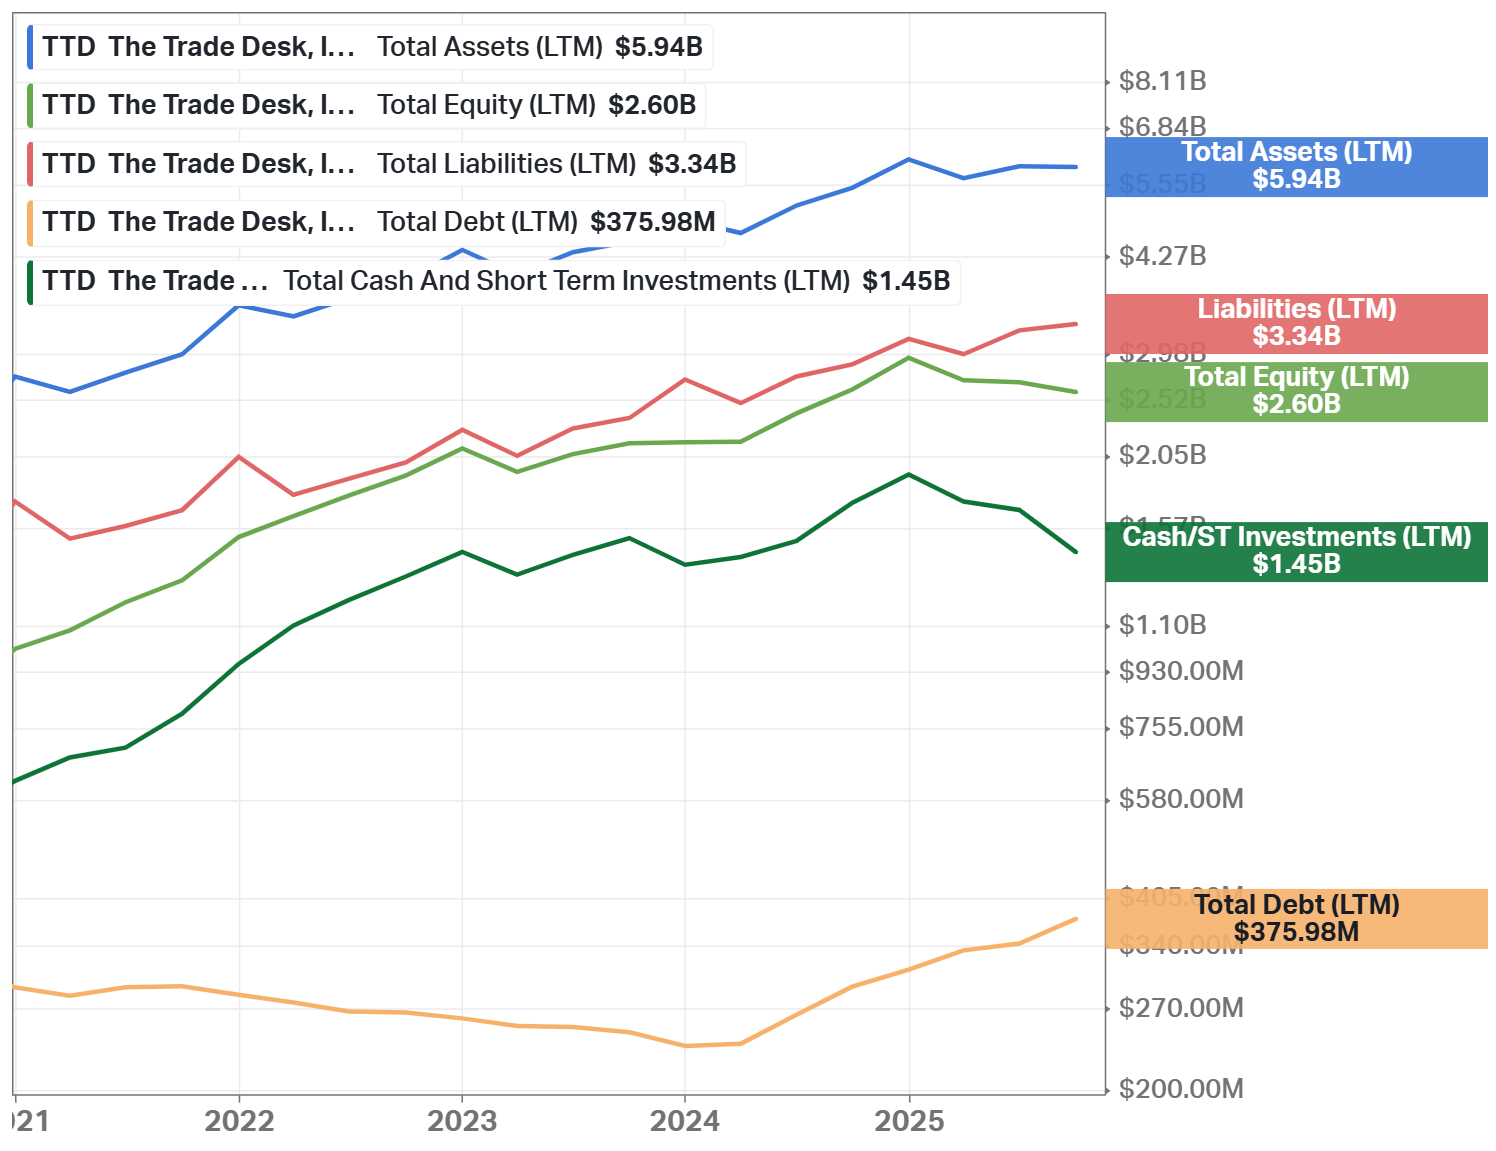
Total Debt: $376M
Cash & Investments: $1.45B
Beta: 1.07
Website: www.thetradedesk.com
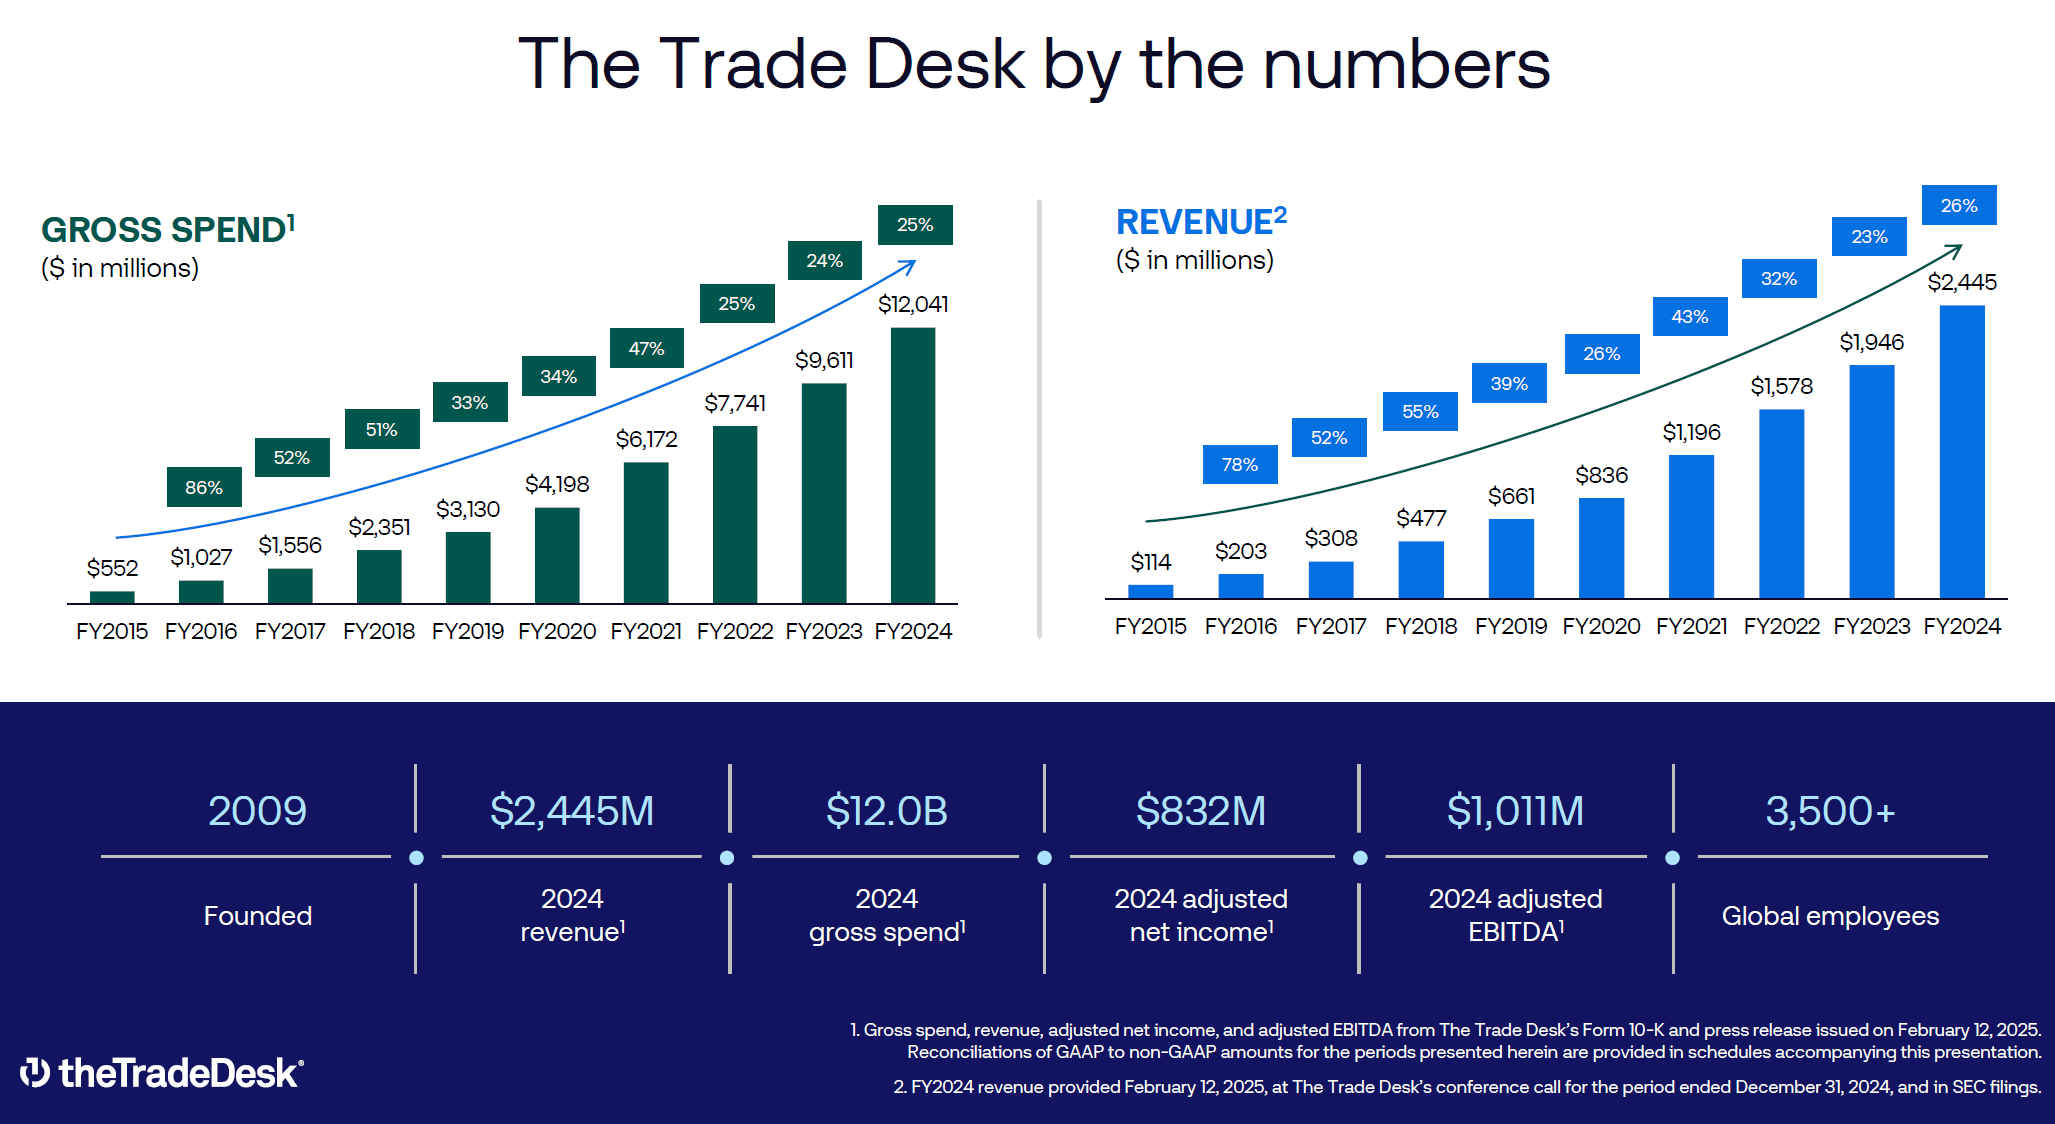
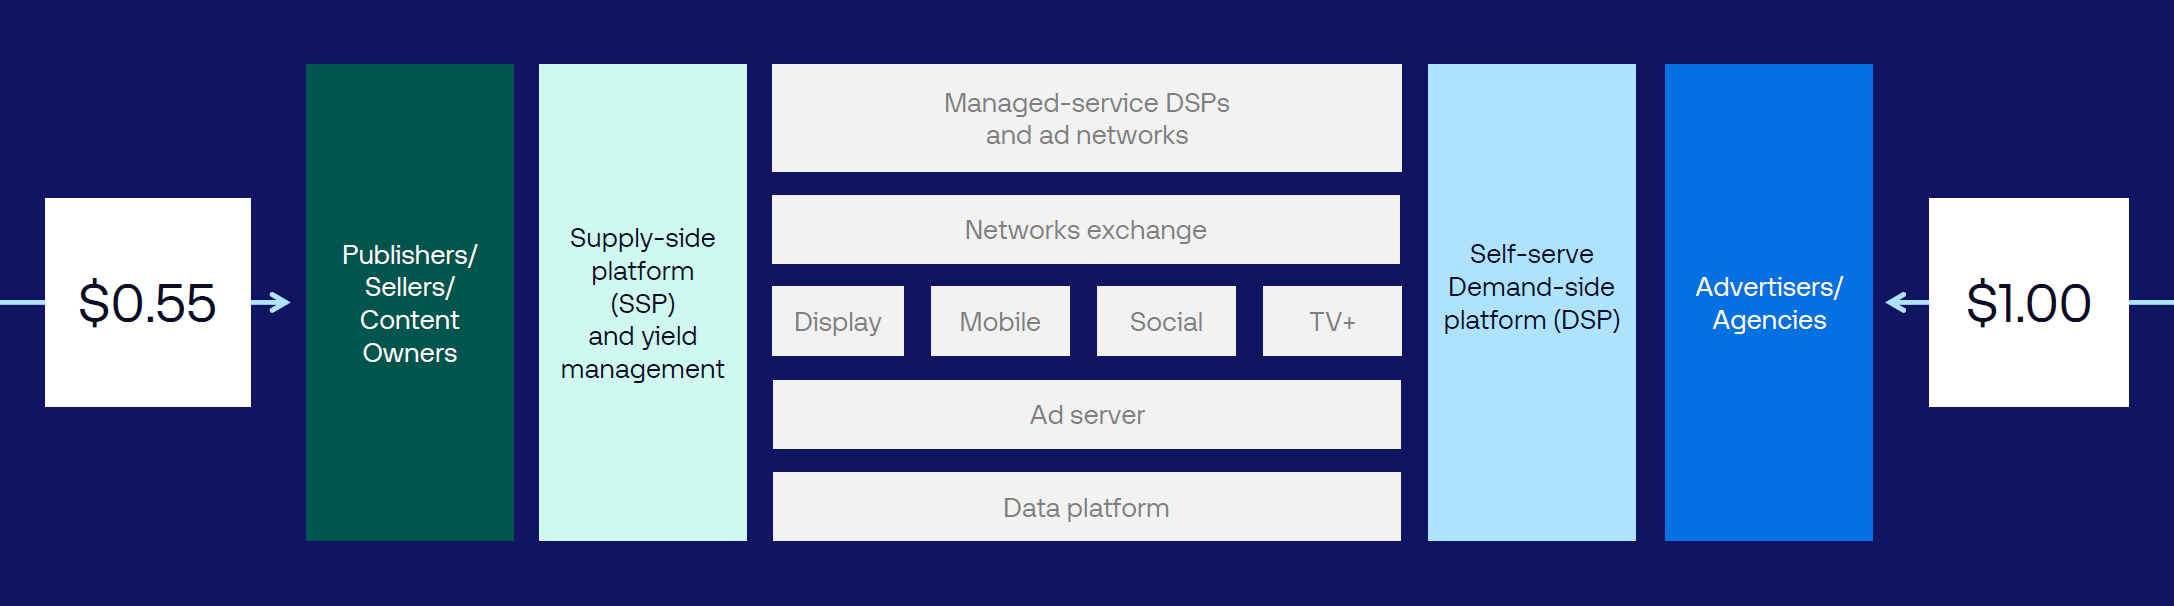
The Trade Desk (TTD) is a global demand-side platform that allows advertisers and agencies to buy digital advertising across the open internet (see the next section). The platform covers display, video, audio, mobile, and connected TV, and it does not own or sell advertising inventory. This structure allows the company to focus only on advertiser performance and transparency. Revenue is generated through a take rate on advertising spend, which has averaged close to 20% over the past five years.
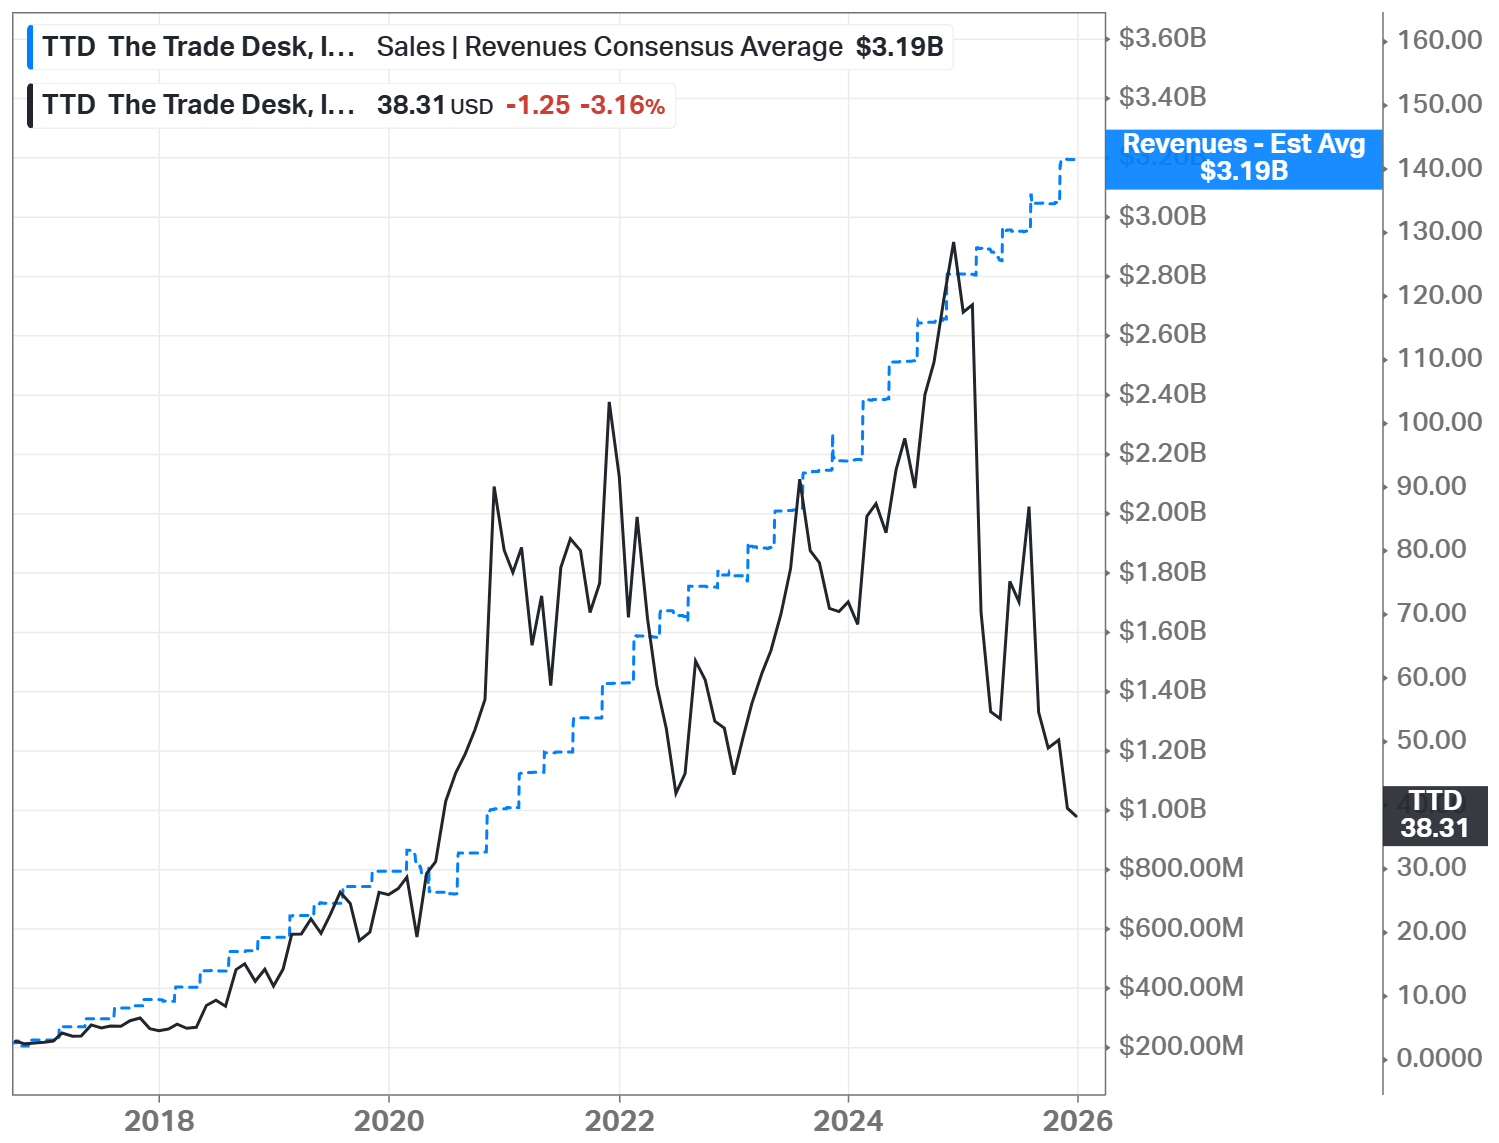
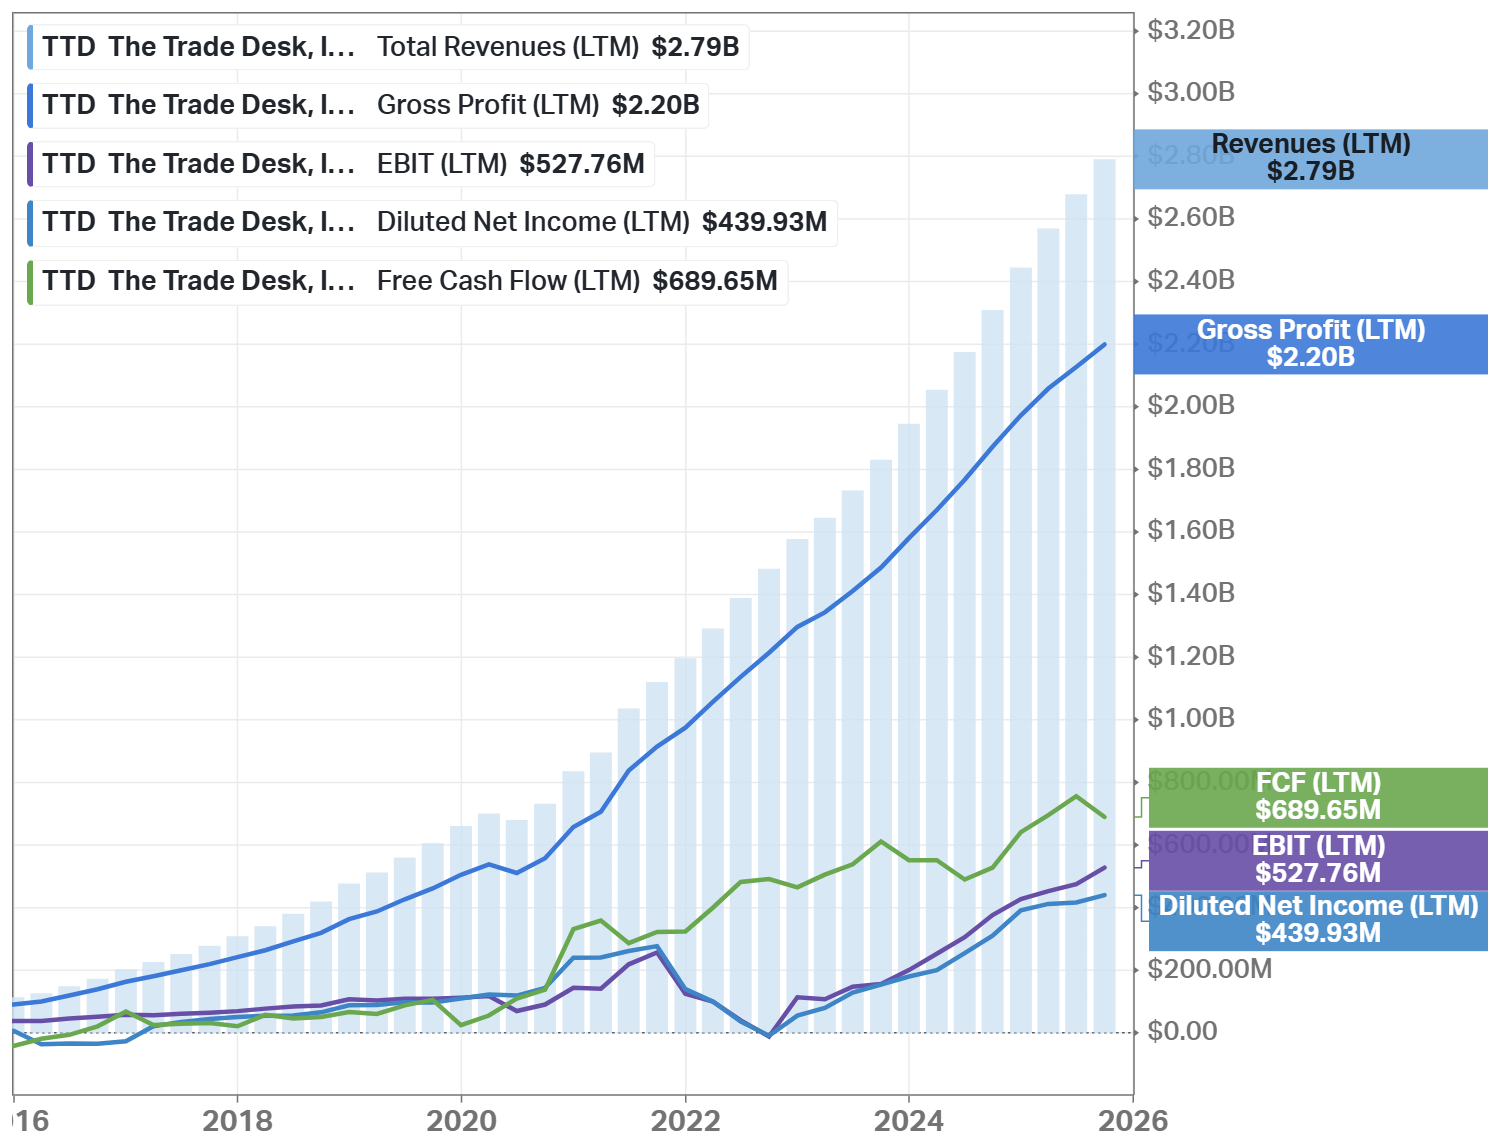
In FY 2024, the company generated revenue of approximately $2.45 billion, supported by gross advertising spend of around $12 billion flowing through the platform. Adjusted EBITDA exceeded $1.0 billion, reflecting strong operating leverage as the business scaled. The most recent numbers (third quarter 2025) are below.
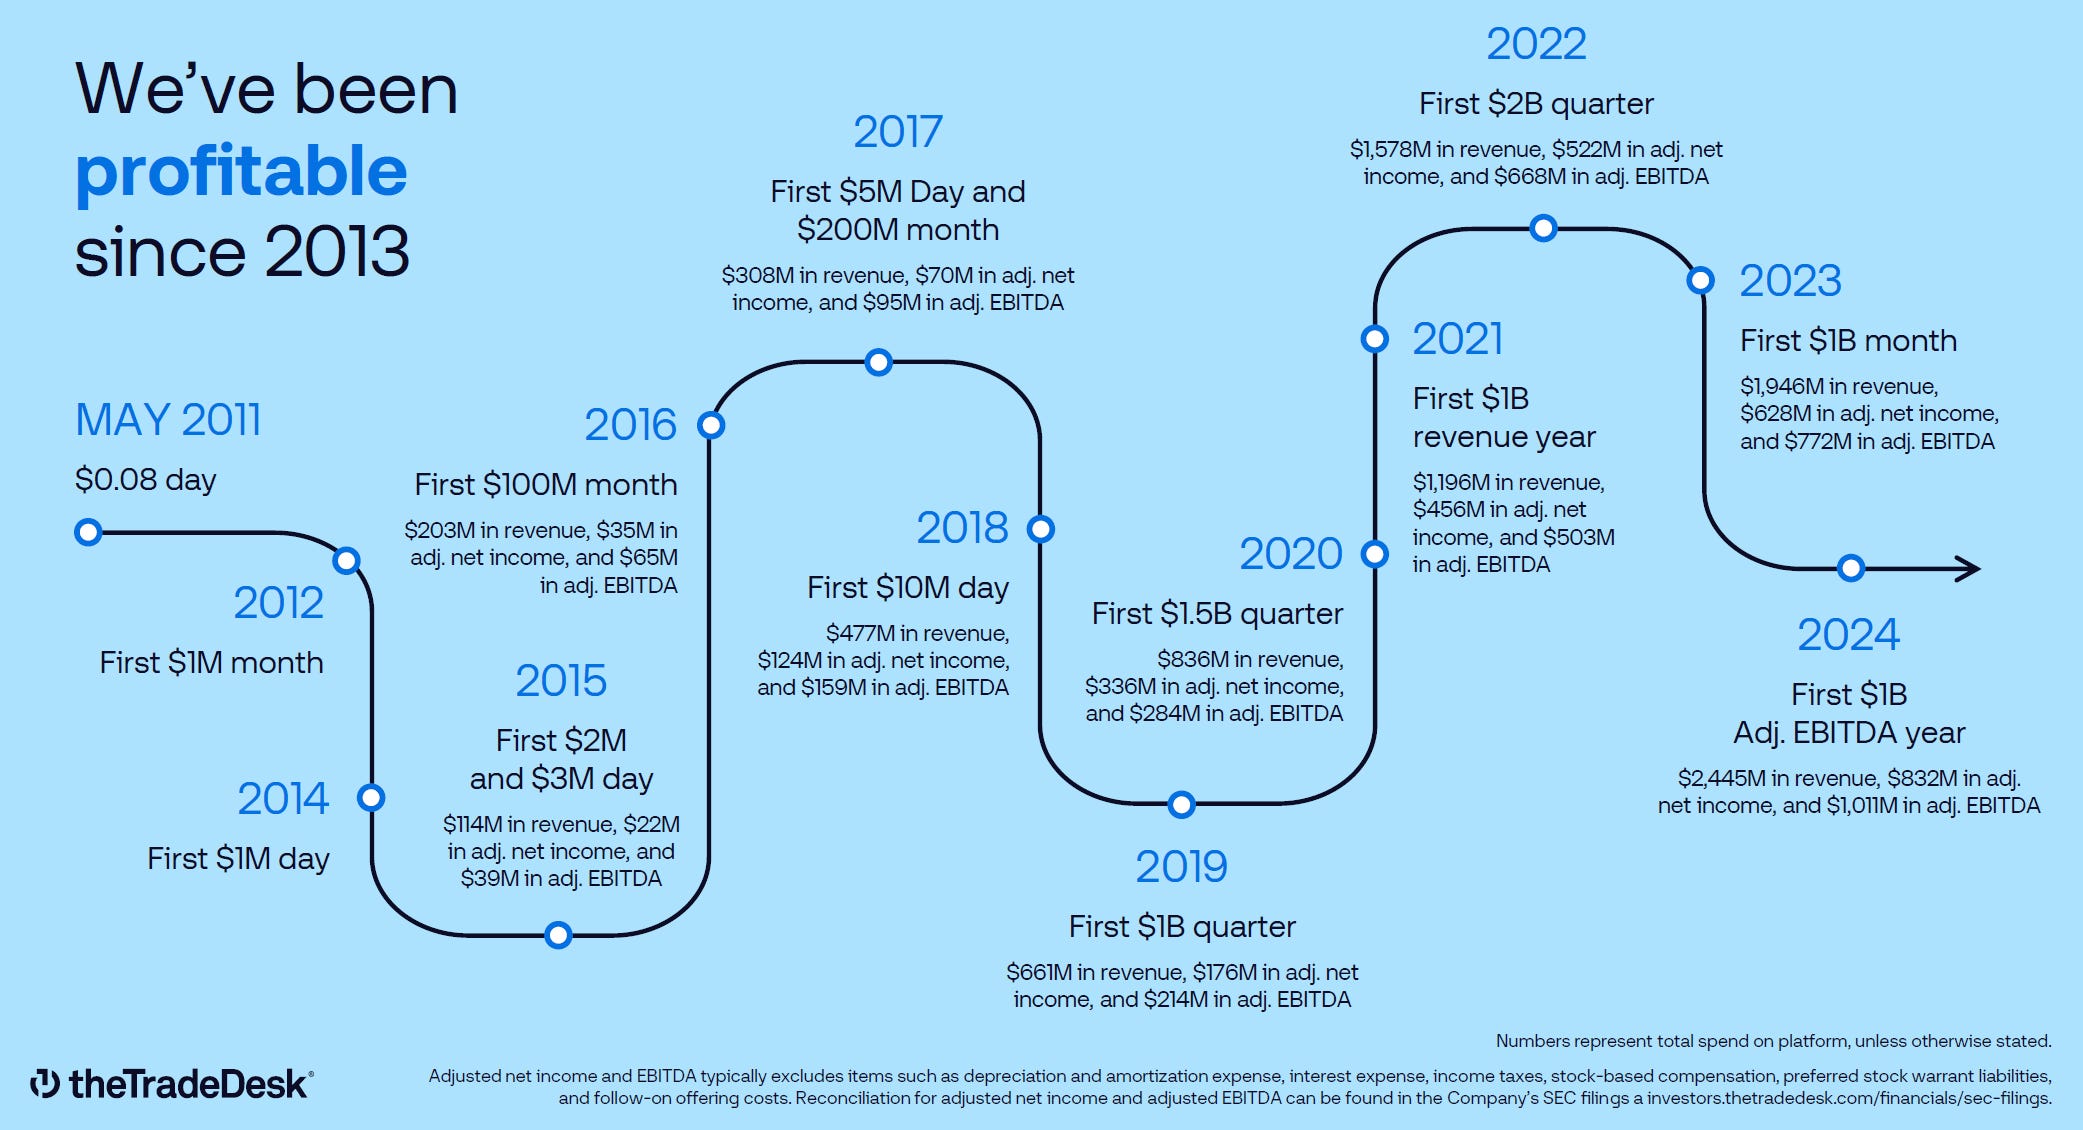
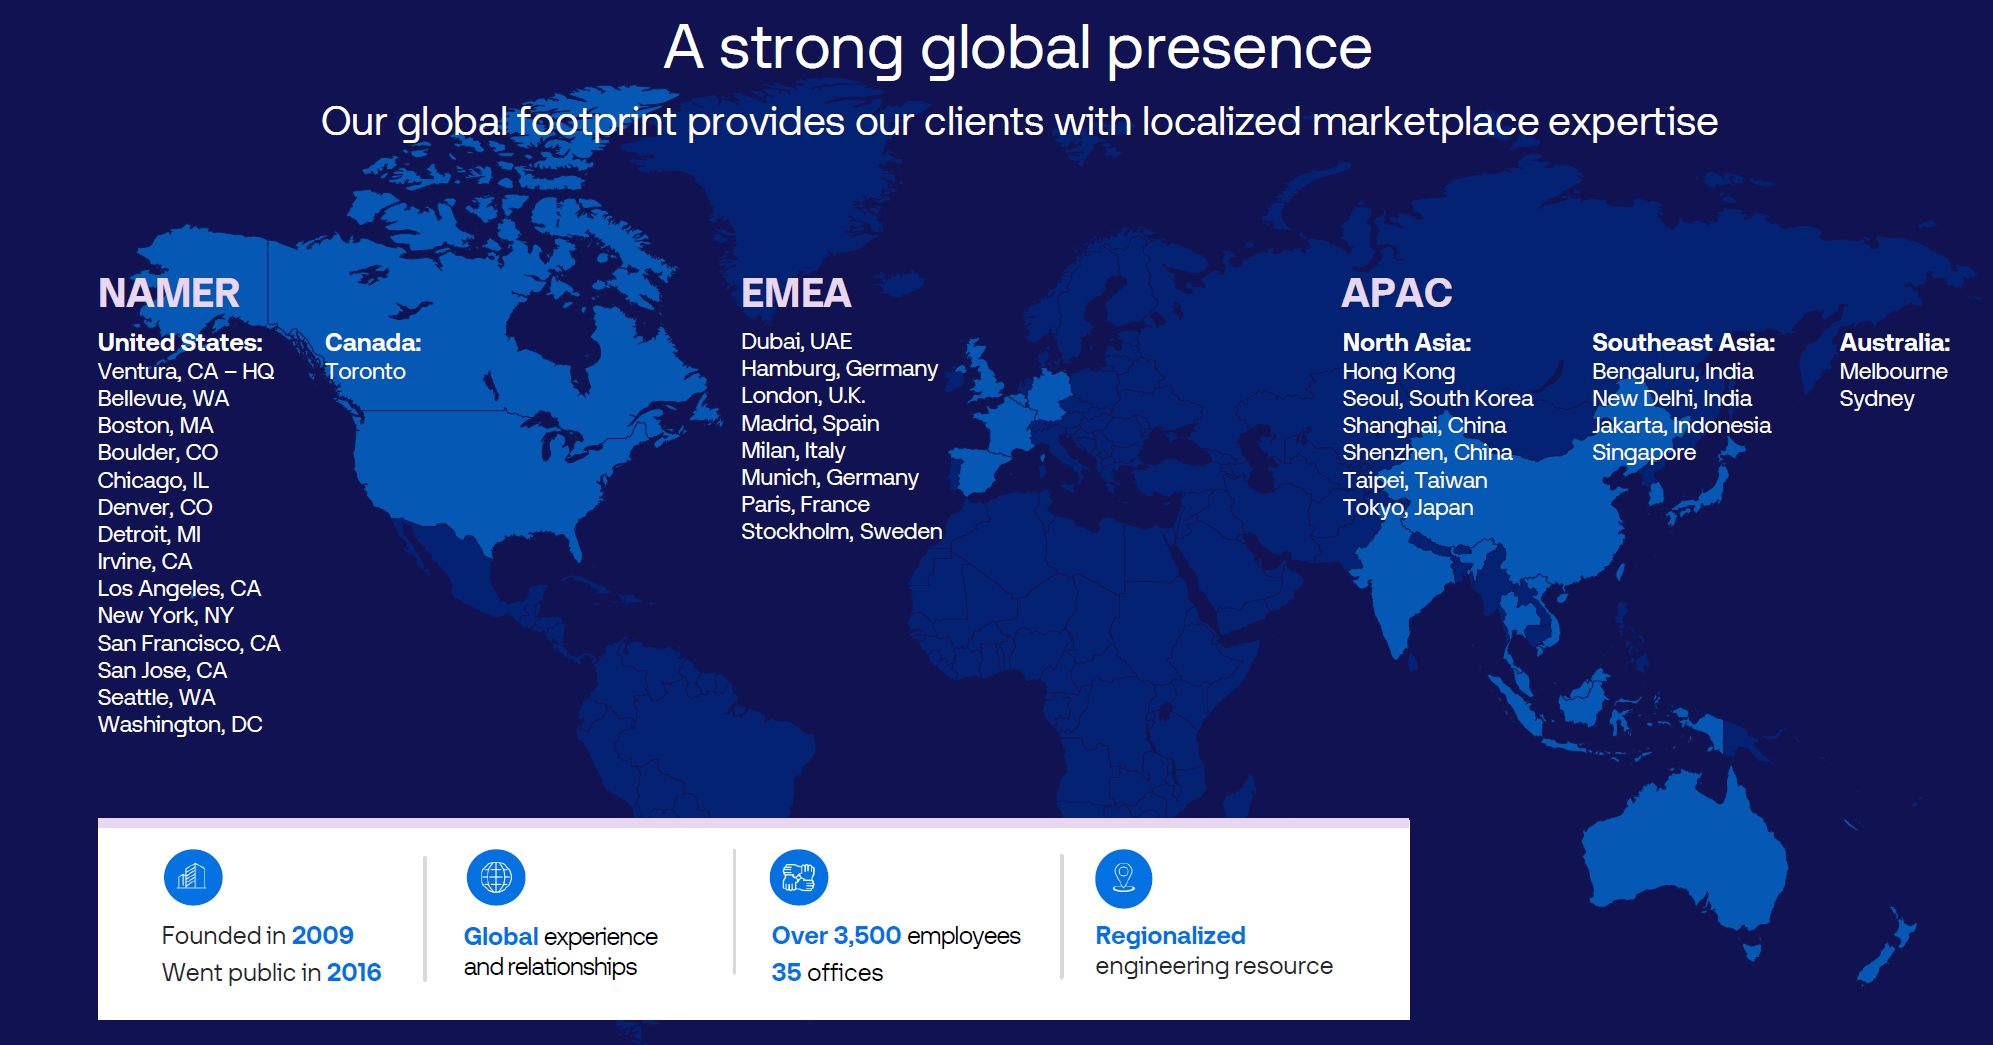
The Trade Desk has been profitable since 2013 and operates with more than 3,500 employees across over 35 offices worldwide. Connected TV has become the largest channel on the platform, driven by advertisers shifting budgets away from linear television.
The client base consists mainly of large global brands and major advertising agencies that manage campaigns across multiple channels and regions.
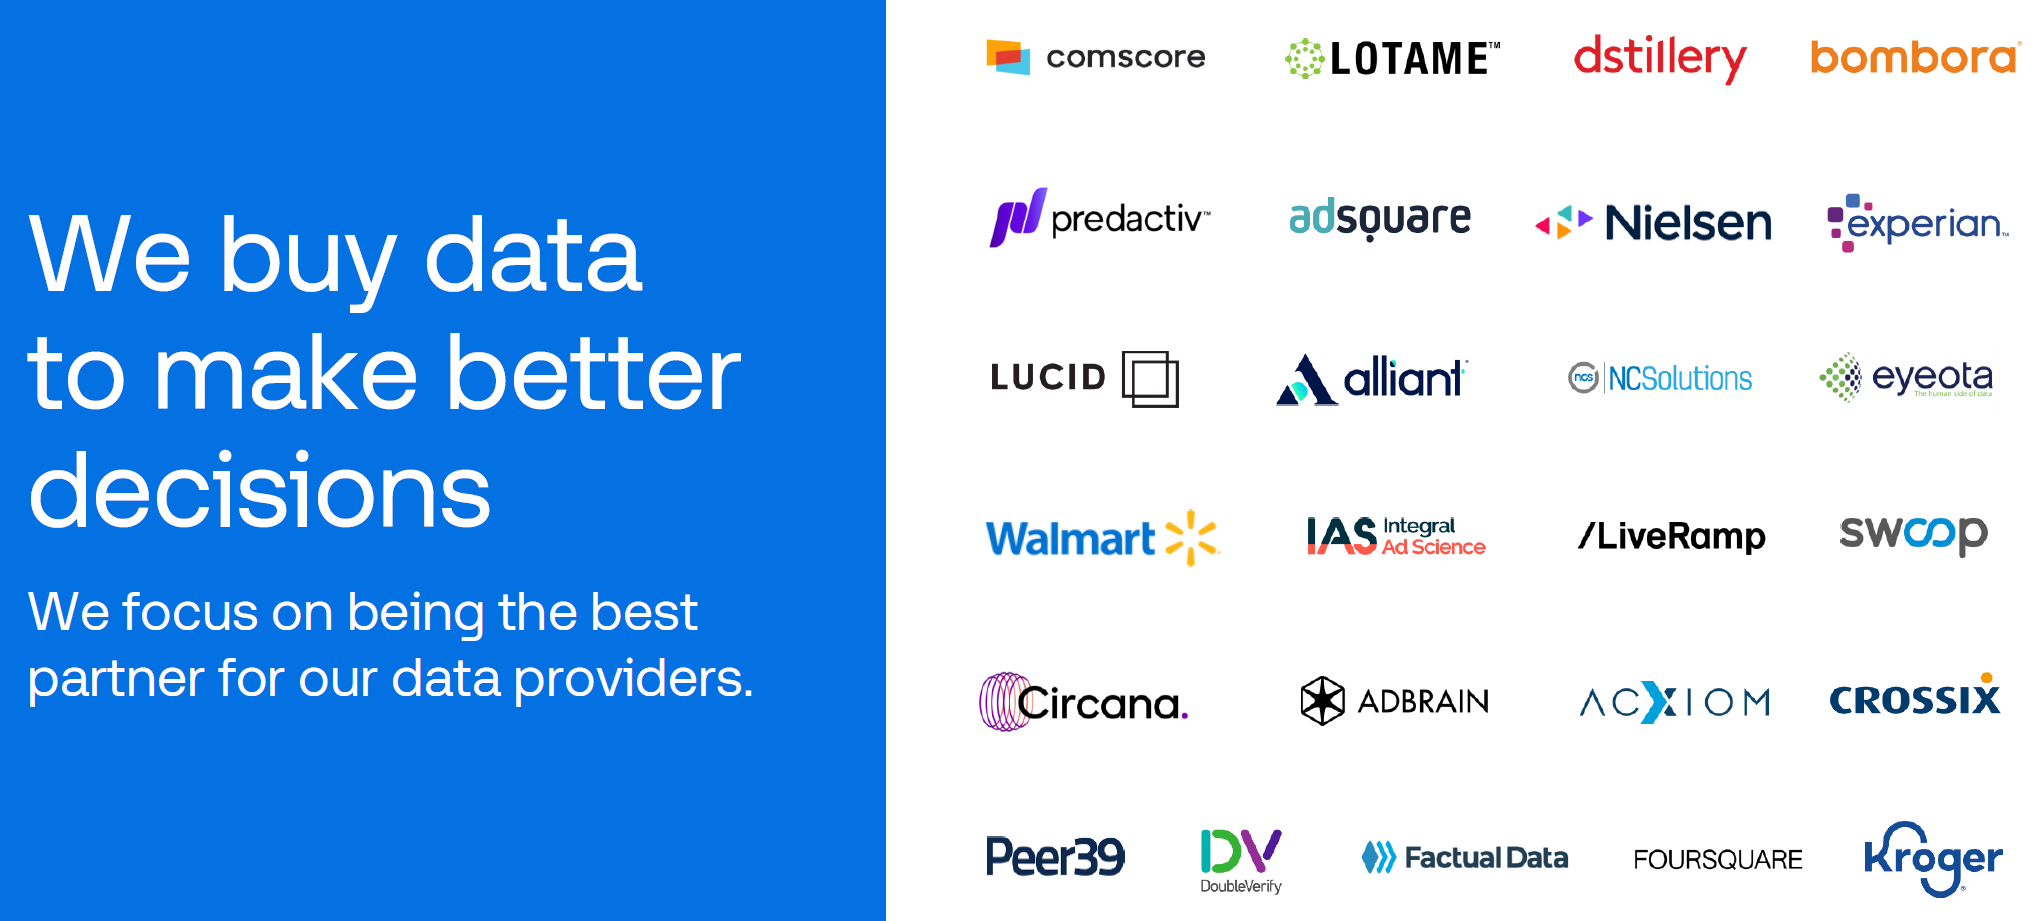
TTD also works with a broad network of third-party partners, including publishers, data providers, and measurement companies. These partnerships expand inventory access and data quality while keeping the platform open and interoperable.
The revenue is well diversified across many advertisers and agencies, with no single client representing a material share of total revenue or spend. This reduces dependency risk and makes revenue more stable across economic cycles.
The company was founded by Jeff Green, who continues to act as its CEO. Green plays an active role in strategy and product direction and consistently promotes the importance of the open internet (see the next section). His long-term focus has formed a company culture centered on trust, independence, and sustainable growth rather than short-term optimization.
Open Internet
It refers to digital advertising inventory that exists outside large closed ecosystems controlled by a single platform. This includes independent websites, mobile apps, and many connected TV streaming services where no single company owns both the media inventory and the advertising technology stack.
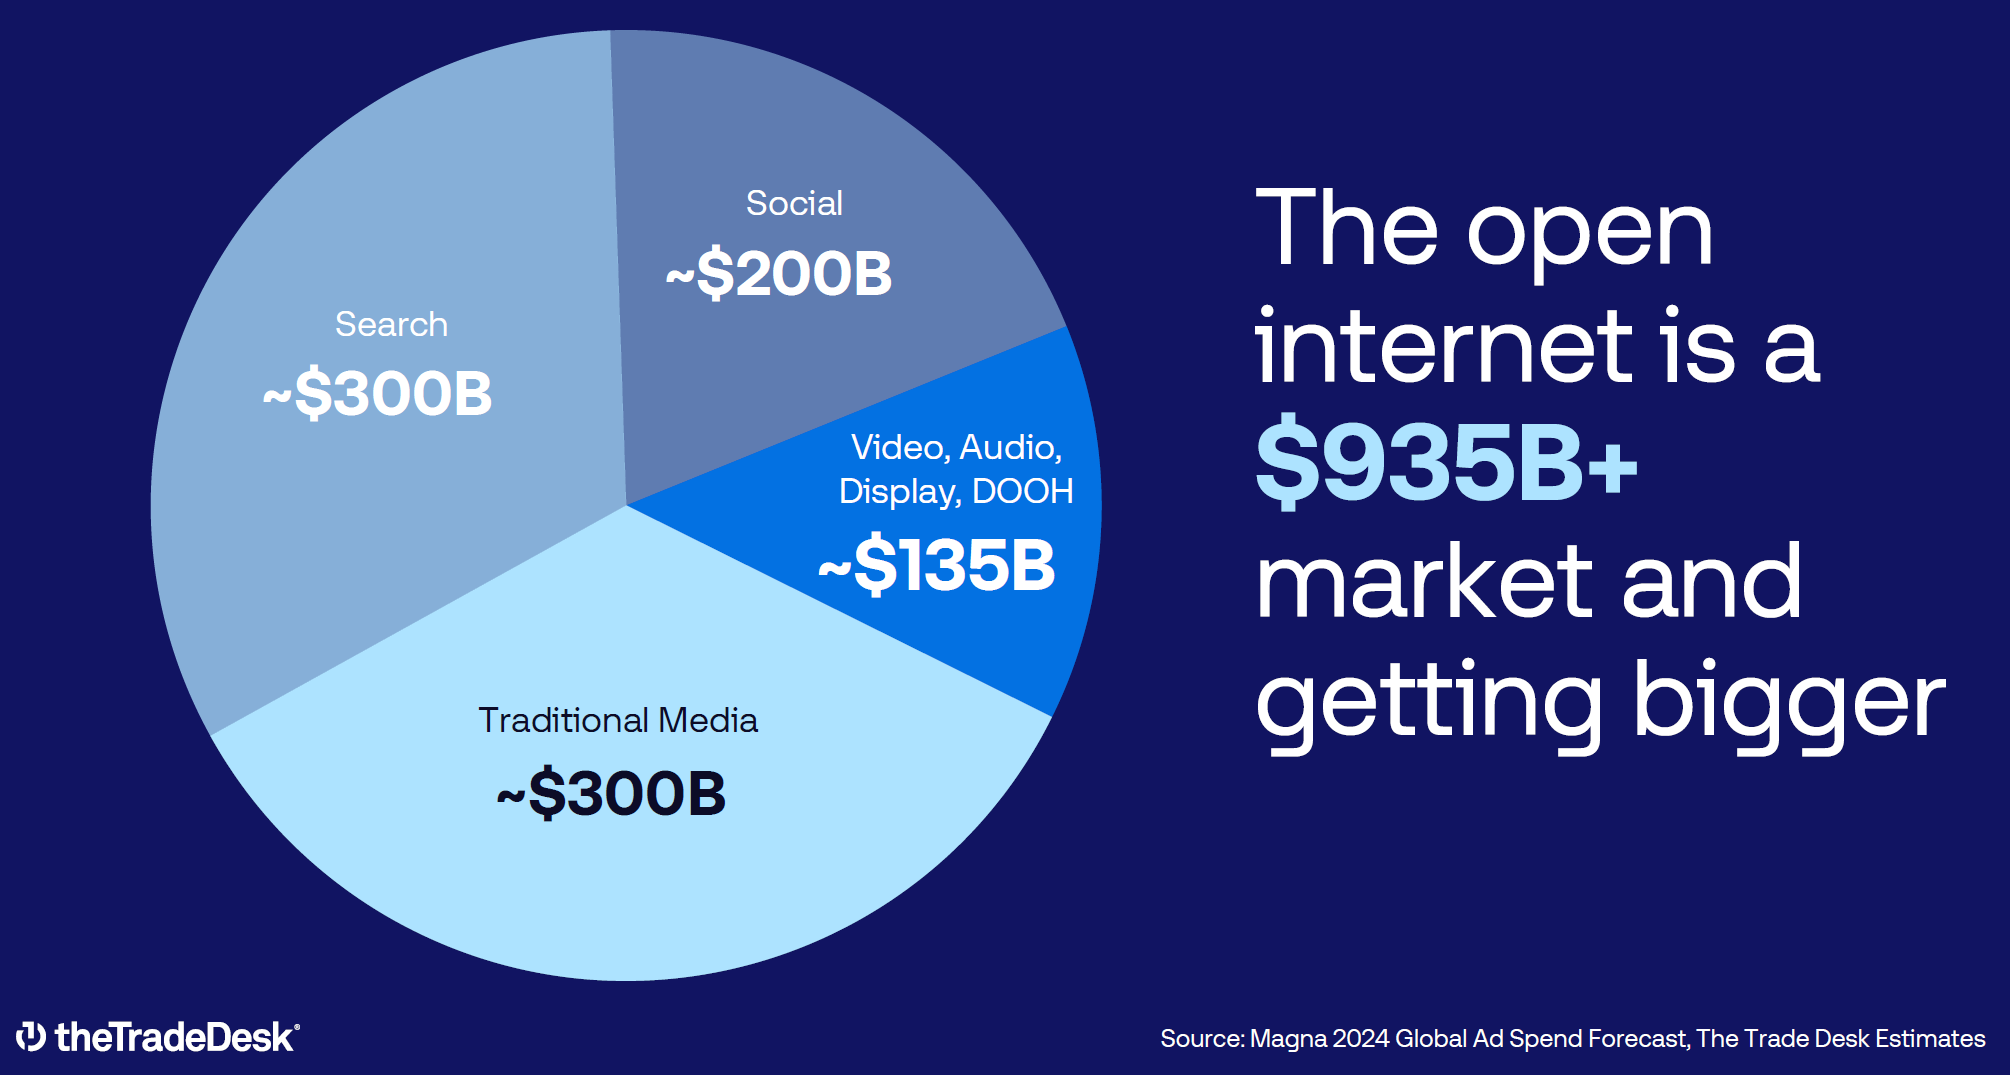
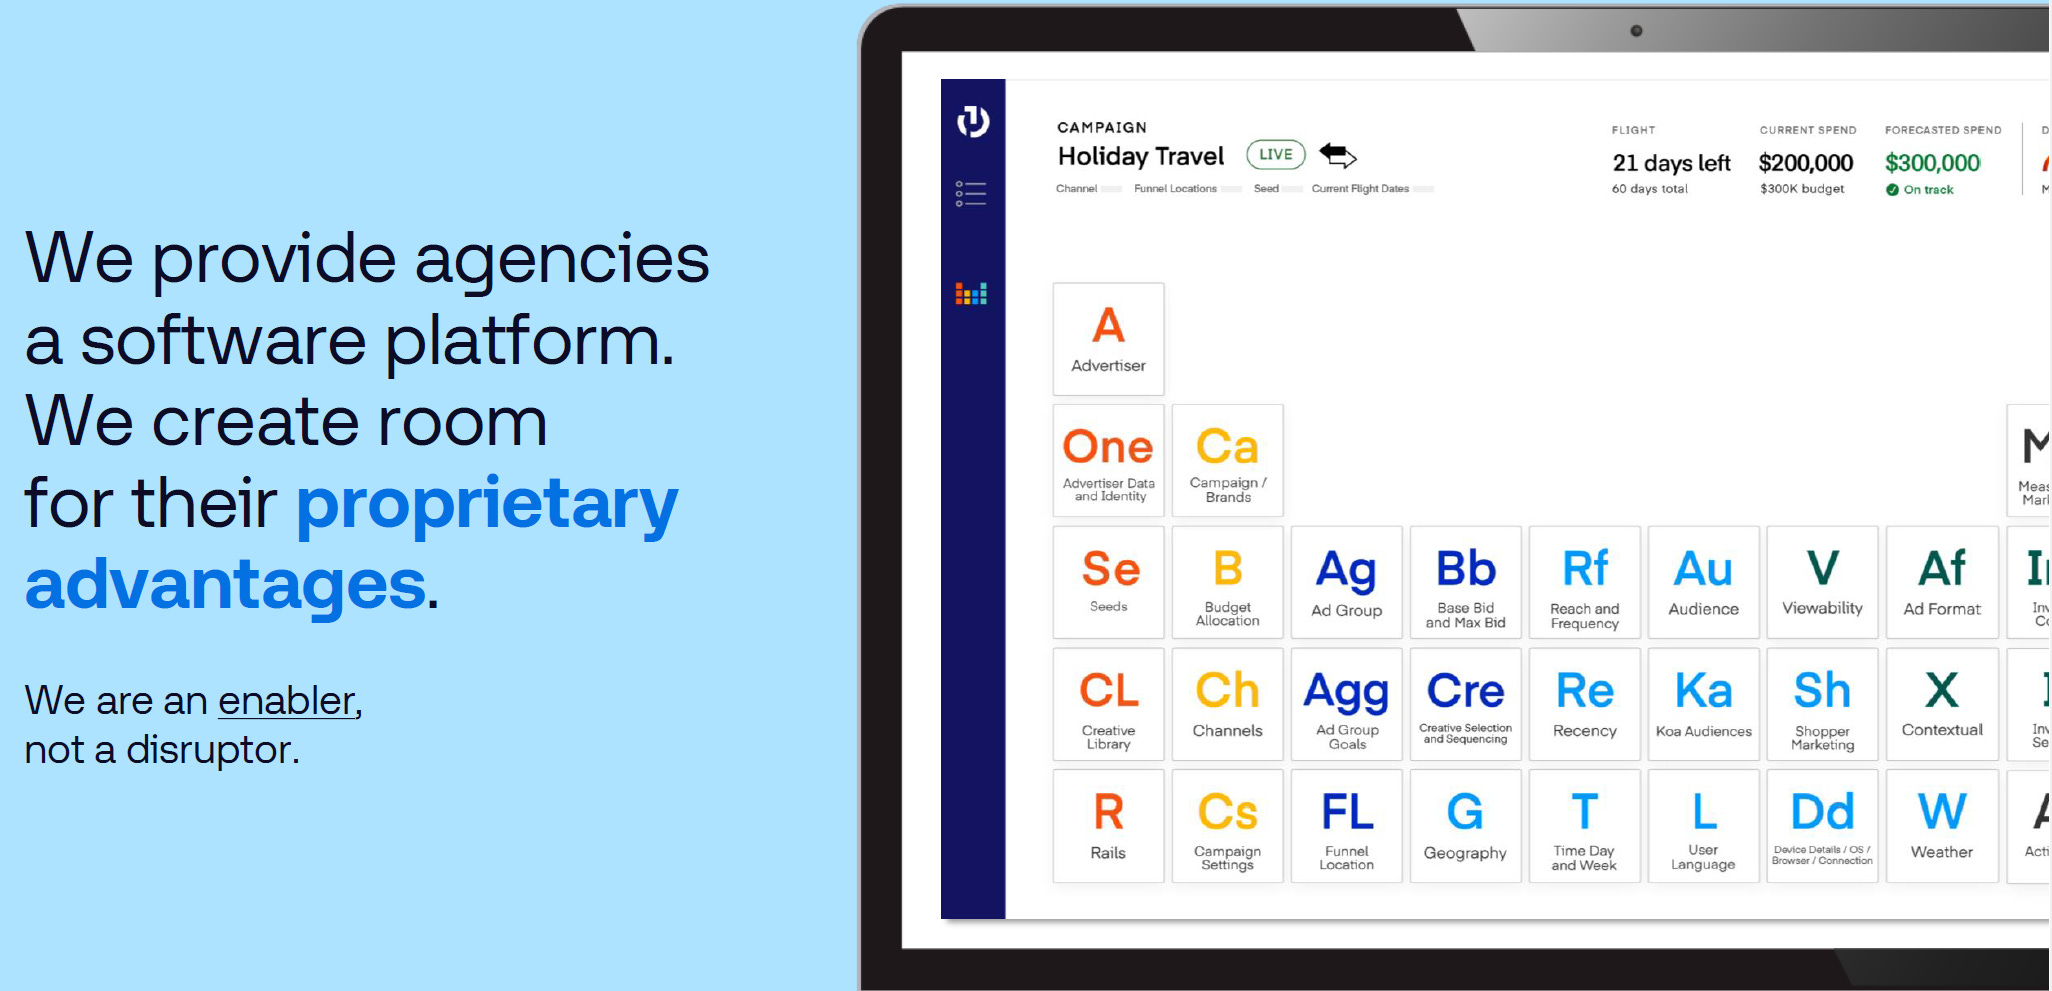
In this environment, advertisers rely on independent demand-side platforms to access inventory, manage data, and measure performance across channels. The Trade Desk positions itself as a core infrastructure provider for this open internet, allowing advertisers to buy media transparently without being locked into a single ecosystem’s data or pricing rules.
Market Overview
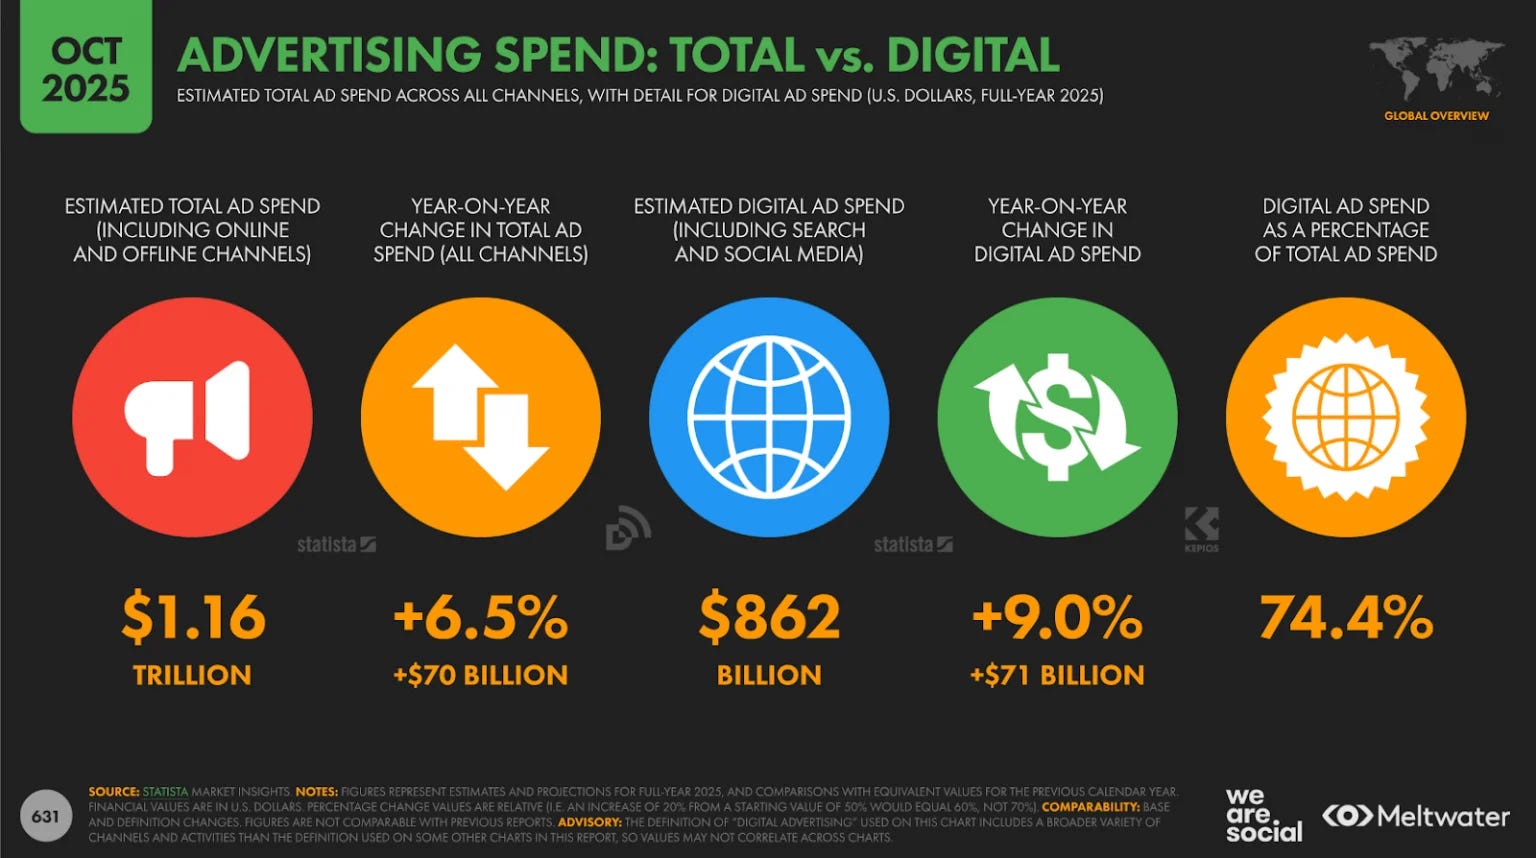
According to industry forecasts, global advertising spend is projected to reach approximately $1.16 trillion in 2025, with digital channels accounting for roughly 74% of total ad spend, confirming the shift toward digital formats.
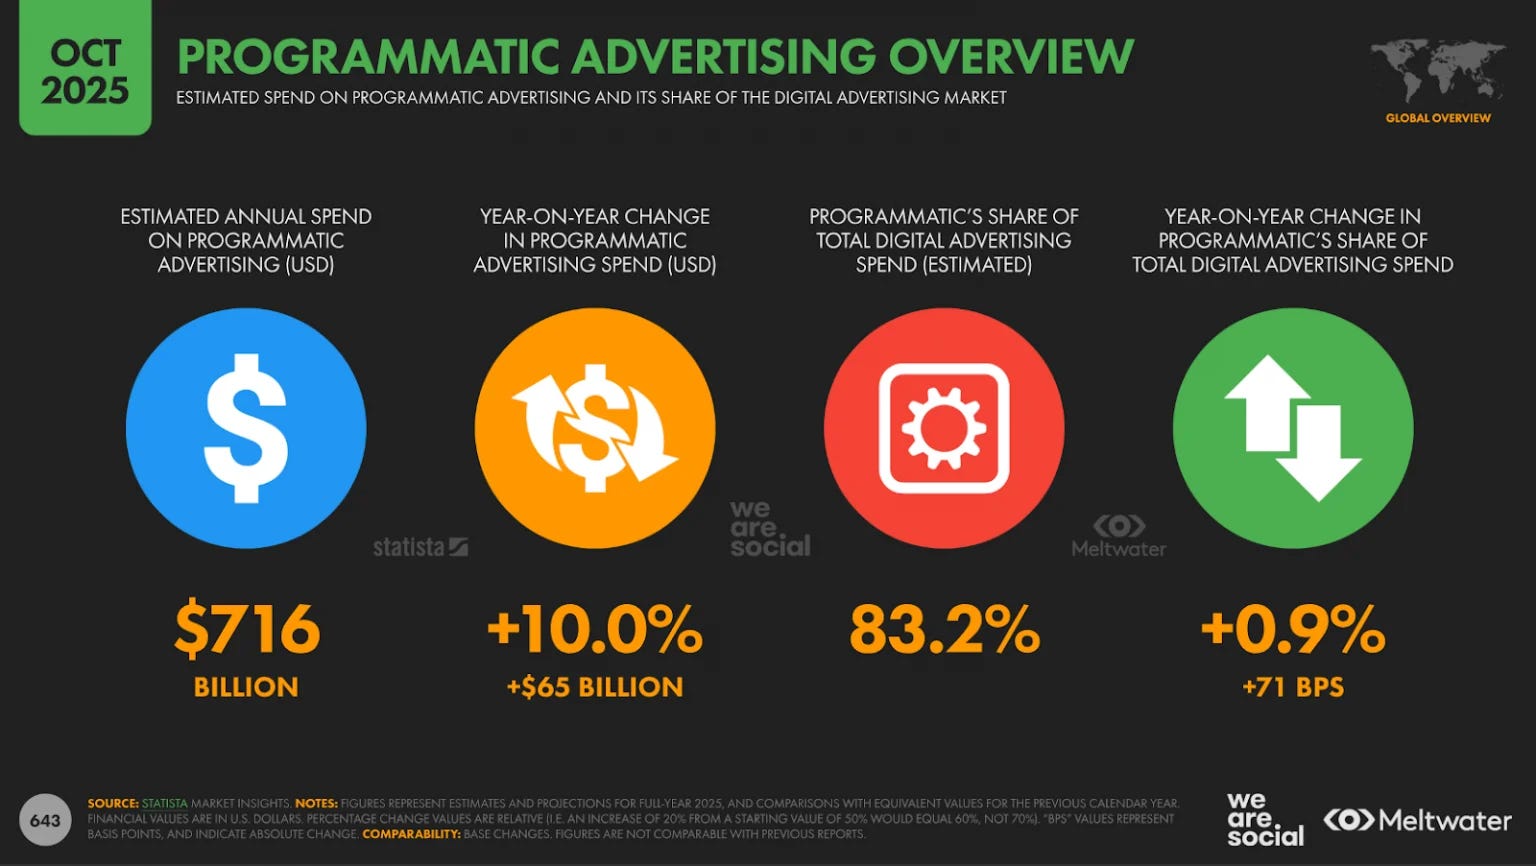
Within digital spend, programmatic advertising is now the dominant buying method, capturing a substantial portion of digital budgets. Estimates indicate that programmatic ad spending will reach around $716 billion in 2025, representing more than 80% of global digital ad spend and continuing to grow as advertisers prioritize automation, audience targeting, and real-time optimization.
Retail media, social ads, and streaming video formats are among the fastest-growing segments within digital advertising.
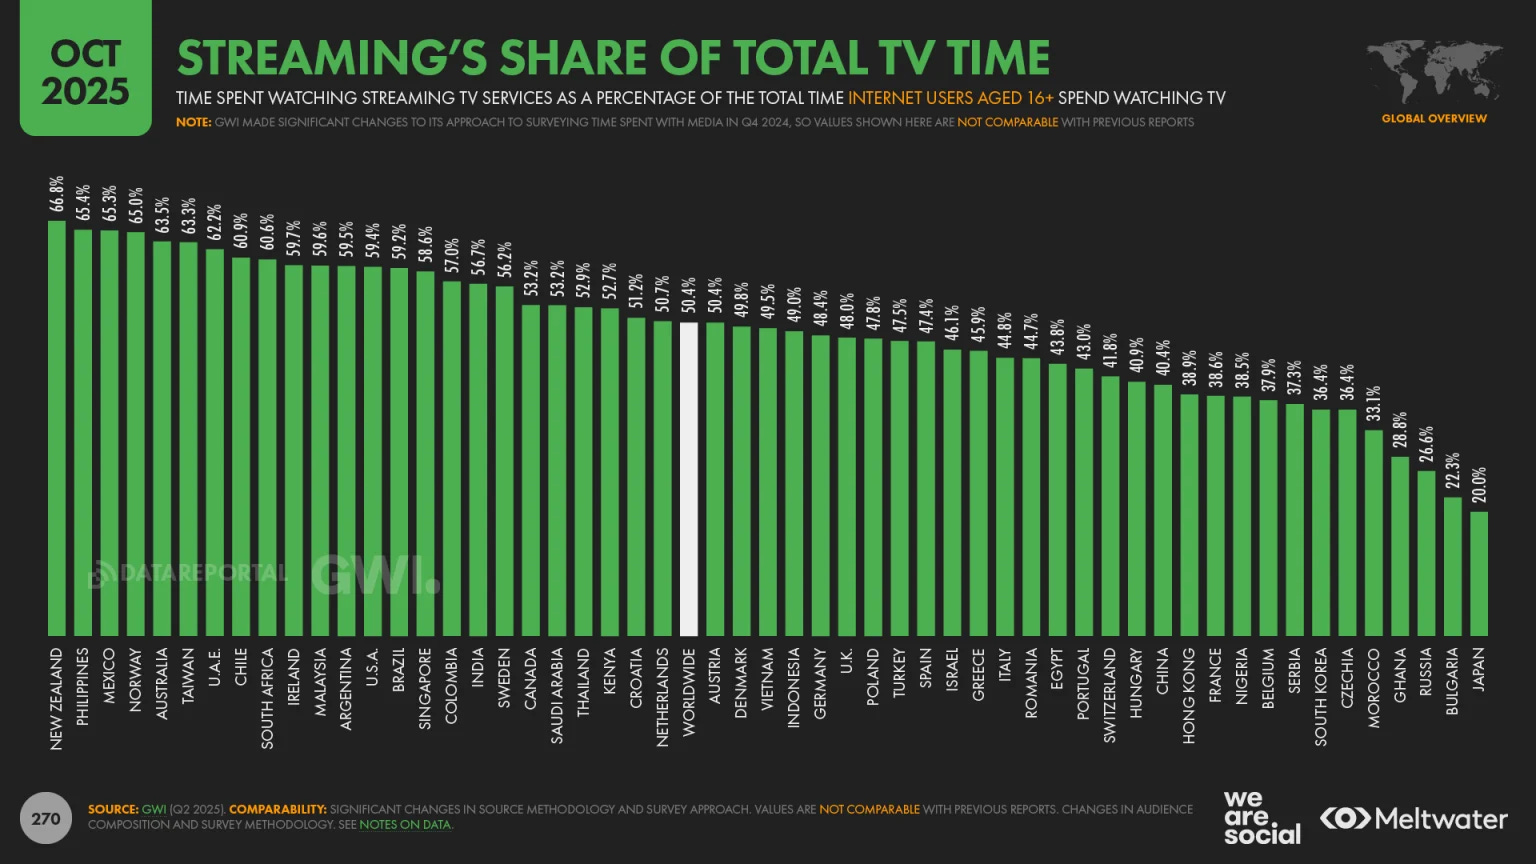
As connected TV consumption rises and first-party data becomes more valuable, advertisers are allocating more budget toward channels and platforms that offer measurable, performance-focused outcomes. 91.7% of online adults consume streaming TV content each month, and 94.6% watched some kind of online video in the past 30 days. More importantly, streaming services now account for 50.4% of internet users’ total TV watch time, surpassing traditional broadcast and cable.
Online adults spend an average of 18 hours and 36 minutes per week using social media, which translates to the world spending roughly 620 million years consuming content on social platforms annually.
According to a recent market report, the programmatic advertising sector is expected to grow at a 14.37% CAGR from 2025 through 2034, driven by rising adoption of automated digital advertising, machine learning, and data-driven marketing strategies across industries.
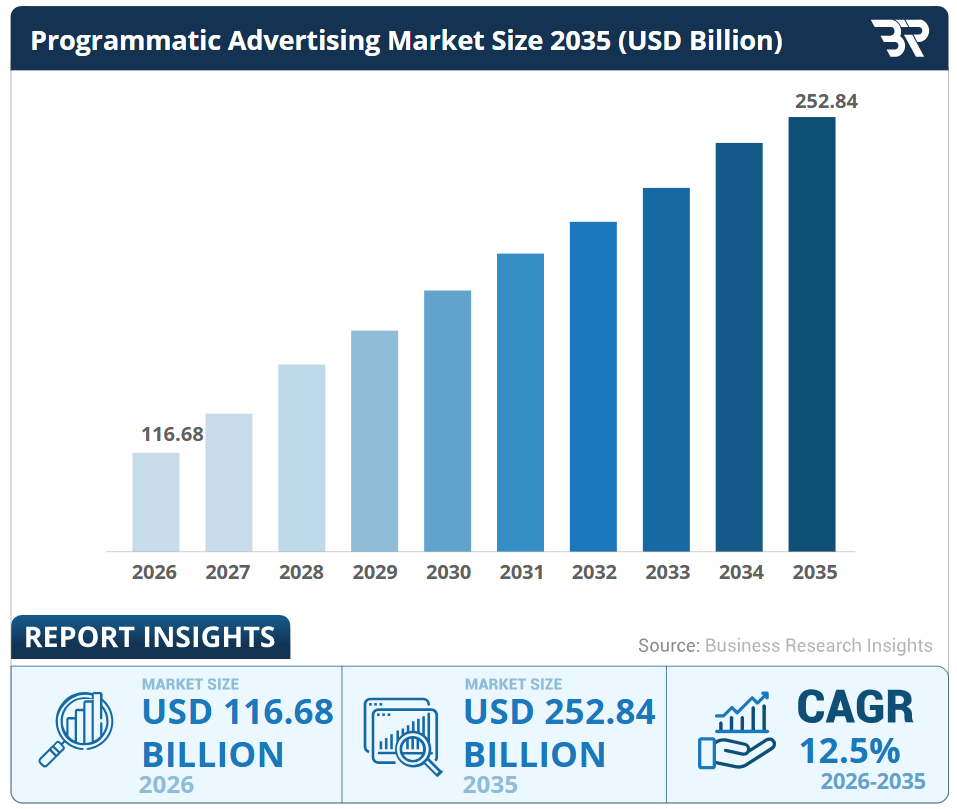
This growth reflects strong demand for precision targeting, real-time bidding technologies, and the ongoing shift of advertising budgets away from traditional channels toward automated programmatic platforms.
Economic Moat
The Trade Desk has a narrow economic moat based on intangible assets and switching costs.
The company’s main intangible asset is its proprietary technology, which processes large volumes of historical bidding, pricing, and performance data. These algorithms allow advertisers to determine the value of impressions in real time, using systems similar to financial trading models. Performance improves as more campaigns and data flow through the platform.
Switching costs. Advertisers and agencies integrate The Trade Desk deeply into their campaign planning, execution, and measurement processes. Replacing the platform would require rebuilding internal workflows and often accepting less transparency or control. This dynamic has supported customer retention above 95% for more than a decade.
Worth noting the company’s neutral position. Because it does not own inventory or media properties, incentives remain aligned with clients. This neutrality strengthens long-term trust and makes the platform difficult to replace at scale, especially for global advertisers.
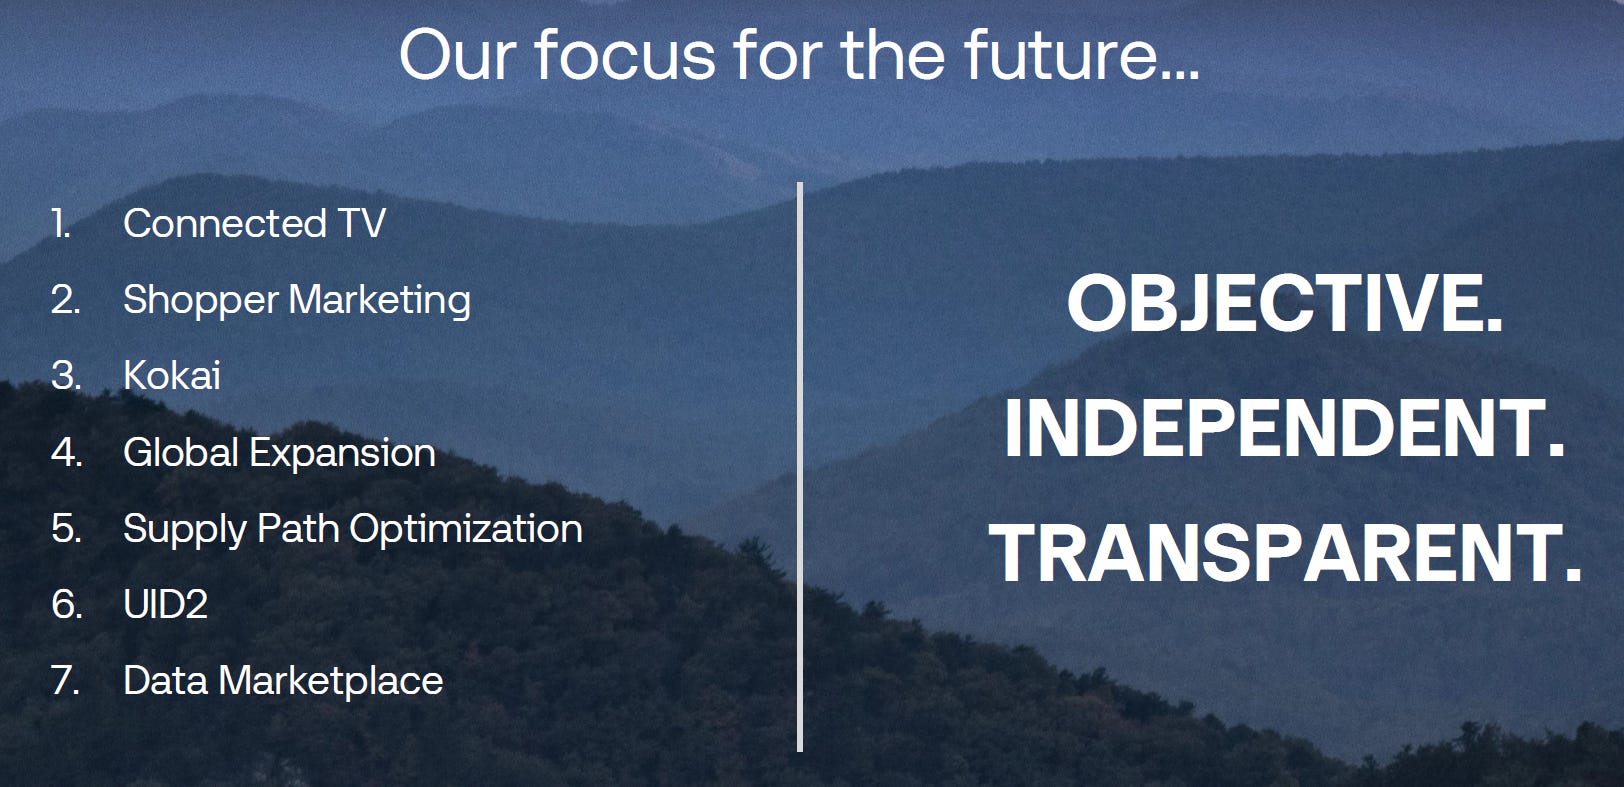
Business Strategy
The Trade Desk aims to position itself as the core infrastructure for digital advertising across the open internet. A central element of this strategy is Kokai, its AI-driven operating system. Kokai improves bidding efficiency, forecasting, and optimization by analyzing large data sets across channels. After early usability issues, adoption improved, and most existing clients now use the system.
Another strategic focus is OpenPath, which connects advertisers directly with publishers. This reduces reliance on intermediaries and improves supply chain transparency. Over time, wider adoption could support stronger margins while keeping pricing fair for both sides of the market.
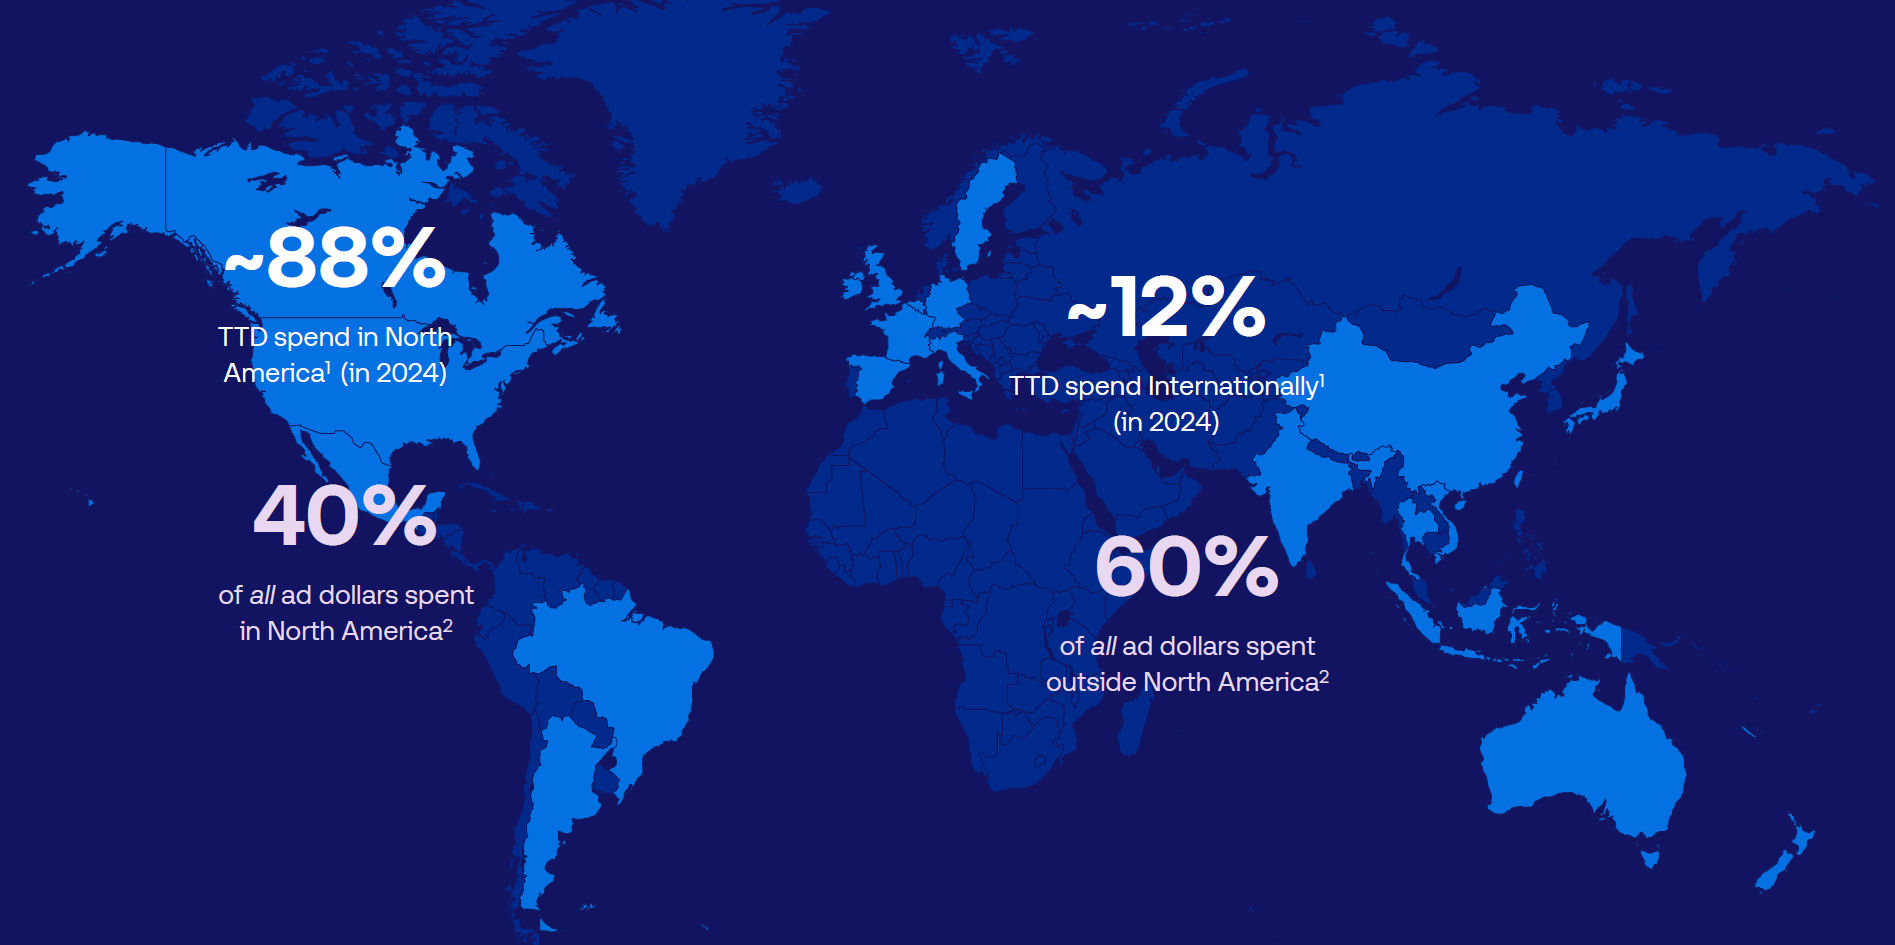
Unified ID 2.0 is another long-term initiative. This open-source identity framework is designed to operate without third-party cookies and relies on consent-based identifiers. Management views this as critical in a privacy-focused environment. International markets and connected TV remain priority growth areas, supported by expectations that global advertising spending could approach $1.5 trillion by 2034.
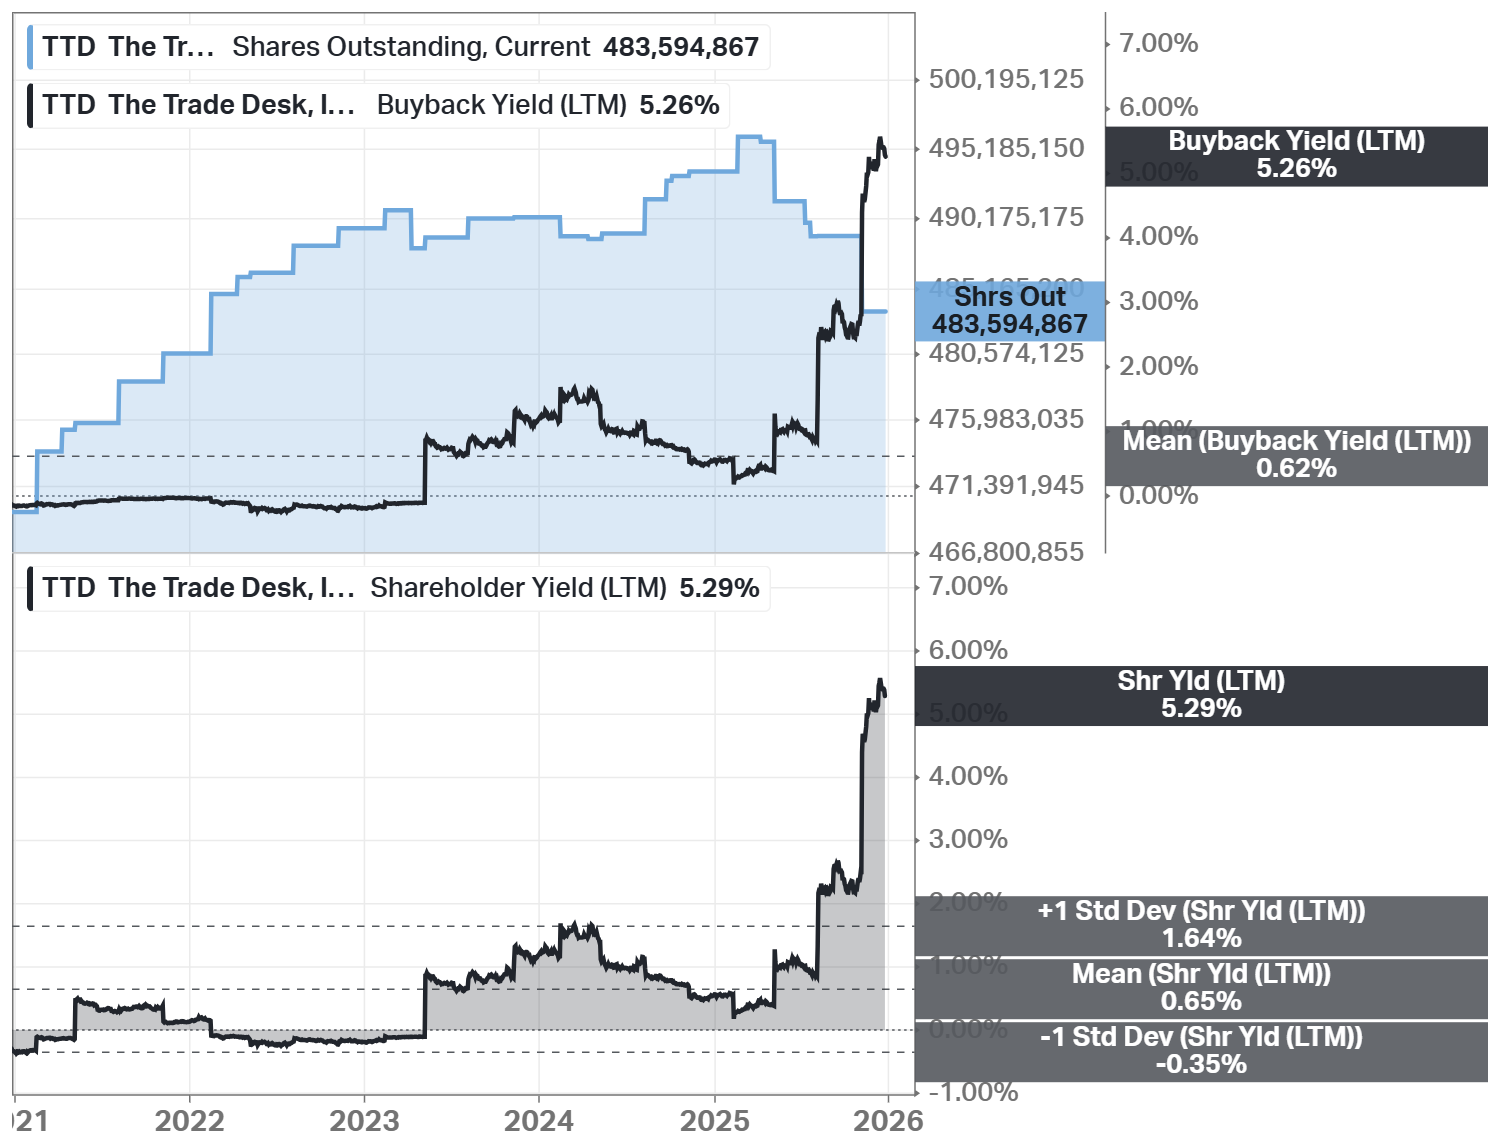
Capital Allocation
The company operates with low debt and maintains a strong cash position. This conservative financial structure reduces risk during advertising downturns and supports continued investment in technology and partnerships.
Analyst’s Note:
Total liabilities are much higher than total debt because most obligations are operational, such as payables, accrued expenses, deferred revenue, and lease liabilities, rather than interest-bearing borrowings. Actual financial debt remains limited and is well covered by cash and operating cash flow.
Capital returns focus on share repurchases rather than dividends. A $1 billion buyback authorization was approved, and repurchase activity increased (an additional $500 million share repurchase authorization) after the stock price decline in 2025. Management treats buybacks as flexible tools rather than fixed commitments.
Acquisitions remain small and strategic. Past transactions focused on data and identity capabilities rather than revenue expansion. These deals were completed at reasonable valuations and did not materially increase goodwill, reflecting disciplined capital deployment.
Advantages
Platform independence. The Trade Desk does not sell its own advertising inventory, which allows it to optimize campaigns purely based on client objectives. This creates trust with agencies and global advertisers that value transparency.
Operating leverage. In 2024, revenue grew by more than 30% year-over-year while adjusted EBITDA margins stayed high. This shows that incremental growth converts efficiently into profitability.
Leadership in connected TV. This channel has become the largest contributor to advertising spend on the platform. Advertisers benefit from programmatic access and improved measurement compared to traditional television.
Analyst’s Note:
YouTube is part of Google’s closed ecosystem. It is a massive video property, but it is NOT considered “open internet” inventory.
Proprietary data and technology. Years of bidding and performance history feed machine-learning models that continuously improve results. New competitors cannot easily replicate this data depth.
Client retention. Retention above 95% for over ten years reflects deep integration and satisfaction. This stability supports predictable long-term growth.
Disadvantages
Exposure to economic cycles. Advertising budgets often decline during economic slowdowns, which can reduce spending on the platform. Revenue growth can therefore fluctuate sharply.
Intense competition from large technology firms. These companies can subsidize advertising products using profits from other business lines. This creates long-term pricing pressure.
Execution risk. Expanding into infrastructure solutions like OpenPath and identity frameworks increases complexity. Slow adoption could delay expected benefits.
Dependence on agencies. While relationships are strong, agencies ultimately control budget allocation. Strategic changes at agencies could impact spend levels.
Regulatory and privacy developments. Even with Unified ID 2.0, changes in regulation could affect targeting and measurement approaches across the industry.
Competitors
Google (GOOGL) is the strongest competitor. It operates across the full advertising stack, including buying tools, exchanges, and owned media such as Search and YouTube. This vertical integration allows Google to favor its own inventory, reducing neutrality compared to The Trade Desk.
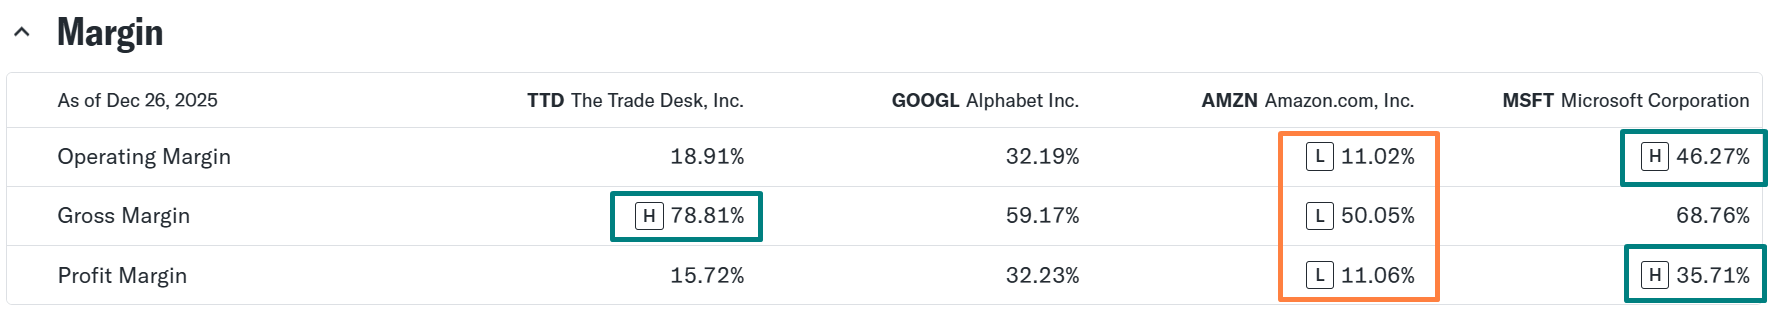
Amazon (AMZN) competes through its retail-focused advertising platform. Its strength comes from direct access to shopping and transaction data. This makes Amazon attractive for advertisers focused on commerce outcomes.
Microsoft (MSFT) competes by combining advertising tools with enterprise software and cloud services. Its advertising business benefits from integration with data and productivity platforms, though scale remains smaller.
Adobe (ADBE) competes by embedding advertising and analytics within a broader marketing software suite. This approach appeals to large enterprises but lacks an independent media buying scale.
Worth noting, none match The Trade Desk’s clear focus on the open internet.
Past
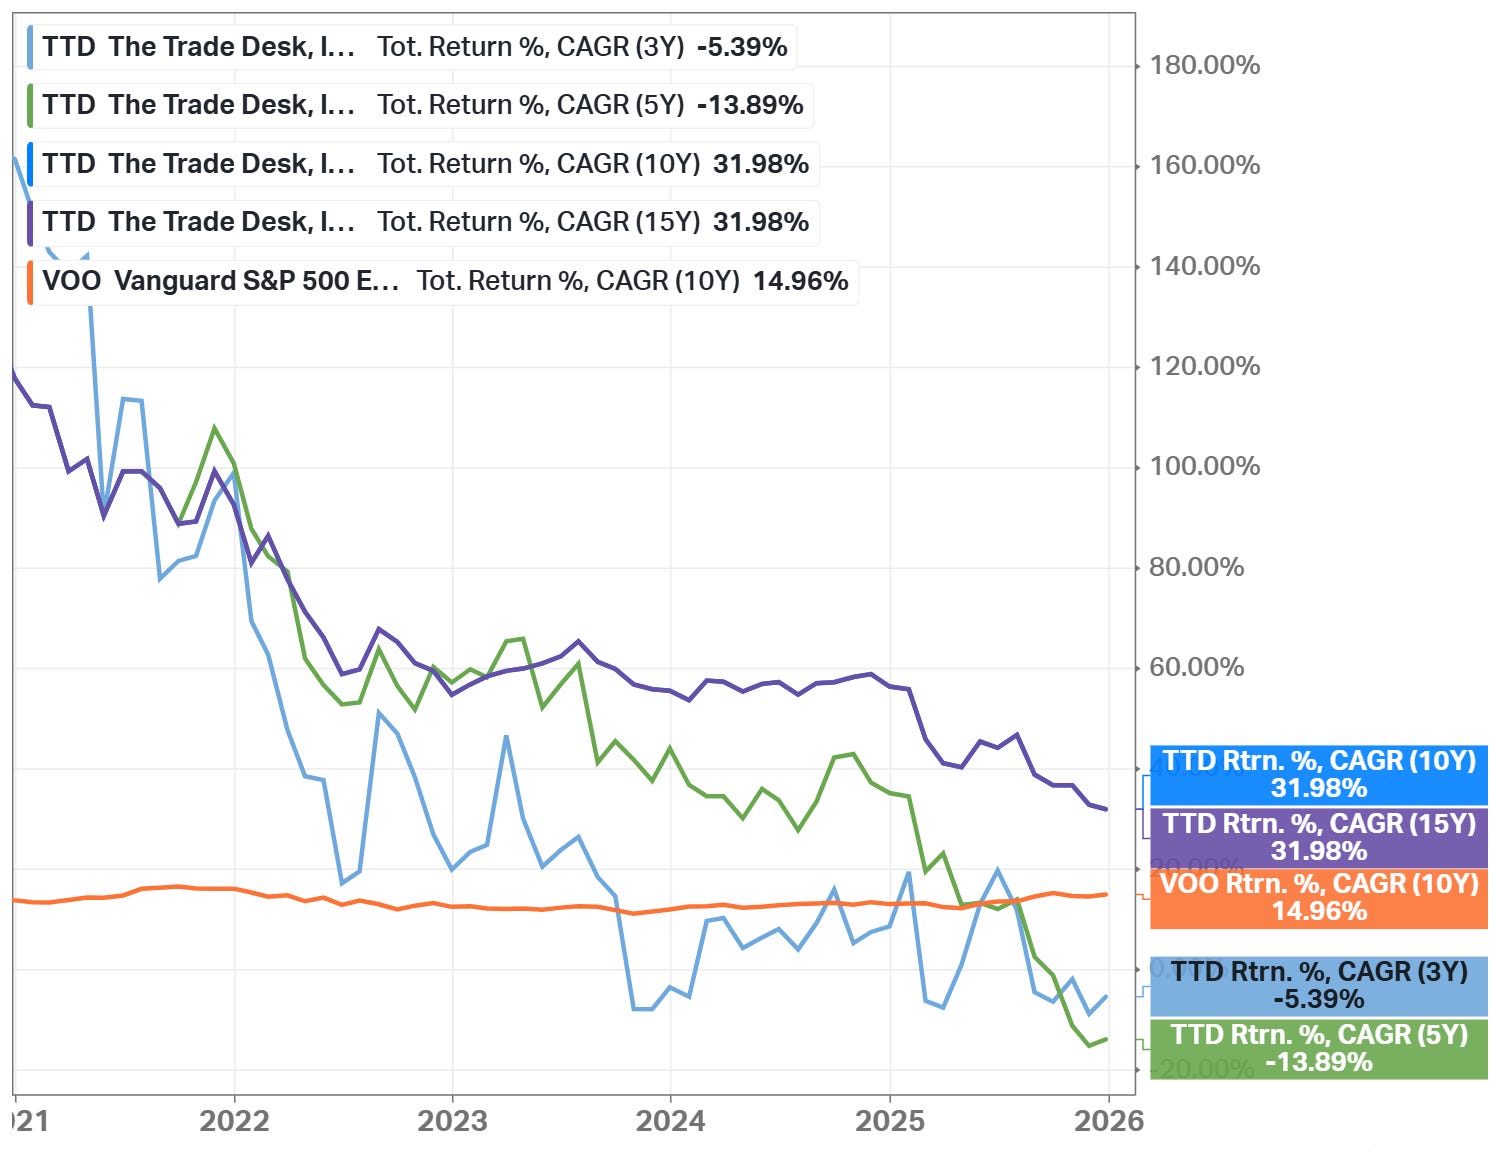
The CAGR rate for the stock over 3, 5, 10, and 15-year time periods is shown above. The stock overperforms the S&P 500 only on longer time periods (10Y and 15Y), and underperforms on 3Y and 5Y periods.
Below are some significant recent events.
AI-Driven Platform Innovation: TTD continued to build out its AI-powered Kokai platform and related features like Audience Unlimited, enhancing advertisers’ ability to optimize campaigns using data and machine learning.
Privacy & Identity Initiatives (UID2): The Trade Desk continued supporting Unified ID 2.0 (UID2) as a privacy-centric identity framework to help advertisers target and measure audiences without third-party cookies.
Connected TV (CTV) Momentum: The Trade Desk’s platform saw continued strength in connected TV demand, with further integrations and partnerships expanding access to premium inventory globally.
Share Repurchases & Capital Allocation: TTD announced a $500M share repurchase authorization and used a portion of cash for buybacks during 2025, underscoring capital-return discipline.
Customer Retention: The company maintained high customer retention (above 95%), as it has for the past 11 consecutive years.
Added to the S&P 500 Index: The Trade Desk was officially added to the S&P 500 index on July 18, 2025, replacing Ansys Inc. in the benchmark.
Future
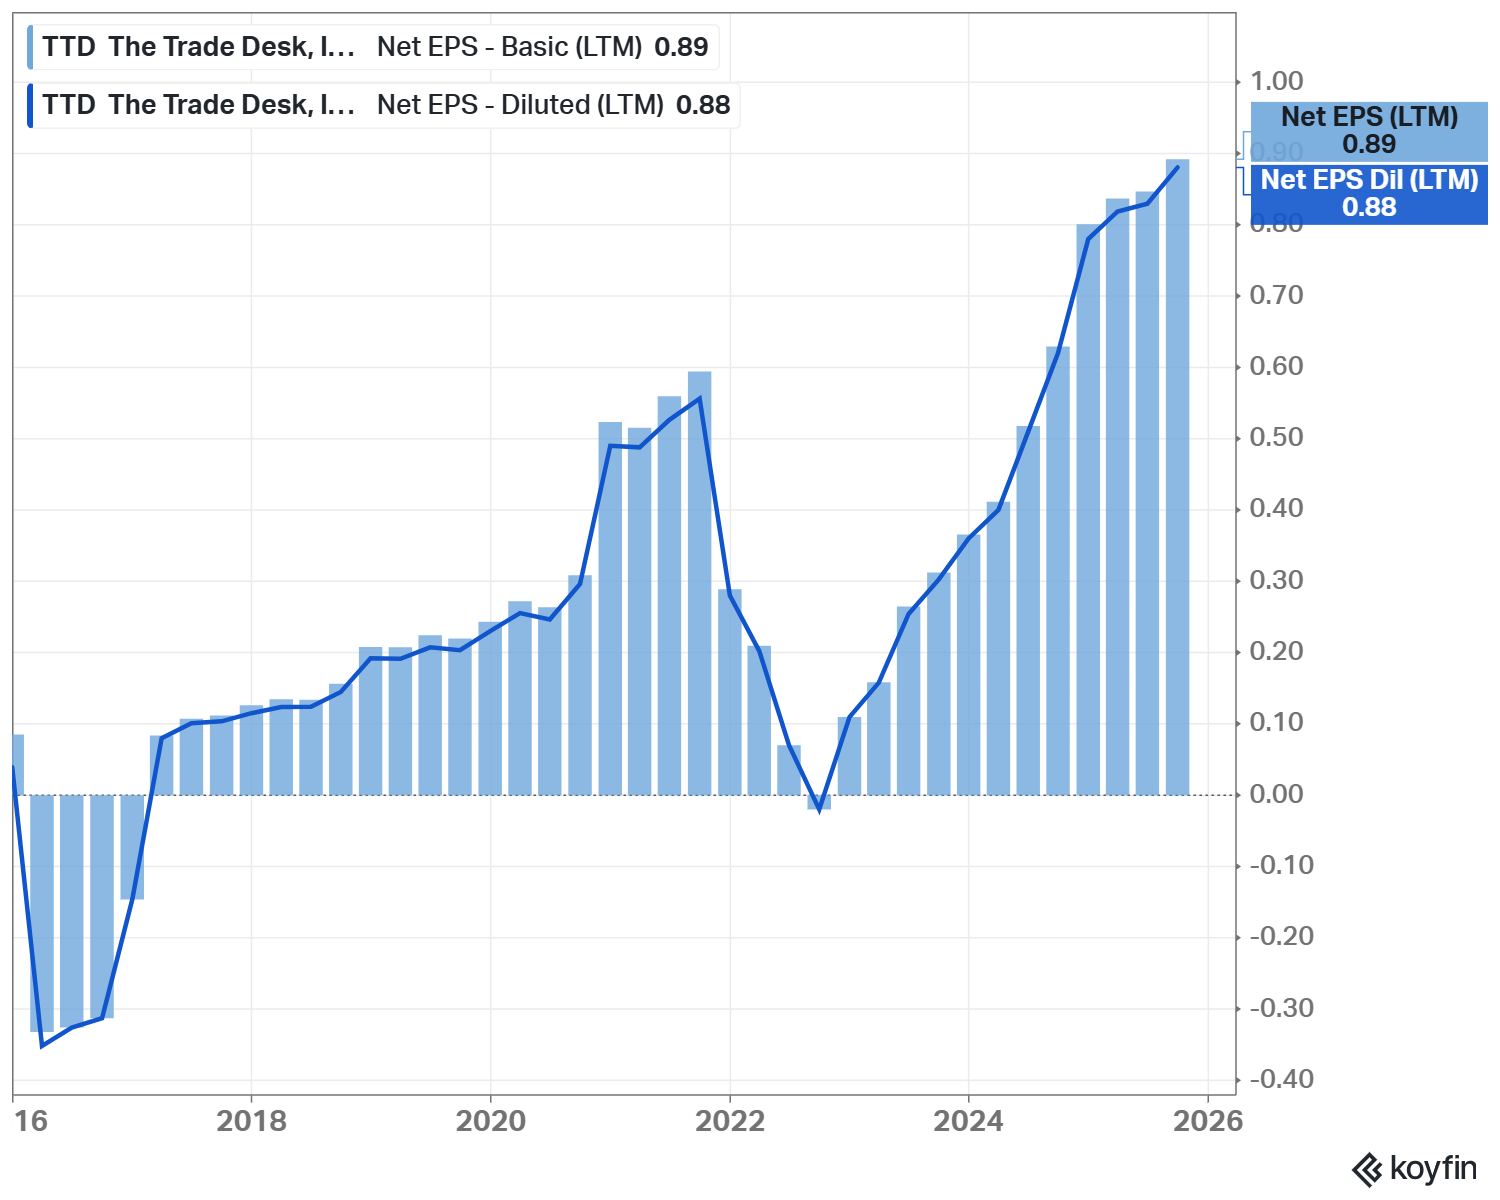
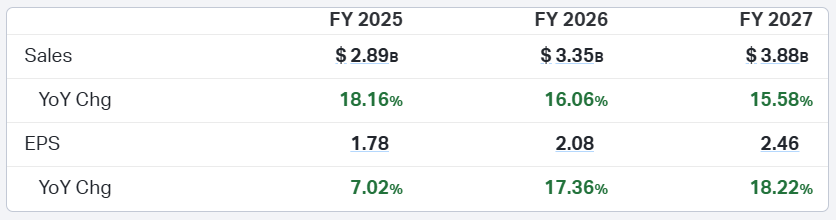
Below is the 3-year forecast for future sales and EPS growth, which is projected to be around 16.6% and 14.2%, respectively.
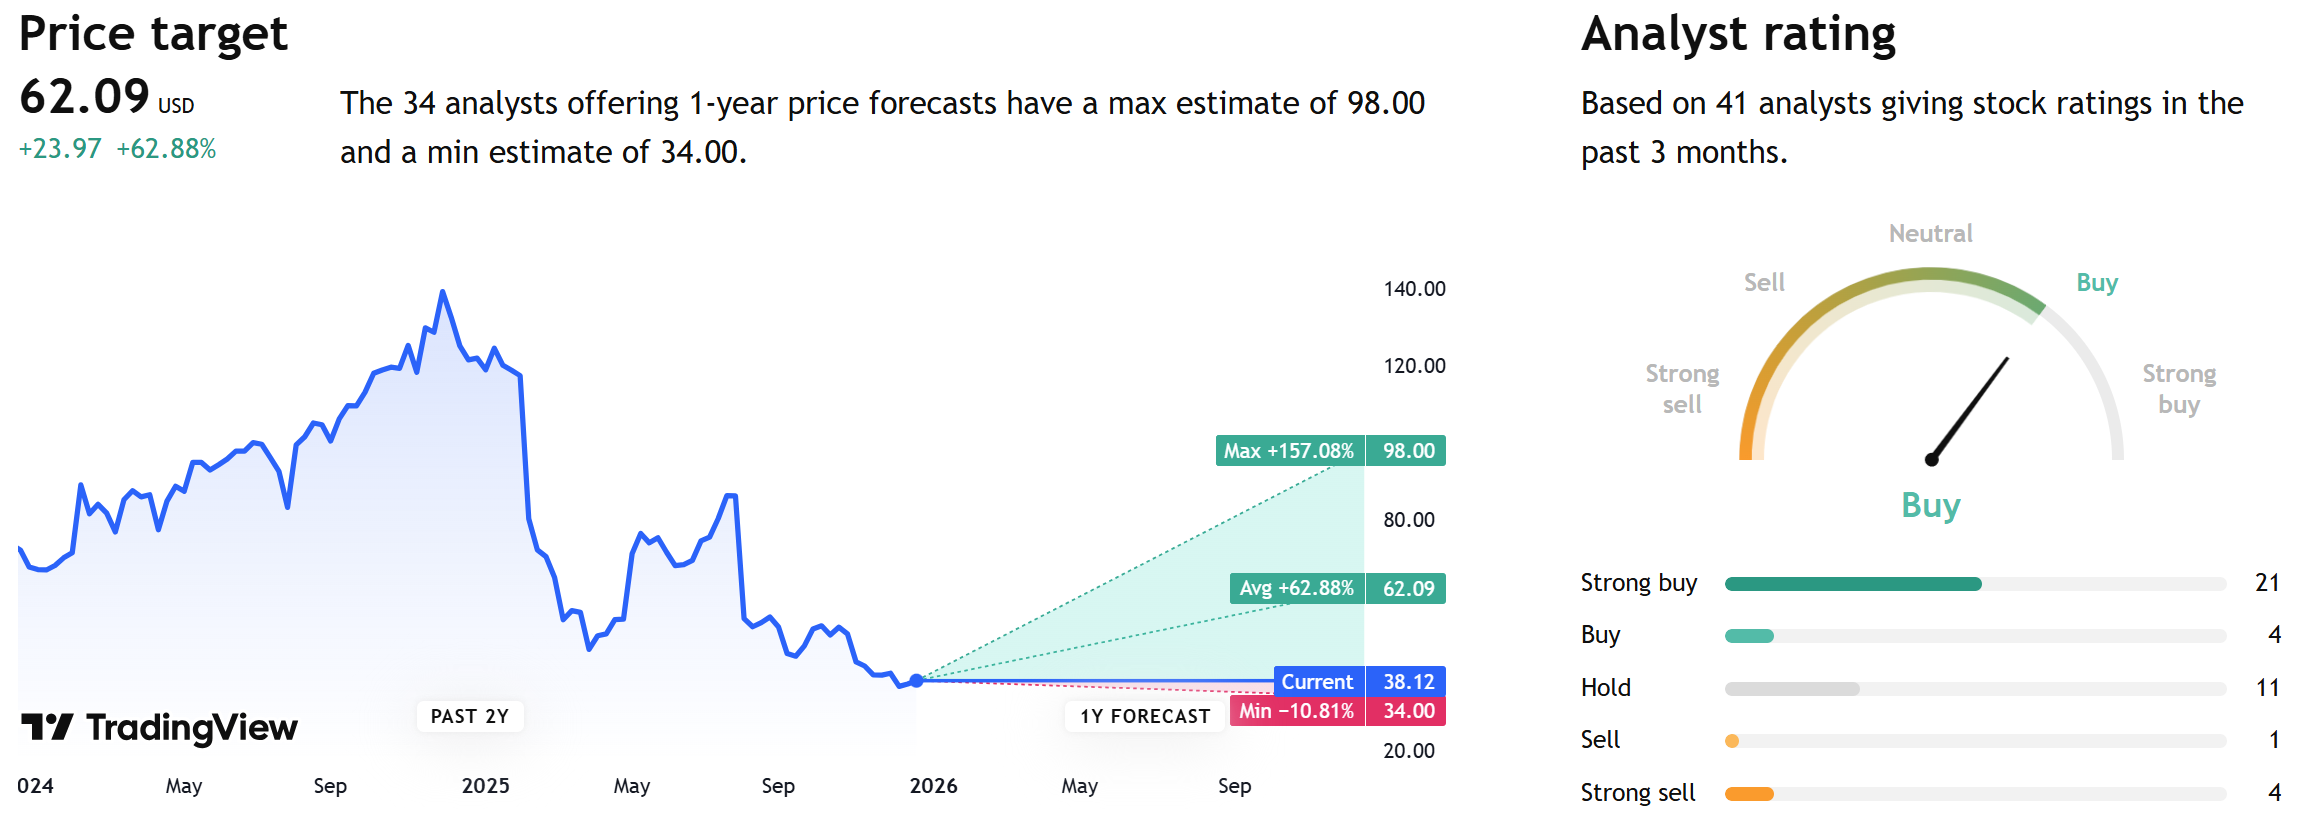
Based on 1-year price targets offered by other analysts, the average price target for TTD comes to $62. The average price target represents an increase of 62%.
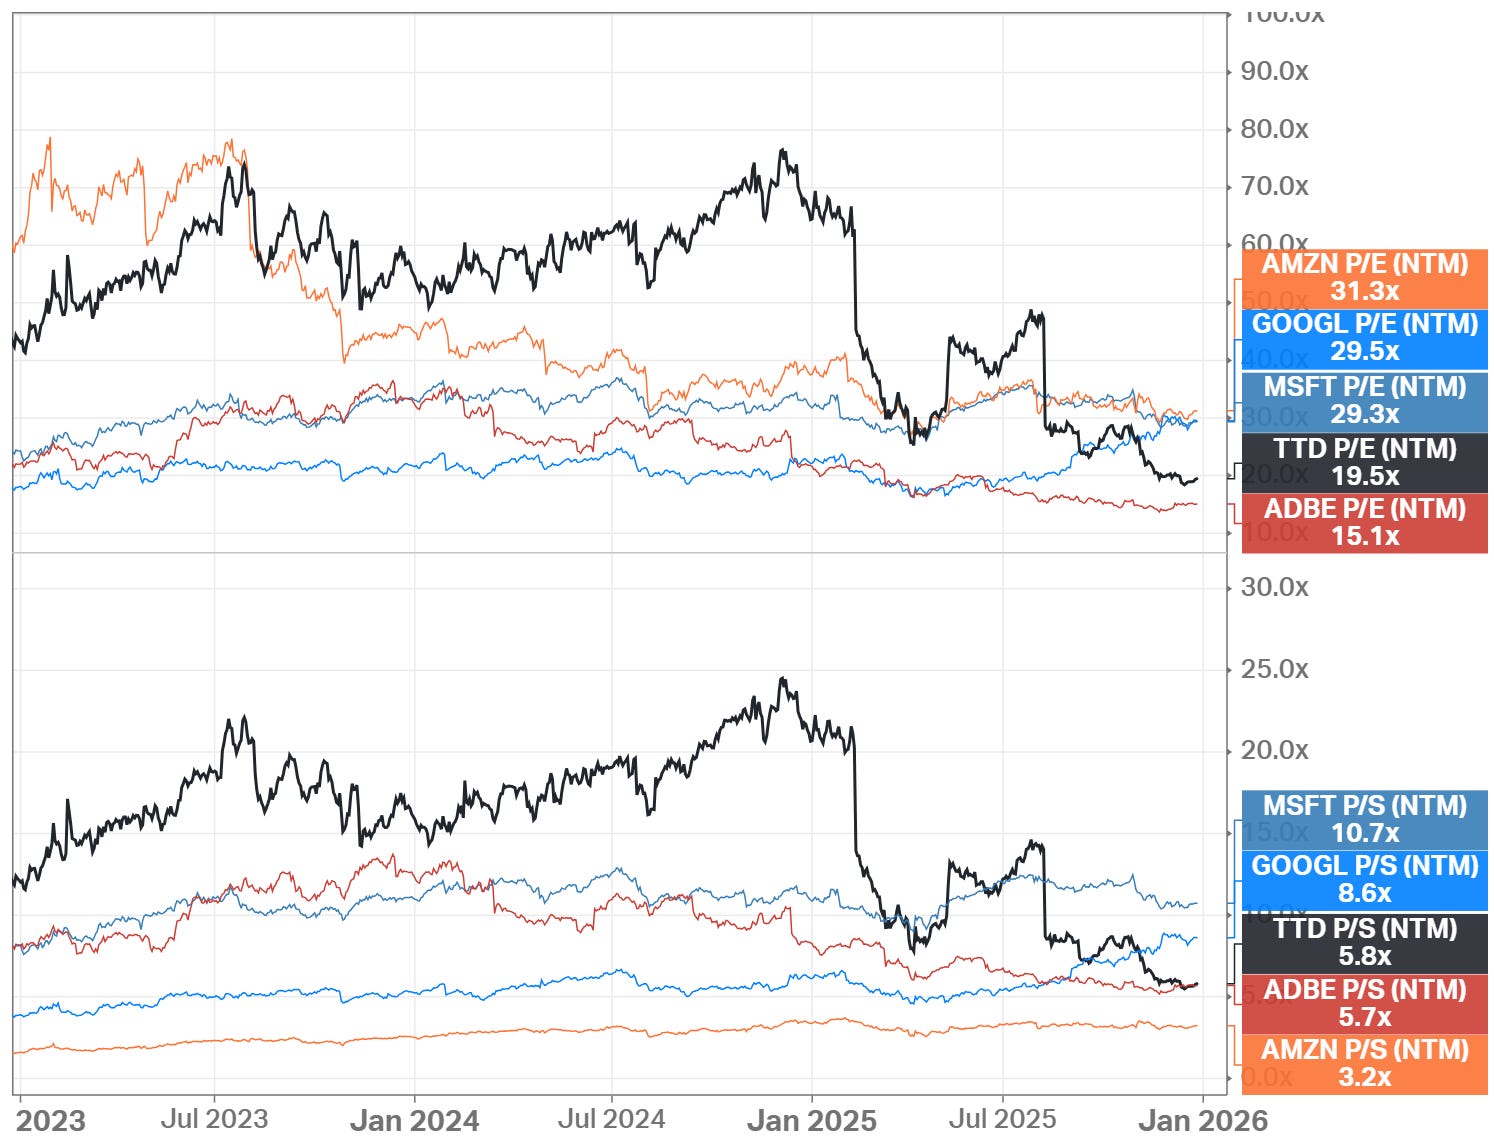
Current Valuation
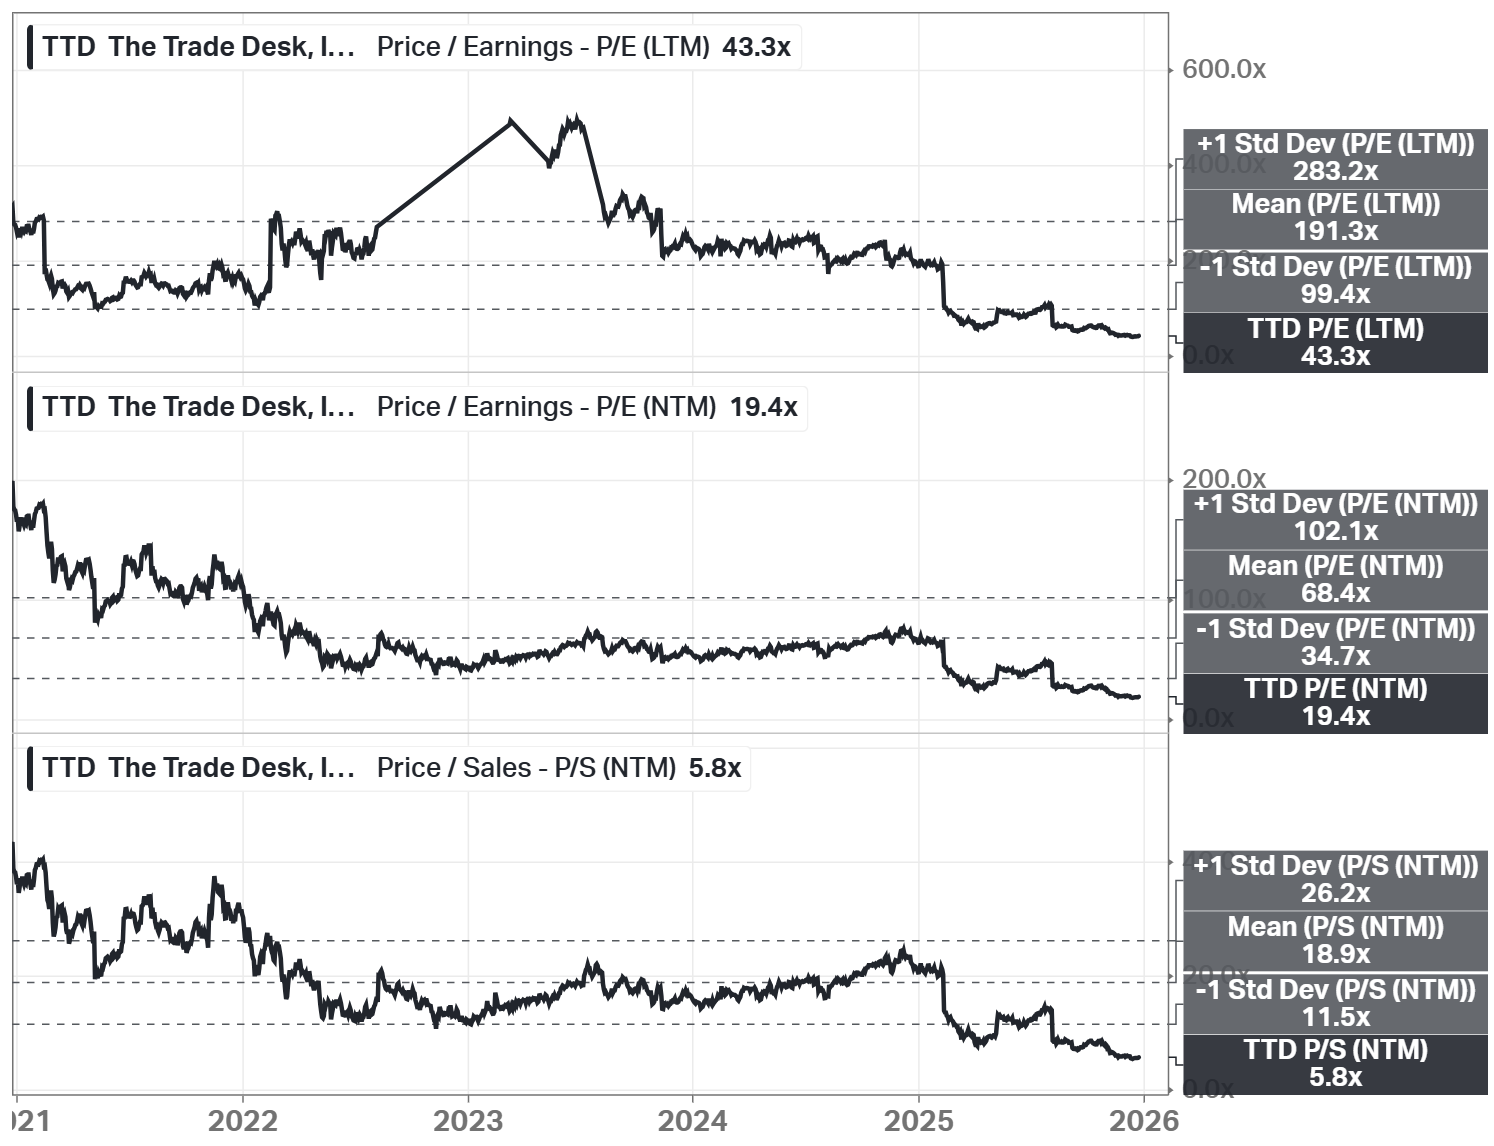
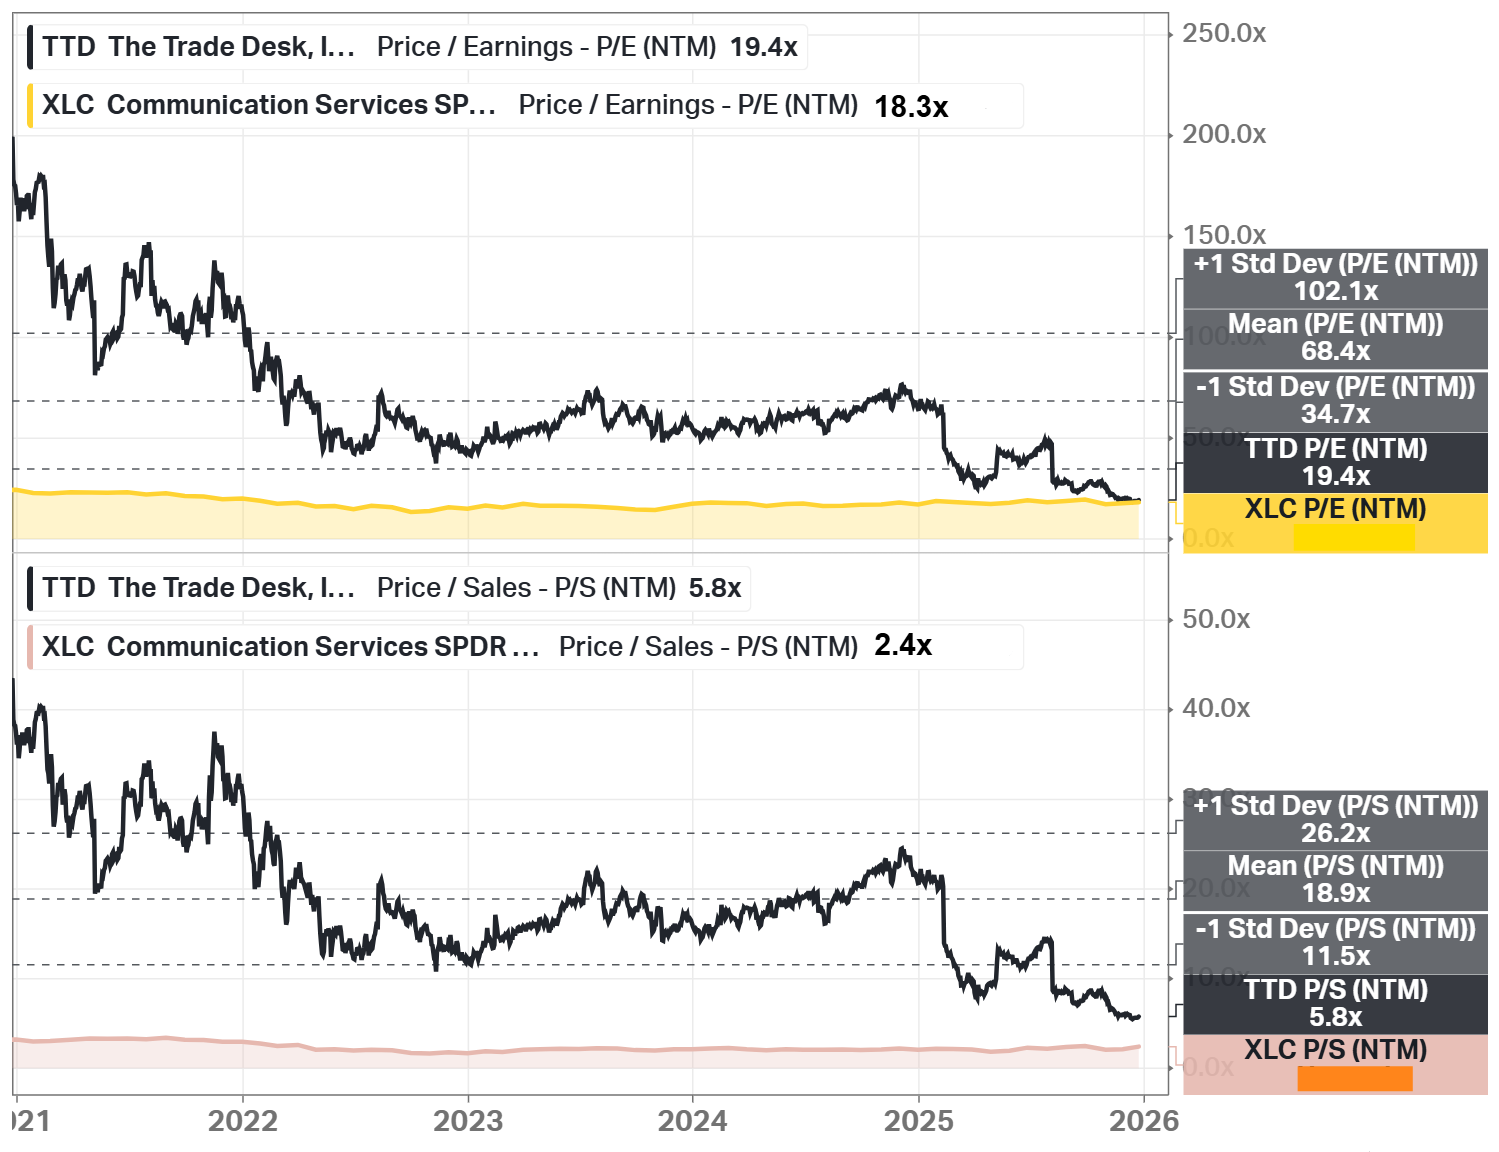
The Trade Desk’s valuation ratios indicate that the stock trades at lower levels compared to its 5-year history across all ratios.
The company’s price-to-earnings ratio on a trailing basis is 43.3x, which is below the 5-year average of 191.3x. On a forward basis, the price-to-earnings ratio is 19.4x, also below its historical mean of 68.4x. The forward price-to-sales ratio is 5.8x, below its mean of 18.9x.
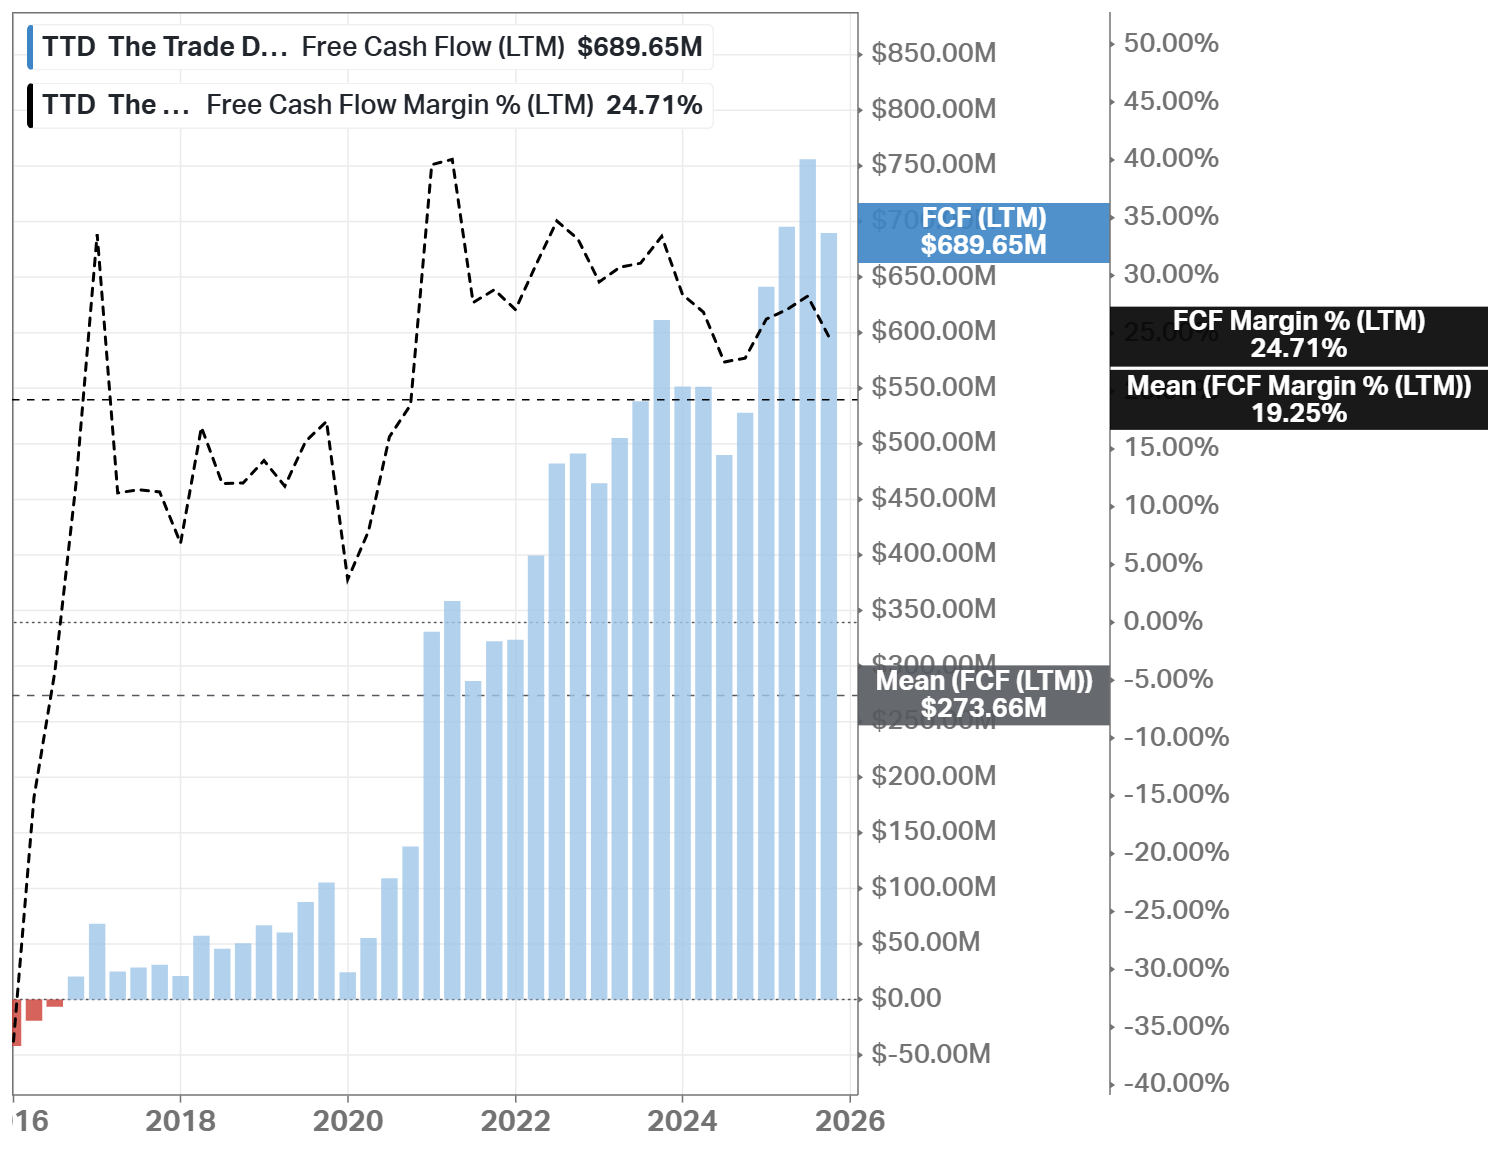
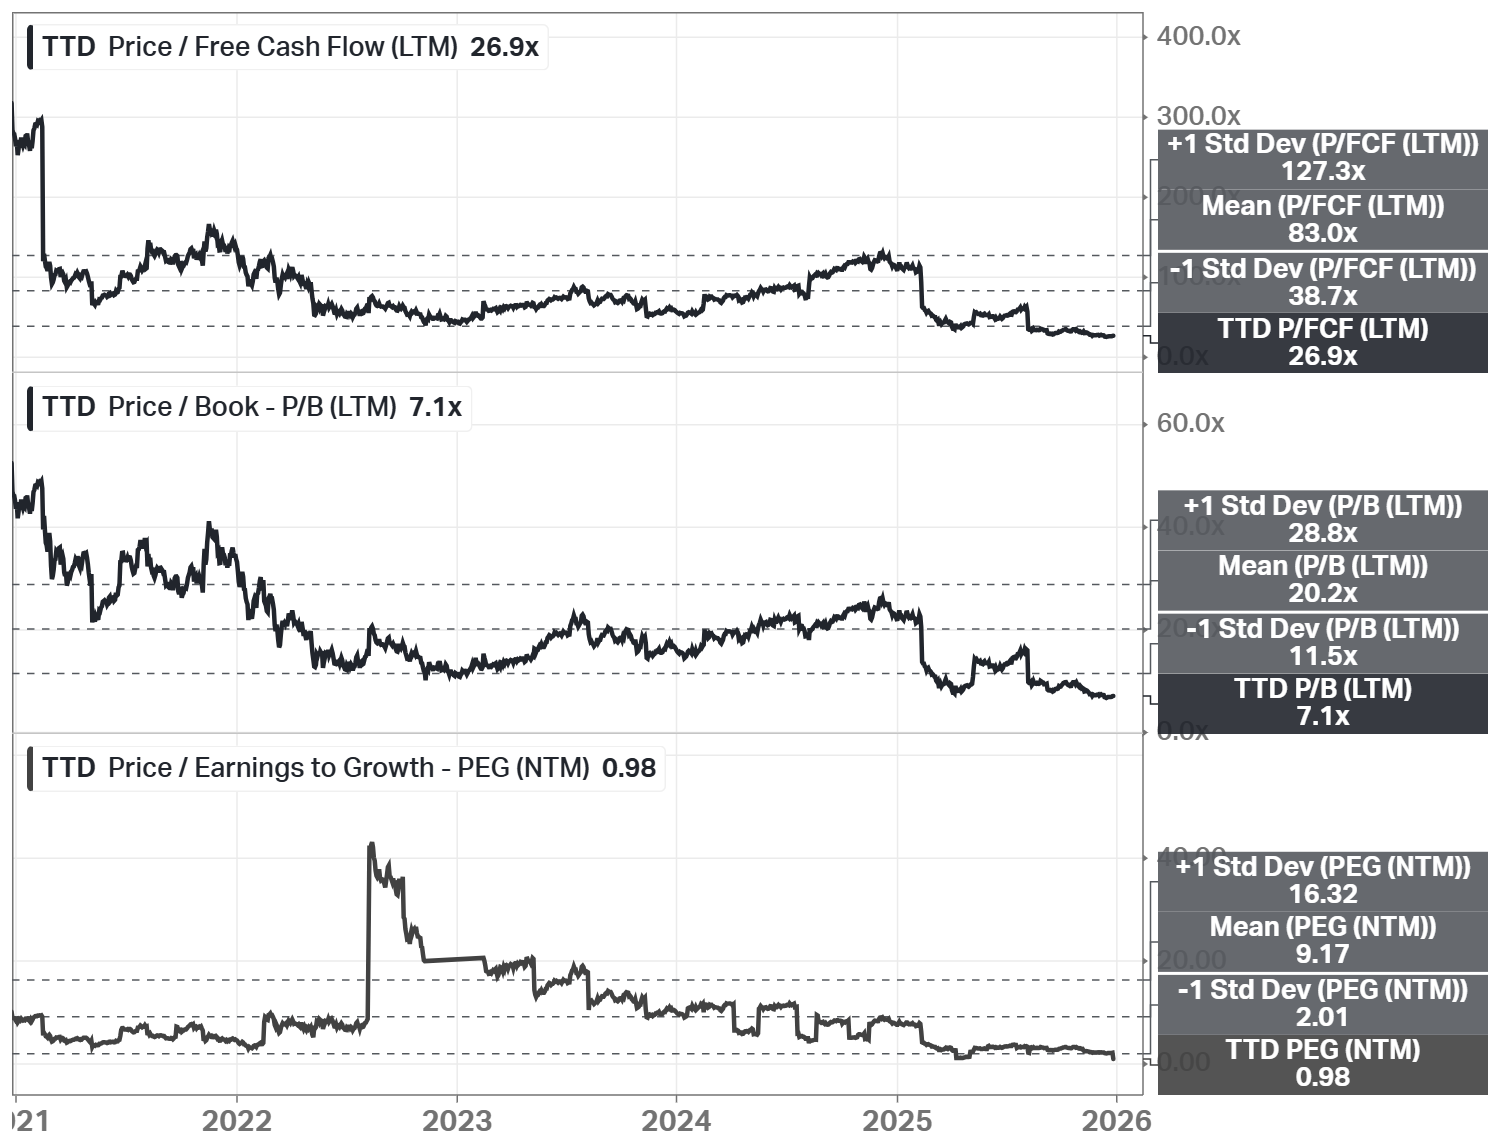
Looking at cash generation, TTD trades at 26.9x times free cash flow, which is below its 5-year mean of 83x. The price-to-book ratio is 7.1x, also below its historical mean of 20.2x. The PEG ratio is only 0.98, which is significantly below its 5-year historical level (9.17x).
Below is a comparison with the communication services sector (XLC) in a 5-year timeframe. TTD trades above the sector averages, except for the PEG ratio.
Fair Price
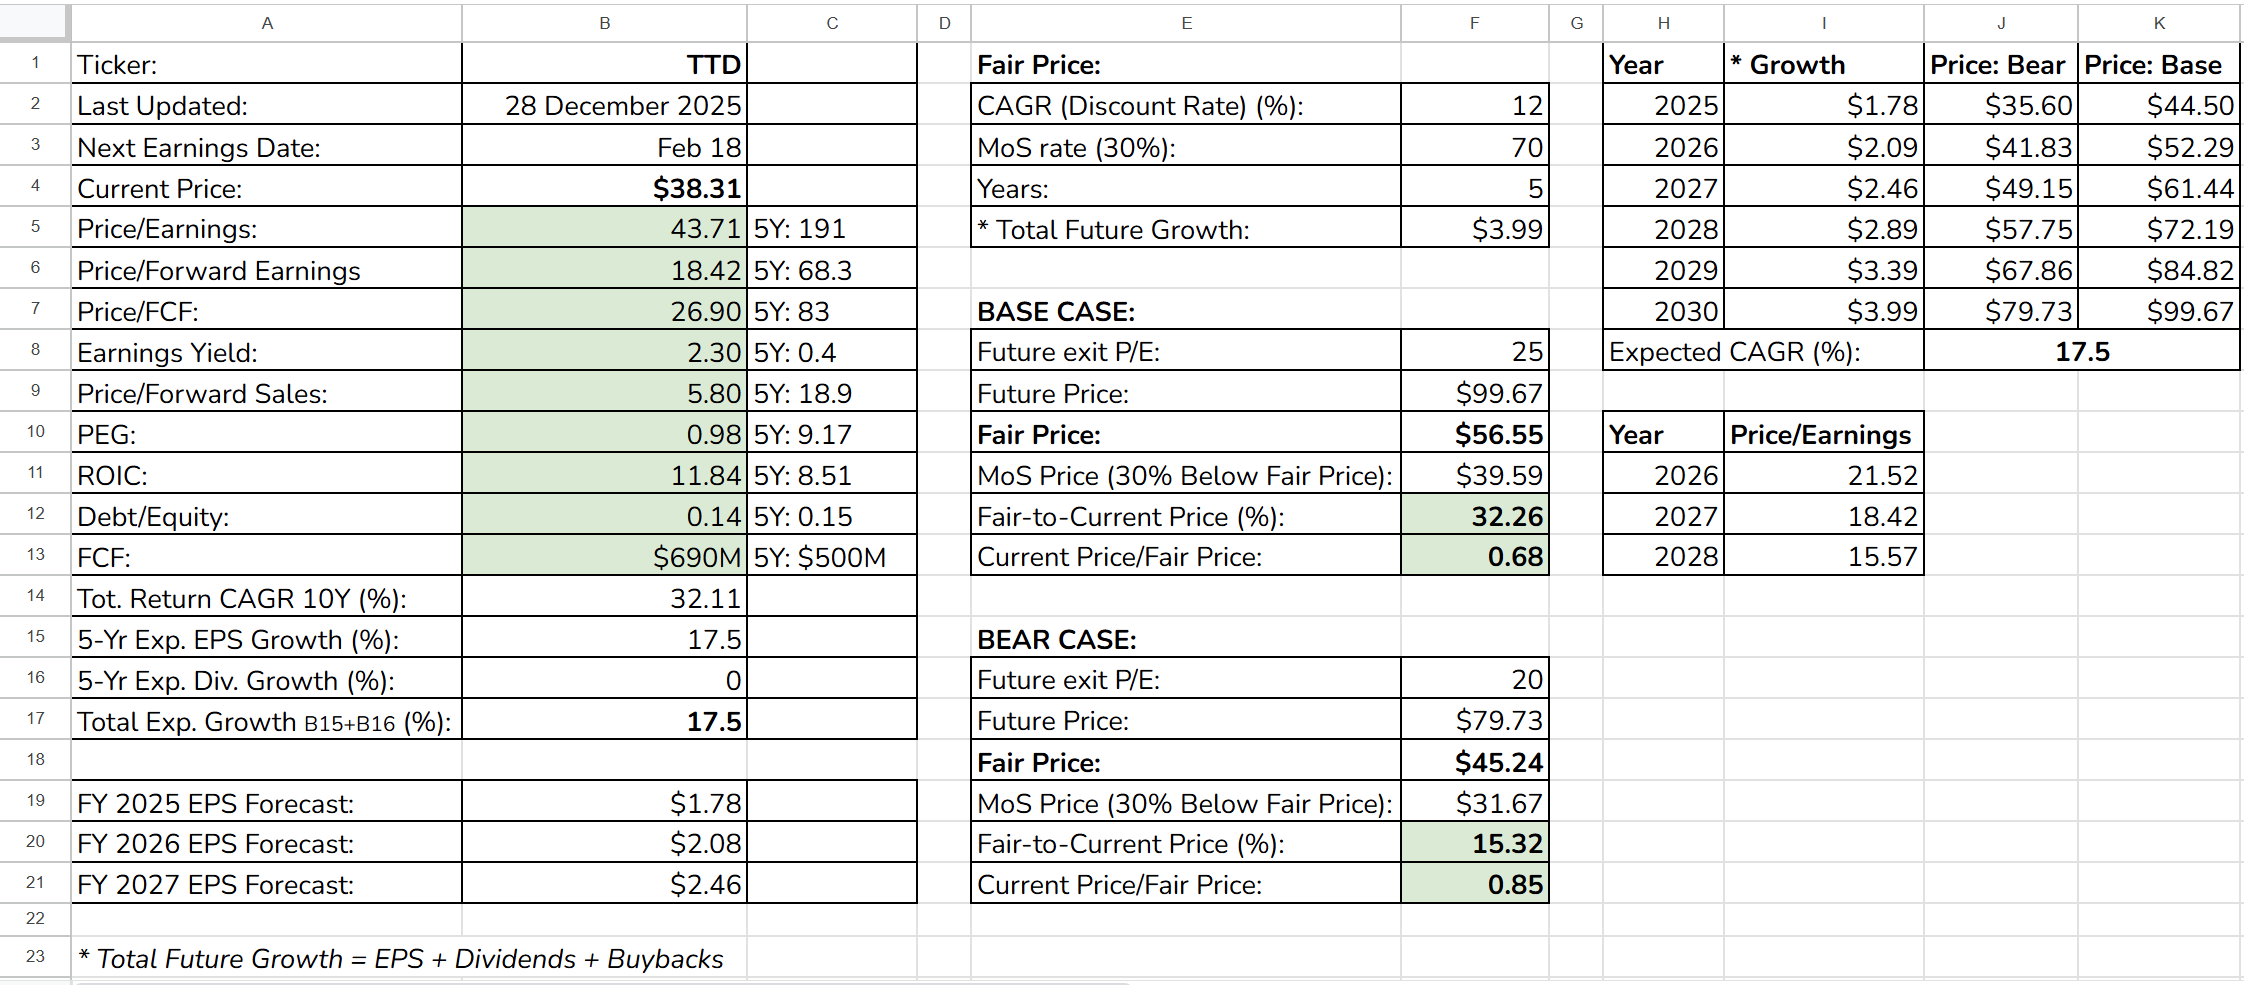
The Long-Term Pick’s Fair Price (Base Case) for TTD is $56.55. The current price of $38.31 is lower by 32.26%.
Fair-to-Current Price (%): 32.26%
Current Price/Fair Price: 0.68
I used:
Discount Rate: 12%
Margin of Safety: 30%
Years: 5
Future EPS Growth Rate: 17.5%
Future Dividend Yield: 0%
Total Future Annual Growth Rate: 17.5 + 0 = 17.5%
As the exit Price/Earnings ratio for the Base Case, I used 25. For the Bear Case, I subtracted 5 from the Base Case (the value is close to the current Price/Forward Earnings ratio).
Checklist
Profitability:
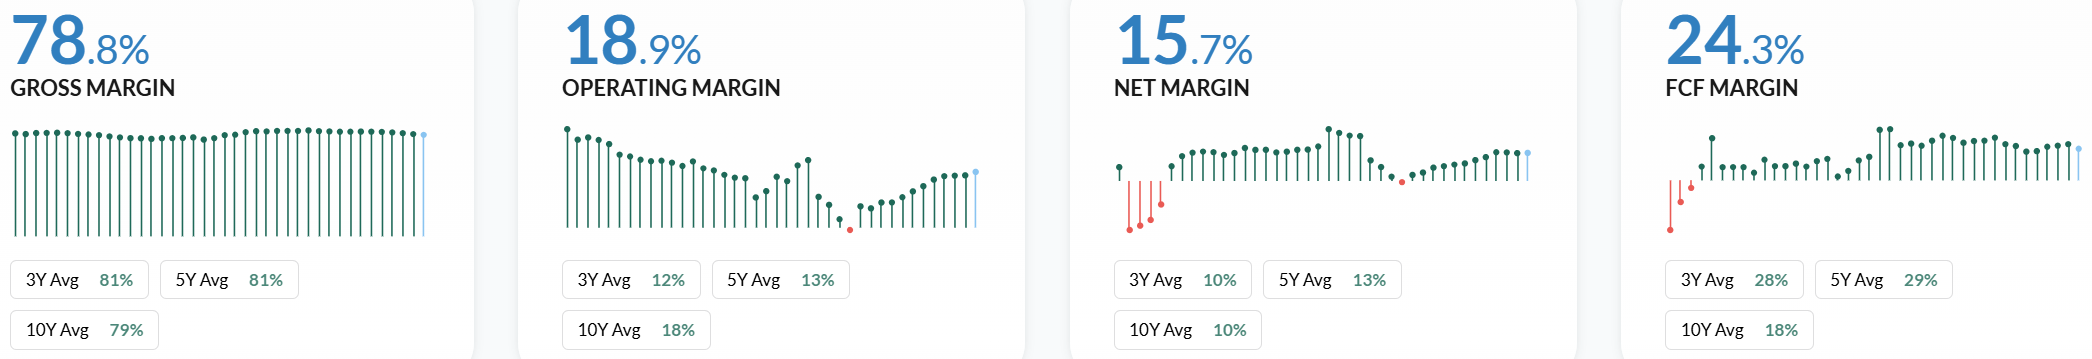
✅ Gross margin at least 40%: 78.8%
✅ Net margin at least 10%: 15.7%
✅ FCF margin at least 10%: 24.3%
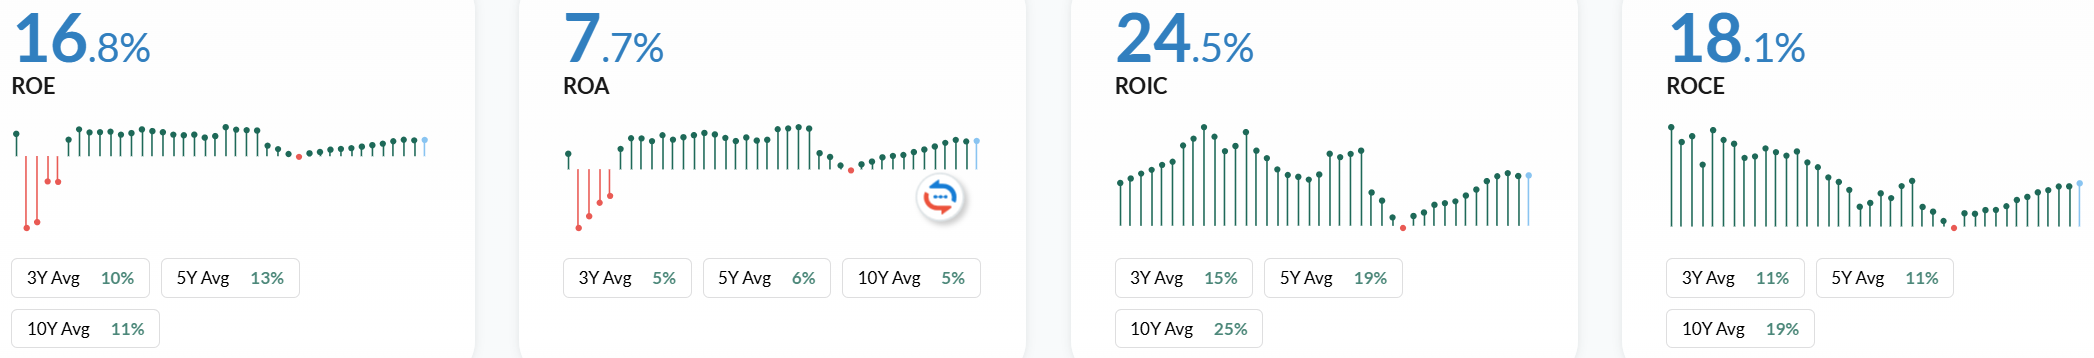
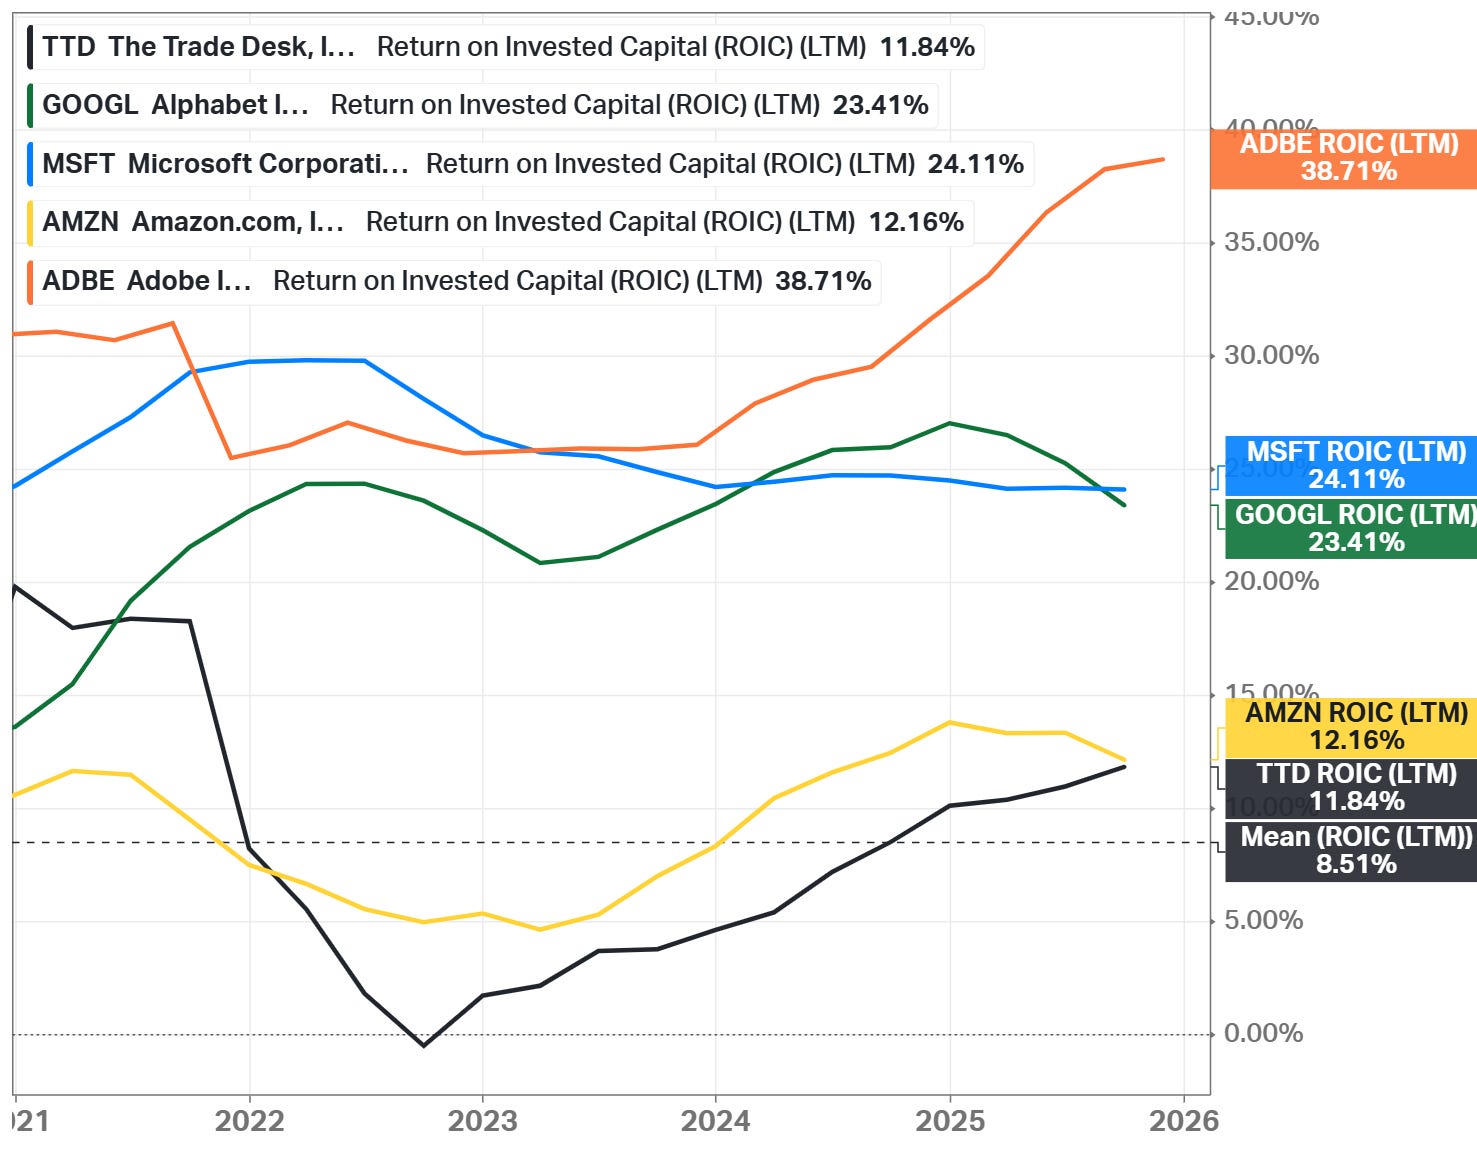
🟨 Management (ROIC, ROCE, ROE, ROA): Yes (All above 10%, except ROA)
🟨 Piotroski F-Score: 5 of 9 (Not passed: Lower Leverage yoy, Higher Current Ratio yoy, Higher Gross Margin yoy, and Higher Asset Turnover yoy)
🟨 EPS surprises in the last 5 years: No (Missed in 2022; Based on TradingView’s data)
✅ EPS growth YoY 5 years in a row: Yes (Based on TradingView’s data)
Valuation and Advantage:
✅ Valuation below its 5-year averages: Yes
❌ Valuation below the sector: No
✅ Does it have a moat: Yes (narrow)
❌ Outperformed the S&P 500 CAGR: No (3 and 5-year didn’t)
Shares:
✅ Insider ownership at least 5%: Yes (9.54%)
✅ Less shares outstanding YoY: Yes
❌ Insider buys last six months: No
Price:
✅ 1-year stock price forecast is above 10%: +62%
✅ Next 3-year EPS growth estimates (CAGR) is above 10%: Yes (14.2%)
❌ DCF Value: $35.4; Overvalued by 8% (5 years, discount rate: 10%, terminal growth: 3%, model: FCFF)
Due Diligence
Profitability (7 of 10):
✅ Exceptional Gross Margin: 79%
✅ Strong 3-Year Average Gross Margin: 81%
❌ Declining Gross Margin: 82% → 79% (in the last 3 years)
🟨 Healthy Operating Margin: 19%
🟨 Sustainable 3-Year Average Operating Margin: 12%
✅ Operating Margin is Increasing: -1% → 19% (in the last 3 years)
🟨 Sustainable 3-Year Average Net Margin: 10%
🟨 Healthy Net Margin: 16%
✅ Net Margin is Increasing: -1% → 16% (in the last 3 years)
🟨 Positive ROE: 17%
🟨 Positive 3-Year Average ROE: 10%
✅ ROE is Increasing: -1% → 17% (in the last 3 years)
🟨 Positive ROIC: 25%
🟨 Positive 3-Year Average ROIC: 15%
✅ ROIC is Increasing: -1% → 25% (in the last 3 years)
Solvency (9.5 of 10):
✅ High Interest Coverage: 433.23 (earns more than enough operating income (427m USD) to safely cover interest payments on its debt (986k USD))
✅ Short-Term Solvency: short-term assets (5B USD) exceed its short-term liabilities (3B USD)
✅ Long-Term Solvency: long-term assets (6B USD) exceed its long-term liabilities (3B USD)
✅ Low Debt-to-Equity Ratio: 0.15 (very limited reliance on debt financing)
✅ High Altman Z-Score: 5.08 (above the distress threshold, indicating very low bankruptcy risk)
Investment Thesis
The Trade Desk offers an attractive long-term entry point as the stock trades below its five-year average valuation and below my fair value estimate. This discount provides a margin of safety for a business with strong fundamentals and continued revenue and cash flow growth. At the same time, the PEG ratio of 0.98 suggests the valuation is reasonable relative to expected growth.
The company is a clear core leader in digital advertising on the open internet, supported by a narrow economic moat built on scale, high switching costs, and strong global client relationships. Its independent position differentiates it from closed ecosystems and aligns well with advertisers seeking transparency and control.
Long-term growth is supported by a strong global presence, expanding digital advertising budgets, and key initiatives such as Unified ID 2.0 and OpenPath, which address privacy and supply-chain efficiency. With disciplined capital allocation and potential future buybacks, TTD presents a compelling long-term investment opportunity despite near-term advertising cyclicality.
This is not a financial or investing recommendation. It is solely for educational purposes.
Koyfin was used for charts in this analysis. Use this URL to get a special pricing offer of 20% off all Koyfin plans.
Thanks for the deep analysis!
Thanks, Dan, for the deep analysis!