

TL;DR: Uber (UBER) is the world's largest ride-hailing and delivery platform. Over 200 million people use it at least once a month, across 70+ countries. The business is in its best shape ever - bookings increased 24% in Q2, trailing free cash flow passed $10B for the first time, and ROIC reached 24%. At the same time, the stock is down 16% over the last year, at 19.7x forward earnings for ~27% consensus EPS growth - a PEG of 0.74. The market is pricing one fear: autonomous vehicles. This post is my attempt to weigh that fear against the numbers. Verdict: at $76, the stock is 20% below my Bear Case fair price, deep inside the accumulation zone. My full fair price math and the accumulation zone are at the end of this post.
Investment Thesis
The gap is simple to state. Uber's users, bookings, and free cash flow are at all-time highs, yet the stock lost 16% over the past year. Everything in this post hangs on whether the reason for that loss (the robotaxi story) deserves the price it already collected.
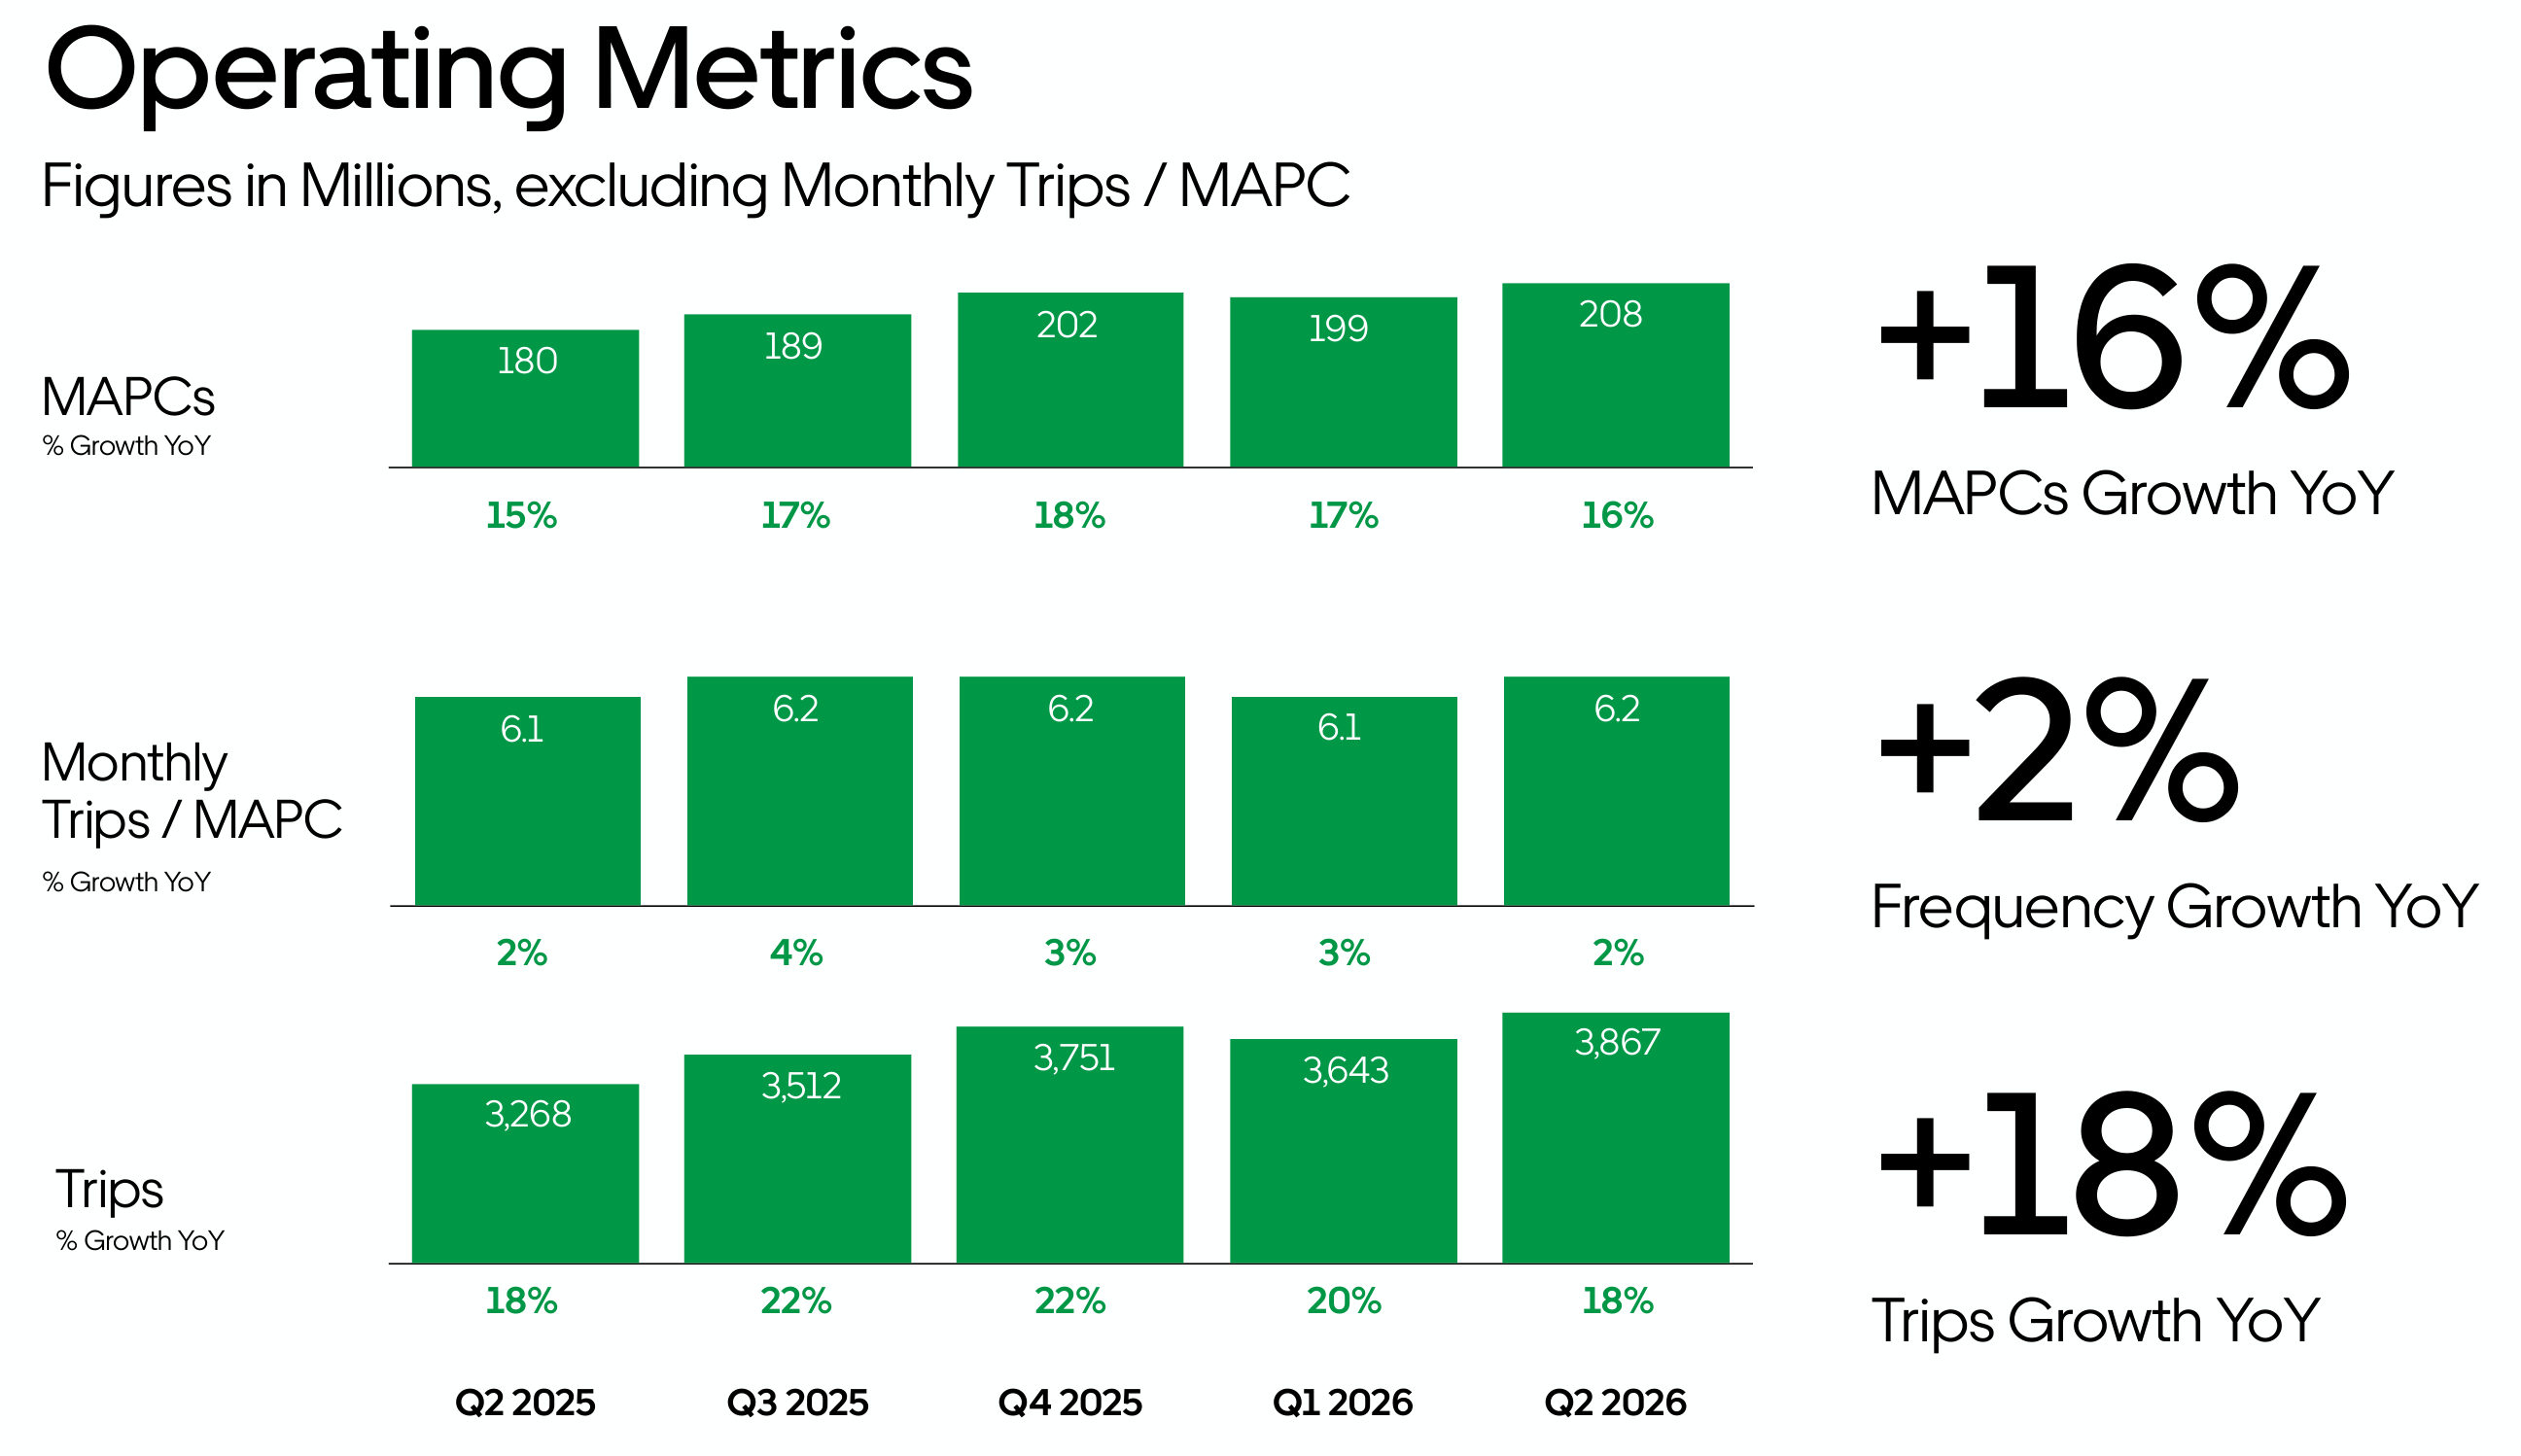
Growth remains strong where it matters. Gross bookings increased 24% YoY in Q2, to a record $58.0B, and 208 million people now use the platform monthly (+16% YoY) - the company added more first-time users over the last 12 months than in any period of the last 5 years. Uber One members now account for more than 70% of delivery bookings.
The growth is not priced in. Consensus expects ~27% EPS growth per year over the next 5 years: $3.36 this year, $4.38 next, $5.46 in 2028. UBER trades at 19.7x forward earnings against that - a PEG of 0.74.
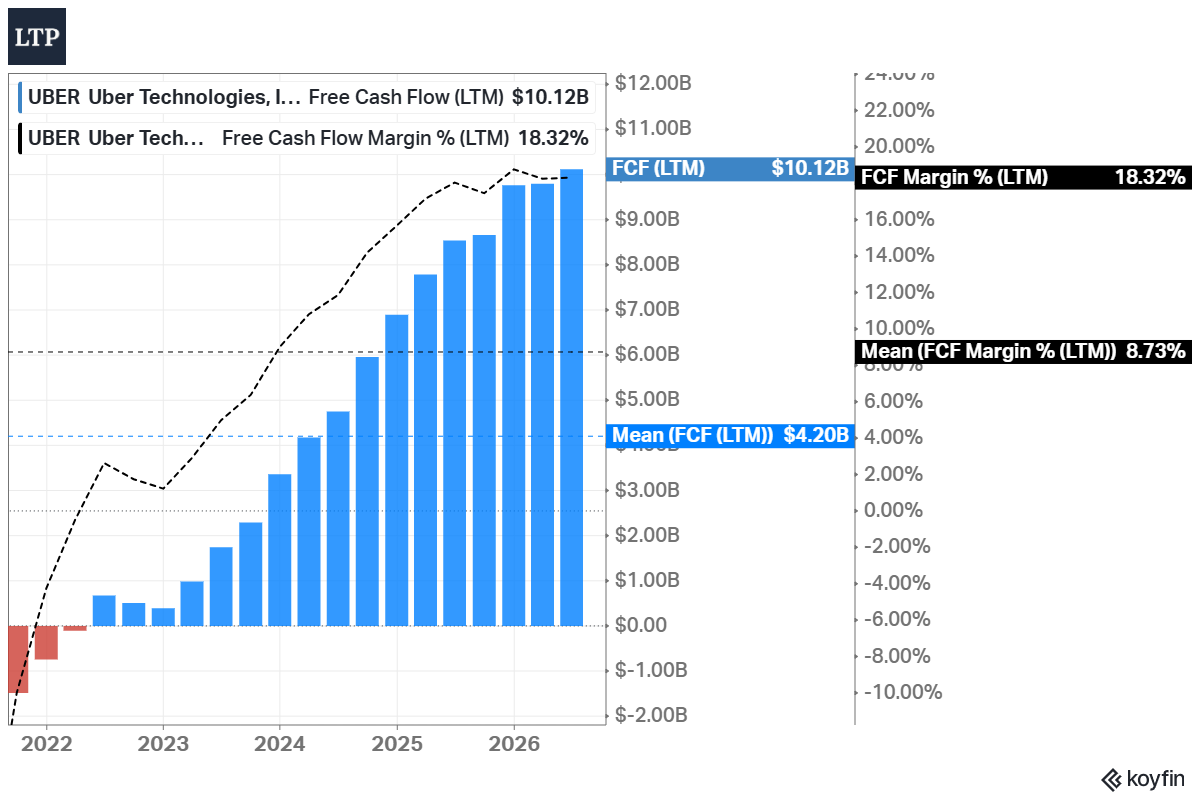
Quality stopped being the question. ROIC is 23.97%, ROE is 37.16%, the FCF margin is 18.32%, and Debt/Equity fell to 0.52 against a 0.88 historical mean. The company that burned cash until 2022 now buys back 4% of its shares a year.
The derating already happened. Uber’s early P/E history is useless (the company lost money until 2023), but the readable metrics agree: P/B is at 5.8x, exactly its -1 standard deviation band; P/S is below its mean; PEG is 0.74.
The bear case: Robotaxis remove the driver, and the driver is the reason an aggregator exists. Waymo already sells rides through its own app in San Francisco and Los Angeles, Tesla (TSLA) promises the same, and a vertical winner does not need Uber in the cities where it operates. My model takes this into account by capping growth at 20% against the 26.8% consensus, and by using today’s 20x multiple as the Bear Case exit - a world where the market never changes its mind about Uber. Even that scenario prices the stock above today’s quote. The math is in the Fair Price section.
Company Overview
Next Earnings Date: Nov 03, 2026 (estimated)
Market Cap: ~$155B
Sector: Industrials
Industry: Ground Transportation
Type: Large Growth
Short Interest: 2.3%
Uber is a marketplace. It matches riders with drivers, hungry people with restaurants and couriers, and shippers with carriers. 208 million people use the platform at least once a month, in over 70 countries. The company reports in three segments, and Q2 shows their weight: Mobility generated $29.0B of bookings (+22% YoY), Delivery $27.5B (+26%), and Freight $1.6B (+25%). Worth noting that delivery now grows faster than rides.
The product range grew far beyond a taxi app. In Mobility: everything from Moto and UberX Share at the cheap end to Black and Reserve at the expensive end. In Delivery: restaurants, groceries and retail, and increasingly advertising on top of the order flow. Uber One ties the segments together, and membership reached another all-time high in Q2.
The deal history shows the same pattern for years: buy the regional leader (Careem), buy the missing piece (Postmates, Transplace), keep equity when leaving a market (Didi in 2016, Grab (GRAB) in 2018, a ~25% stake in Aurora after selling its own AV unit in 2020).
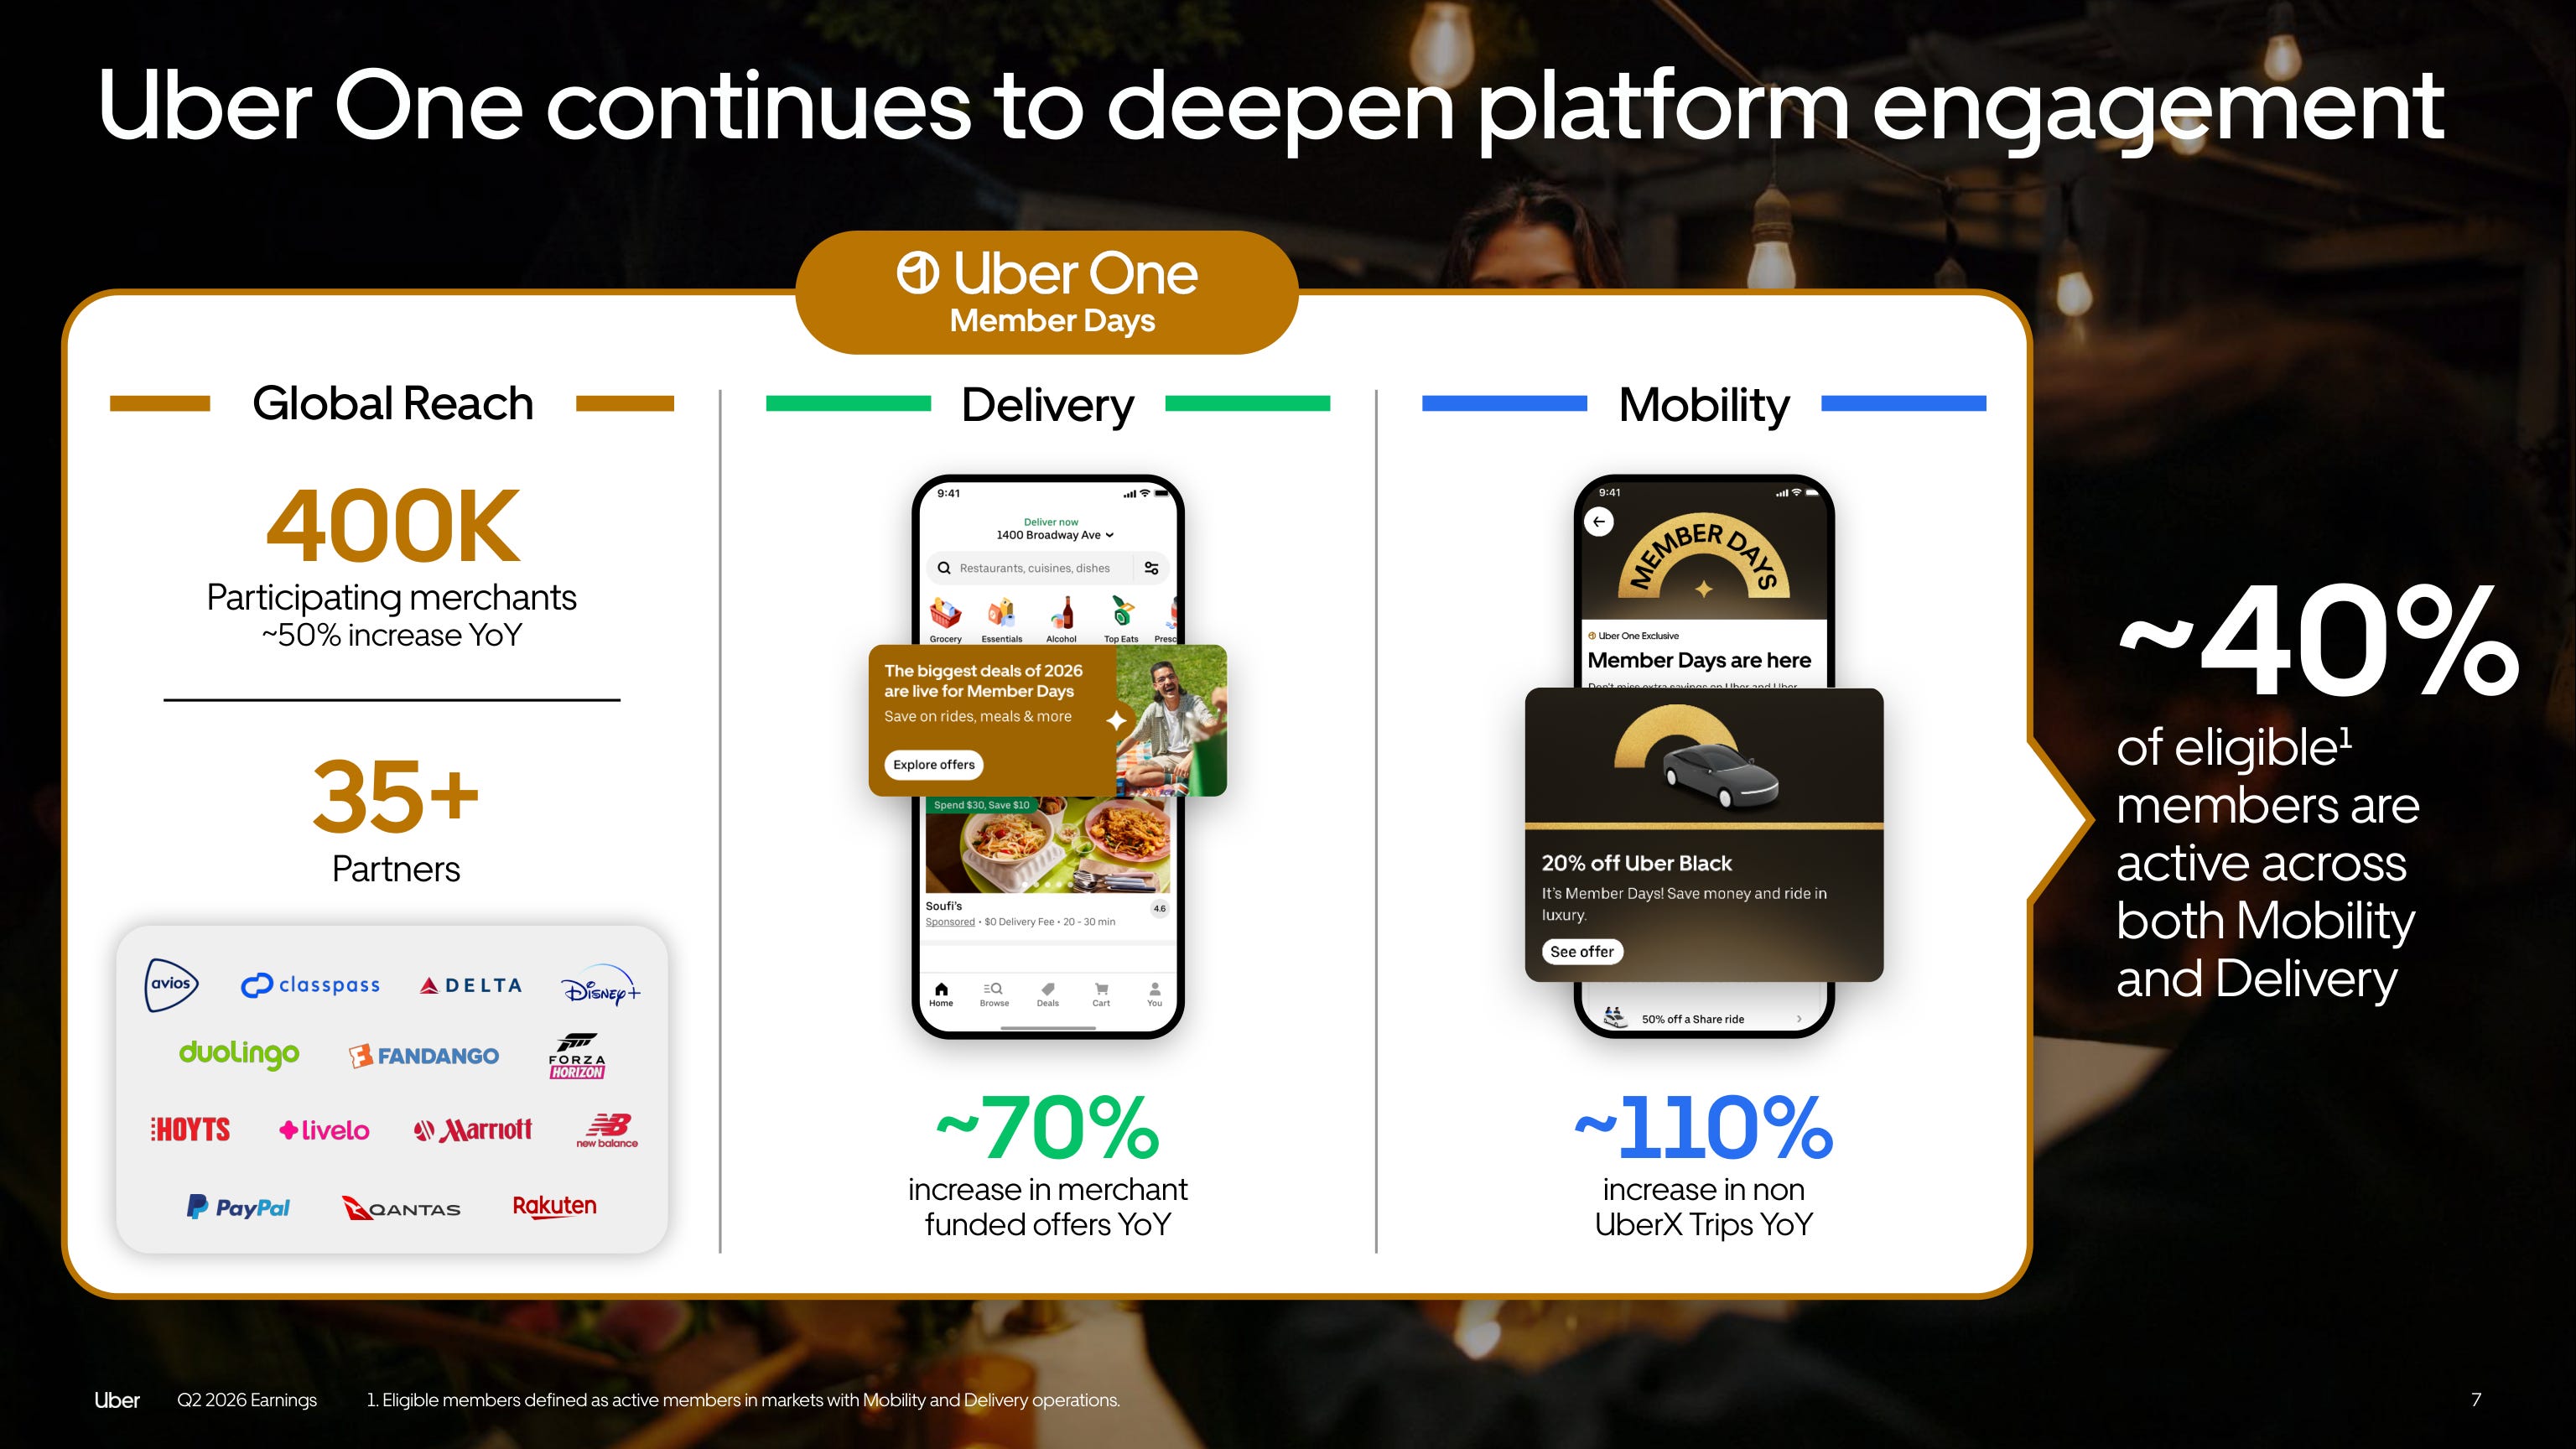
The company is managed by Dara Khosrowshahi (LinkedIn), CEO since 2017. He came from Expedia, took Uber public in 2019, and led the company through the turn from heavy losses to real profitability. The CFO is Balaji Krishnamurthy (LinkedIn). The marketplace behind the leadership grows on both sides: a record 10.2 million drivers and couriers earned over $25B on the platform in Q2, more than 400,000 merchants participate in Uber One offers (+50% YoY), and the membership program is backed by 35+ outside partners, from Delta (DAL) and Marriott (MAR) to PayPal (PYPL) and Disney+ (DIS).
Market Overview
The core question for Uber is what autonomous vehicles (AV) do to a demand aggregator. Everything else about the company is going well, and the market knows it - which is exactly why the stock trades on this one question.
The market itself keeps growing - trips on the platform increased 18% YoY to 3.9 billion in a single quarter, and Uber remains the largest player in both categories it serves. AVs today are still a small share of the market. Waymo (the clear technology leader) has a fraction of a percent of Uber’s quarterly trip count.
Worth noting the geography. Only about 30% of Uber's US gross bookings (and ~25% of its profits) come from the top 20 cities - exactly where robotaxis arrive first. The rest of the volume lives in suburbs, smaller towns, and 70+ countries, where the AV economics do not work yet and will not for years.
The demand side of ride-hailing is not linear - it spikes at 8 a.m. and 5 p.m. A robotaxi fleet has to own enough cars for the peak (and burn capital at noon) or own too few (and lose the customer). Uber’s human drivers flex with the peak. And the company answers the fear with data: in the most mature AV markets (Los Angeles, San Francisco, Phoenix), Uber reports a higher category share than a year ago - both citywide and inside the AV operating zones. So far, robotaxis are growing the category instead of eating the aggregator. In my view, that is why the most likely outcome is not replacement but partnership - the AV companies build the cars, and the aggregator with 208 million users fills them.
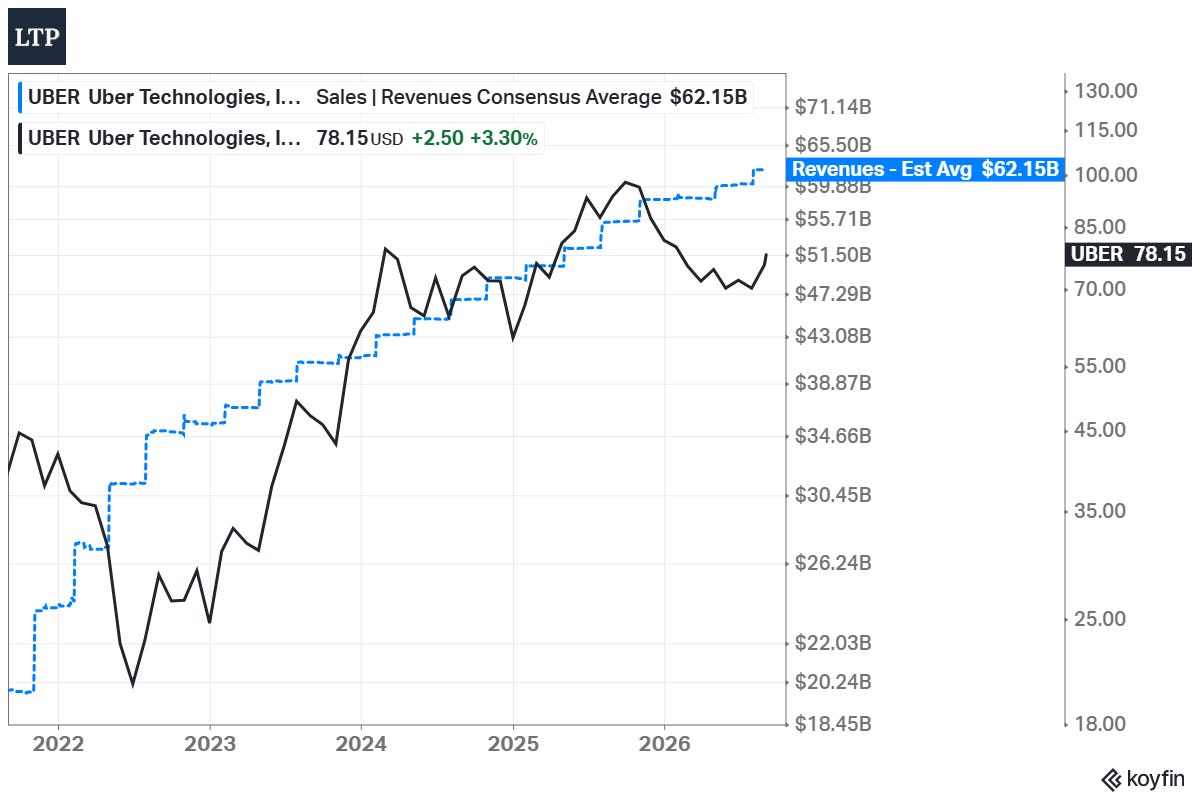
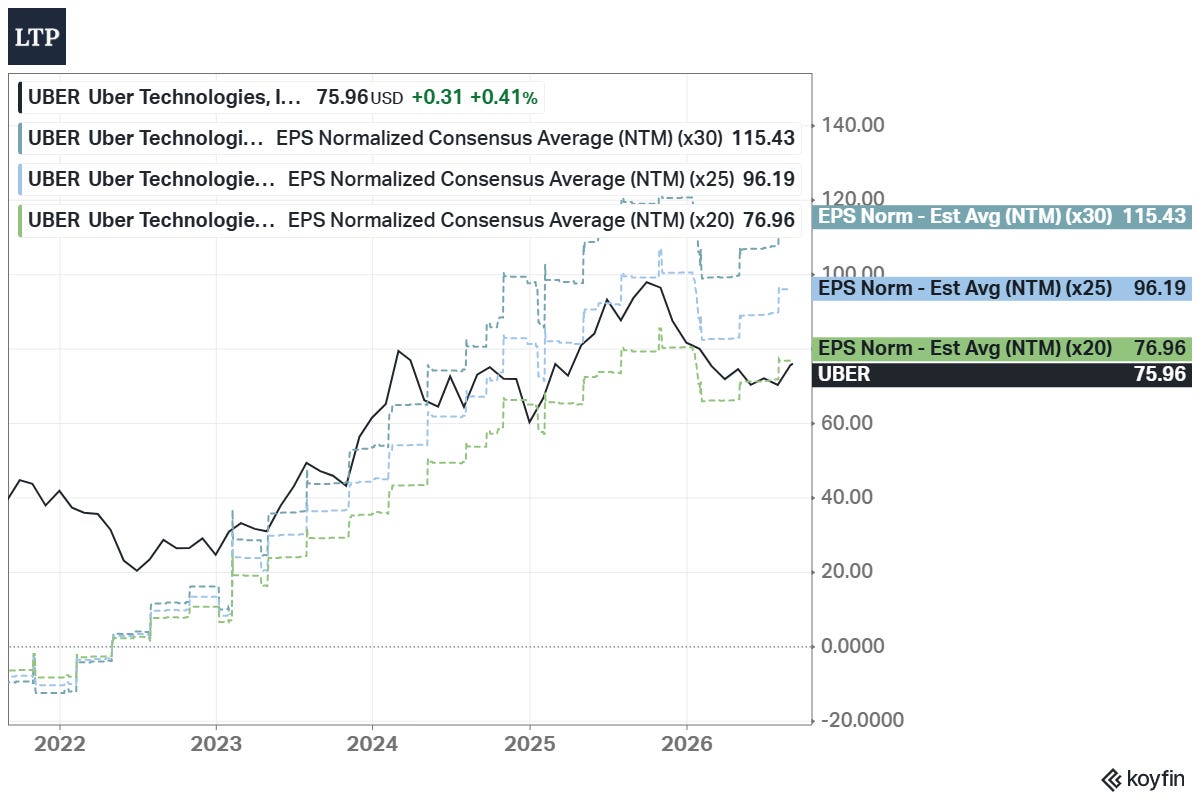
The chart above is the whole situation in one picture: revenue estimates at a record, price 22% below its high. As a result, the bear narrative needs a strong argument to justify the gap.
Economic Moat
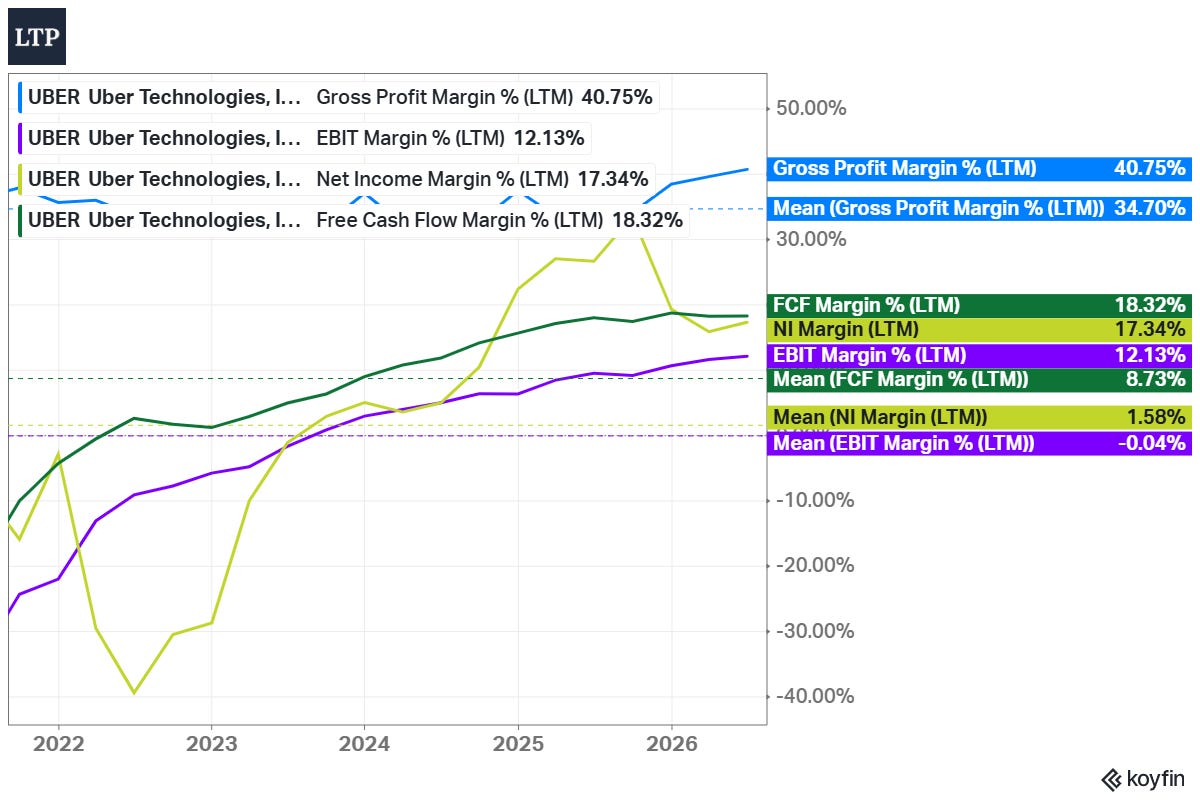
Gross margin is 40.75% against a 34.7% mean, the FCF margin is 18.32% against an 8.73% mean, and the operating margin went from deeply negative to 12.13%. The one line that fell is the net income margin - it spiked above 30% in 2025, when the one-time 2024 tax benefit was inside the trailing window, and normalized to 17.34% as the benefit rolled off. The company that lost 40 cents per revenue dollar in 2022 now keeps 17 cents of it as net income.
The moat is the network effect, and it can be measured. Uber has 208 million monthly users, and they take 18-19 trips per quarter on average. To compare, DoorDash (DASH) gets 12-15 orders per user and Lyft (LYFT) gets 8-9 rides over the same period. Uber has also averaged ~15% user growth since 2022 against ~10% at Lyft - and this despite the fact that Uber’s base is several times larger. More riders attract more drivers, more drivers cut wait times, shorter waits attract more riders. Every trip provides data for the pricing and matching algorithms, so the marketplace gets better as it gets bigger. That is the flywheel.
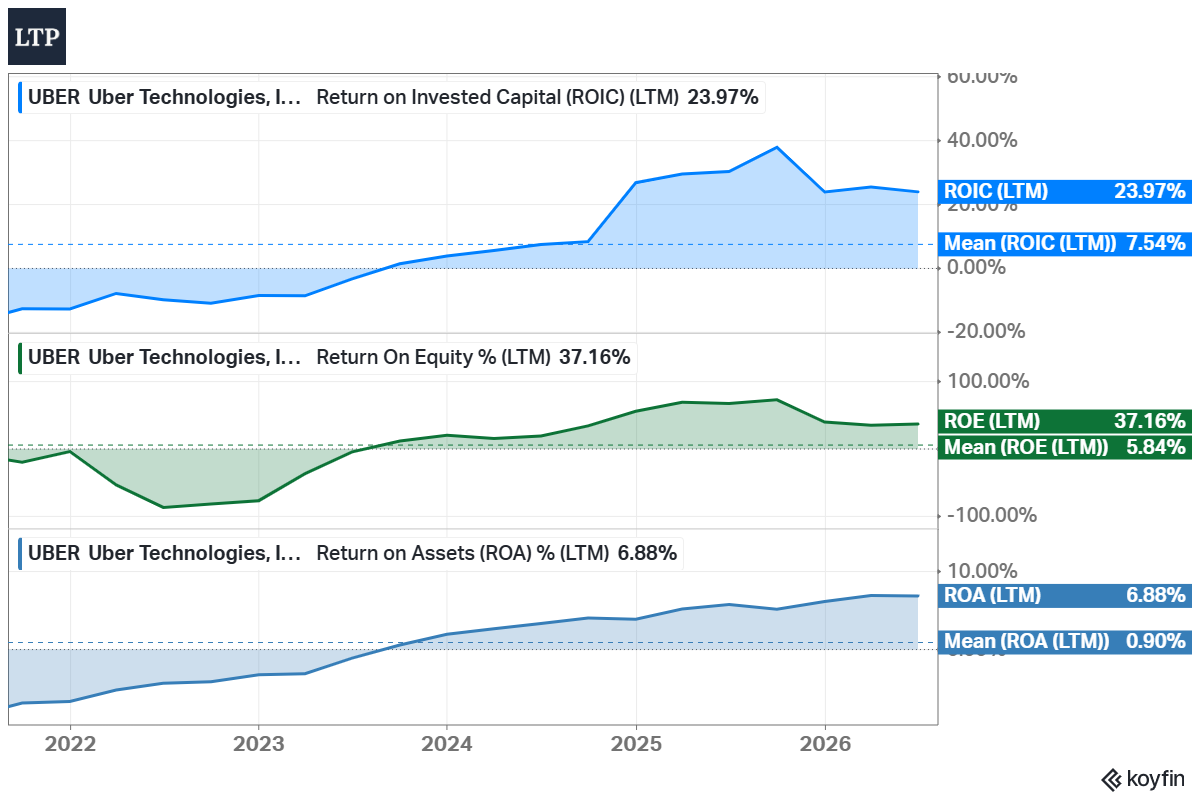
The returns confirm it. ROIC went from deeply negative to 23.97%, ROE to 37.16%, ROA to 6.88%. A marketplace at scale is a very good business.

Business Strategy
Mobility and Delivery share one subscription, one map, and one payment method. Uber One membership is at a record; members order more often, and ~40% of eligible members are active across both Mobility and Delivery - the subscription is the switching cost for this business. Advertising grows on top of the order flow as an almost pure-margin layer.
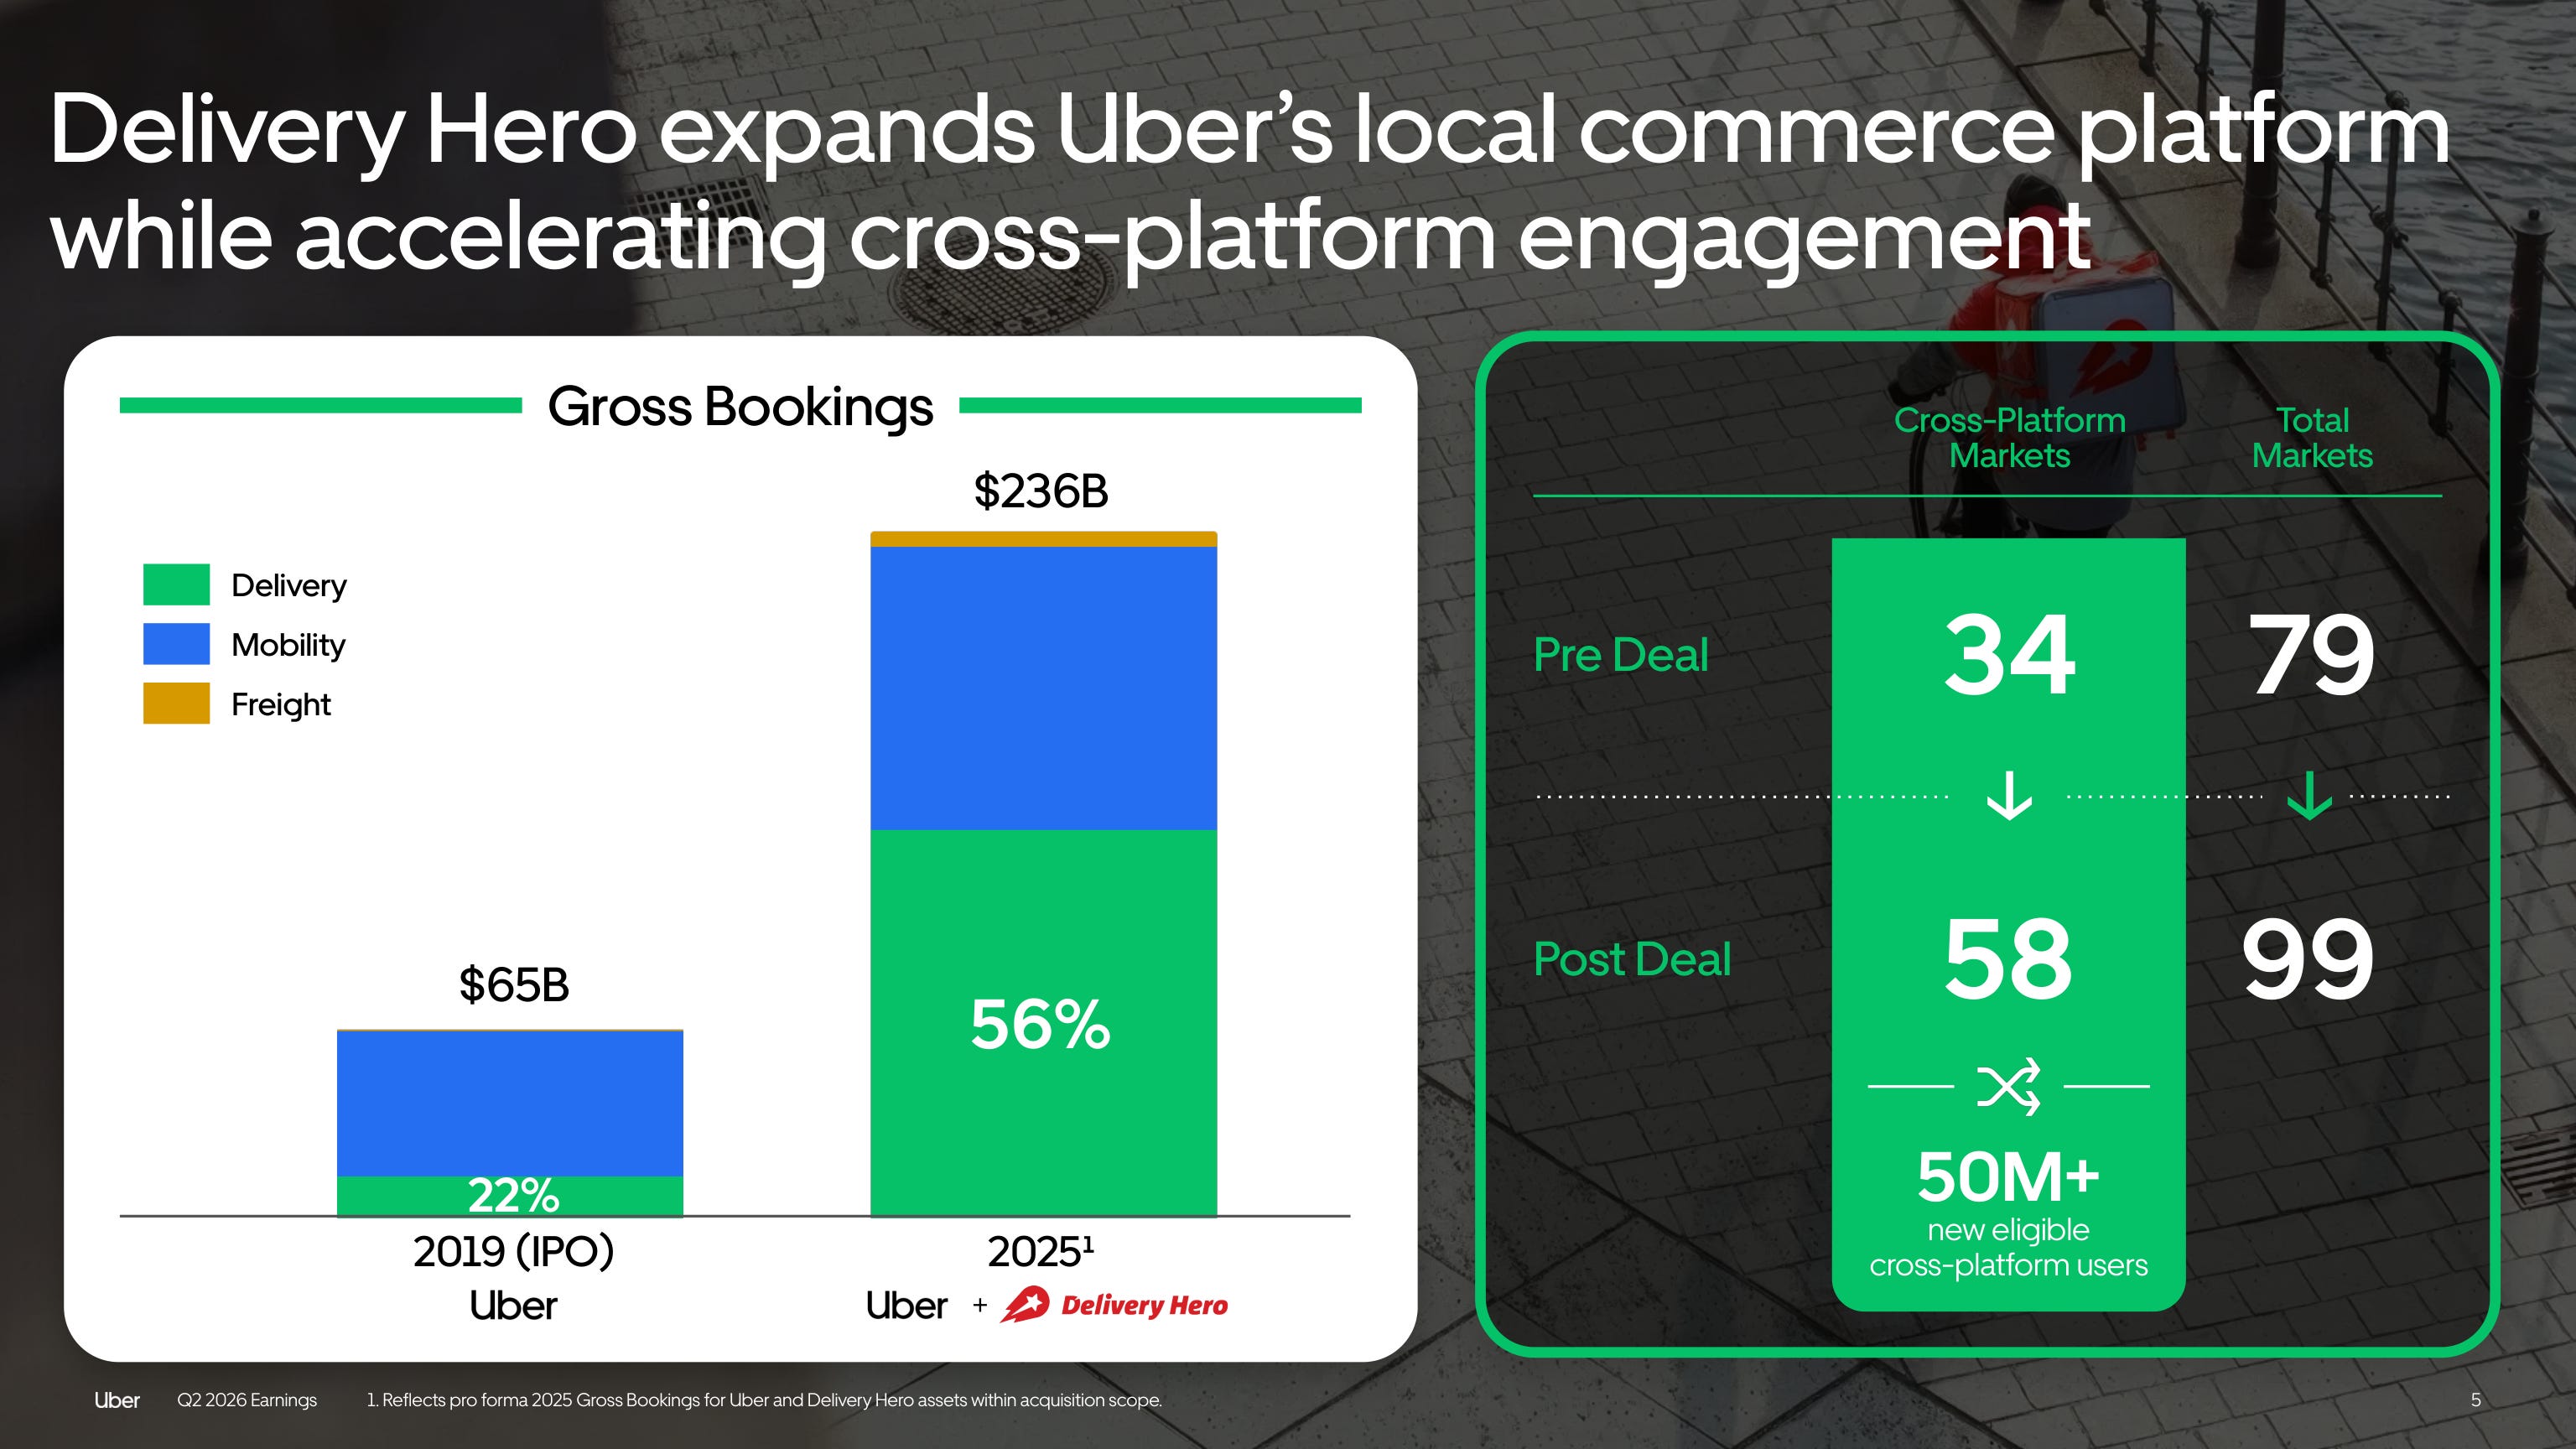
The largest deal in company history. Uber agreed to acquire Delivery Hero (DHER), which expands the platform to nearly 100 markets and almost doubles the number of markets where Uber offers both rides and delivery - from 34 to 58. The company counts 50 million+ newly eligible cross-platform users, and Uber One extends to all of them.
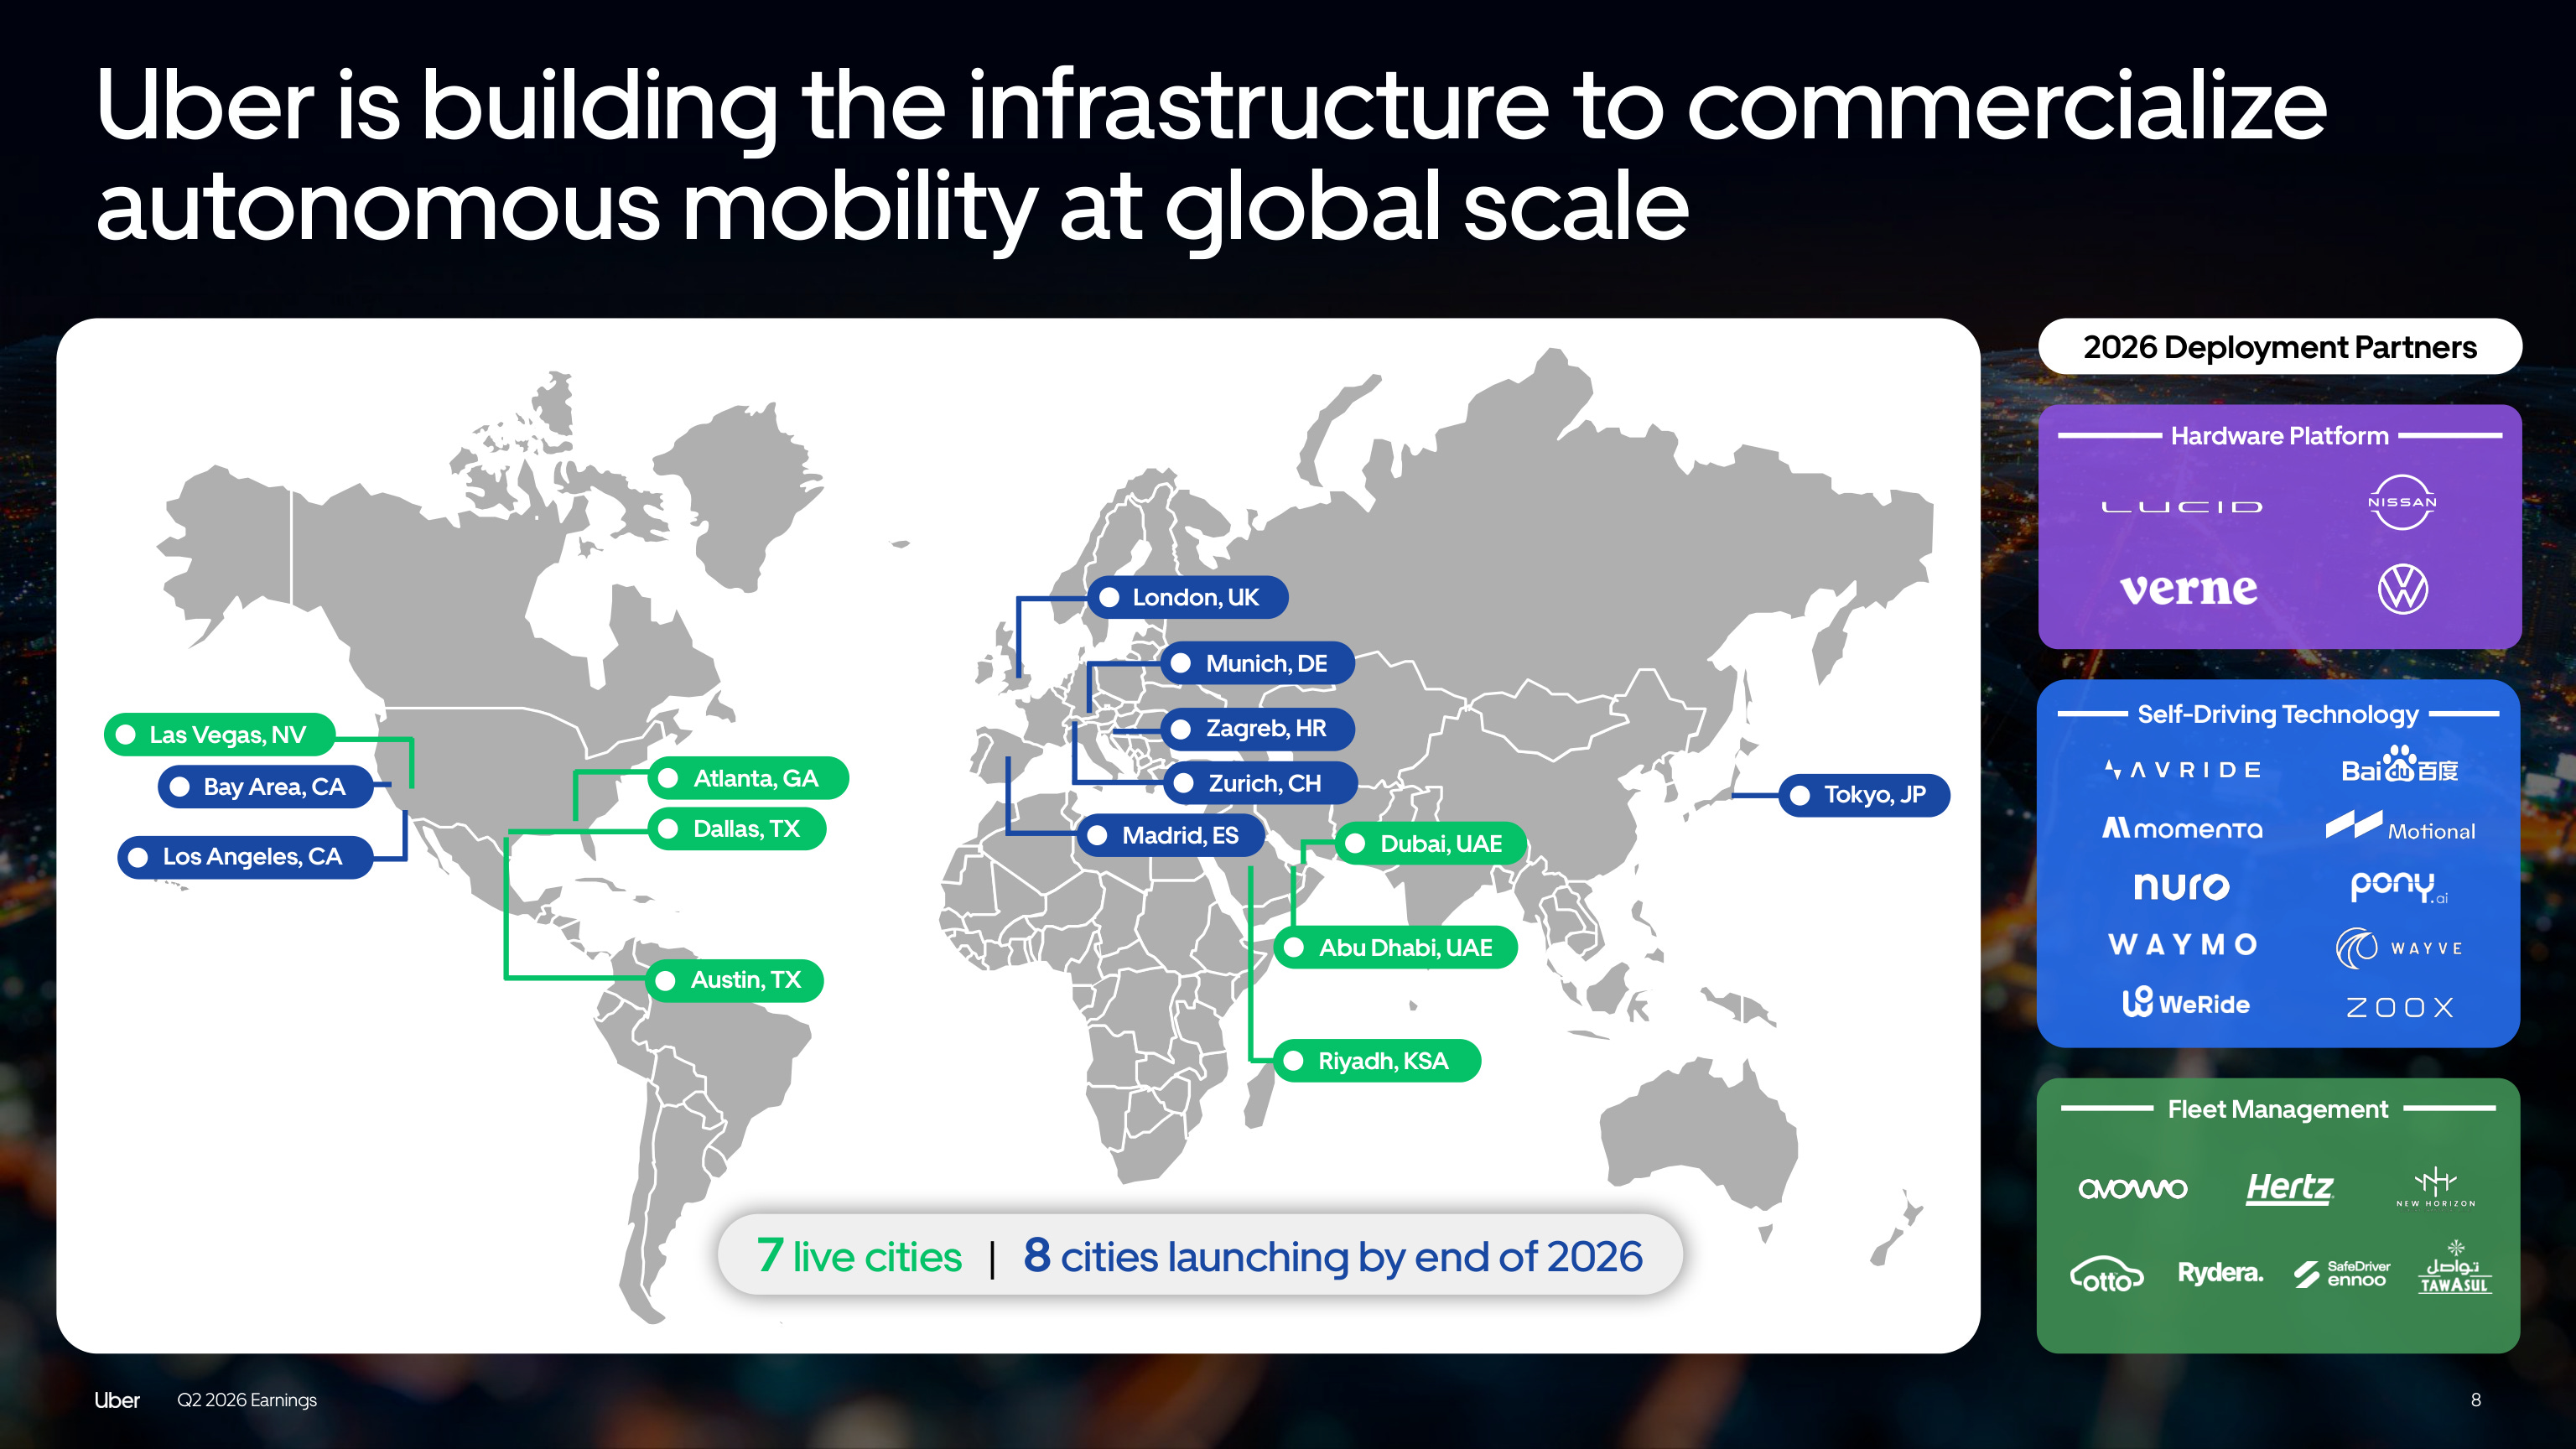
Commercialize everyone's cars, build none. Uber sold its own autonomous unit to Aurora in 2020 (keeping ~25%), and its stated ambition now is to be the commercialization platform for autonomous mobility. The numbers behind the words: AVs are already live on Uber in 7 cities, with a target of up to 15 by year-end, and partners have committed ~120,000 vehicles to the network. The 2026 deployment roster counts more than 20 companies: Waymo, Wayve, Nuro, Zoox, WeRide, and Pony.ai on the self-driving side, with carmakers and fleet operators around them. Wayve's cars received London licenses in August and launched supervised rides in the UK in early September. The logic is simple: if many AV makers compete, the aggregator picks the terms. So Uber works to make sure many compete, including through an AV Labs team that collects millions of miles of driving data each month for its partners.
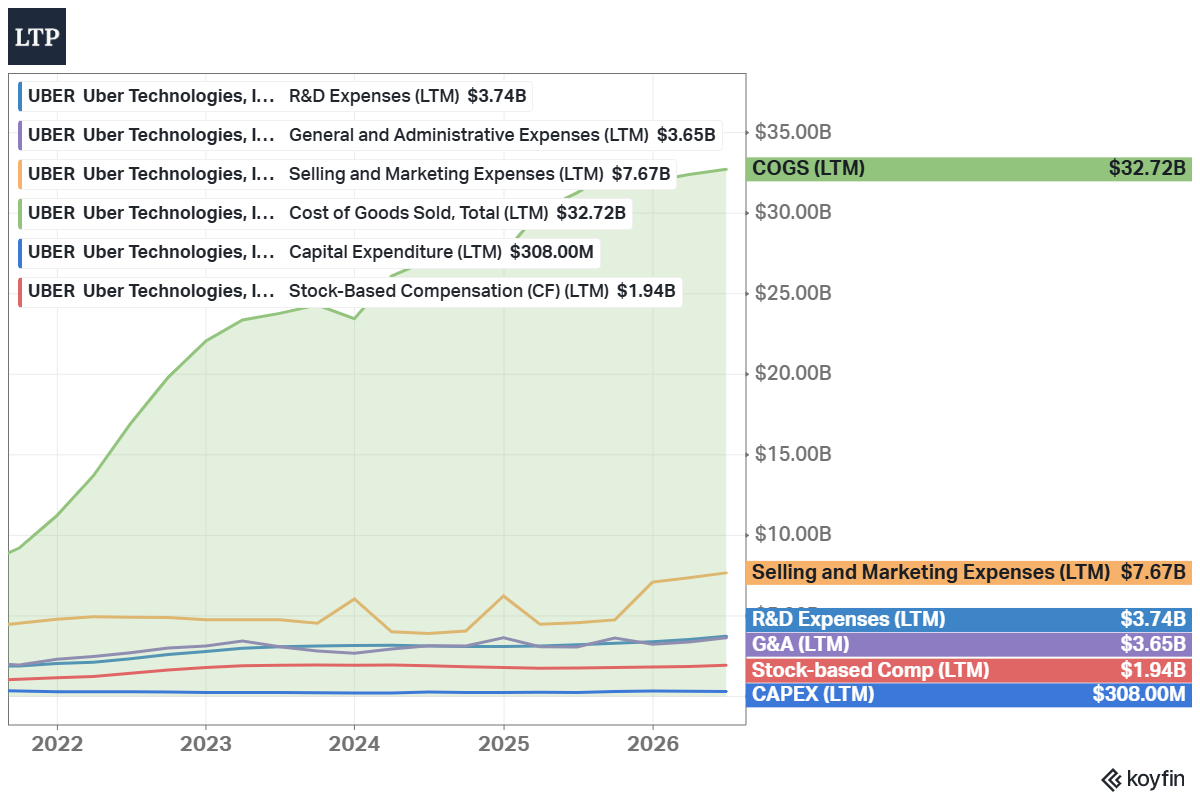
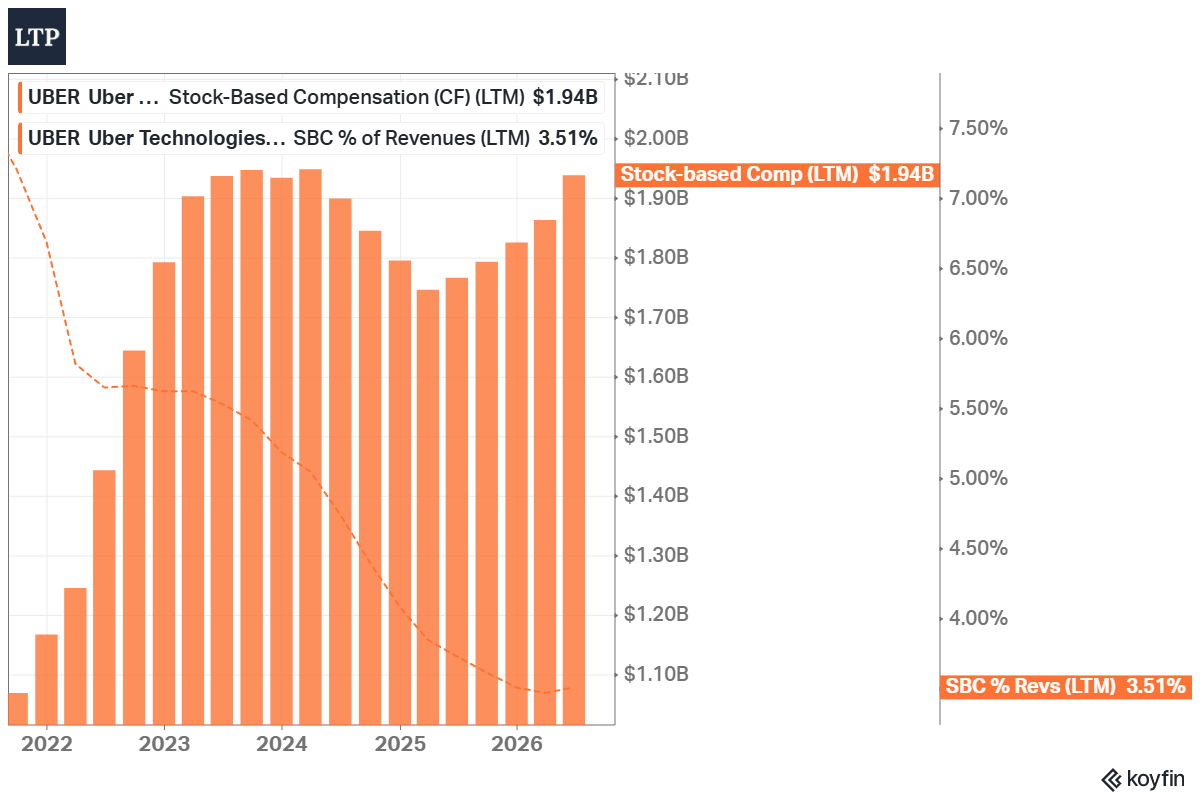
Cost discipline. Sales and marketing falls as a share of revenue year after year. Stock-based compensation fell from over 7% of revenue in 2022 to 3.5%. Capital expenditure is $308M on $55B of revenue - the company owns software, not cars. And on Sep 02, Uber announced 3,300 job cuts (10% of the workforce, the largest reduction since the pandemic) and a 20% reduction in managers. The company states the goal is fewer management layers and more resources for the delivery and AV investments.
Capital Allocation
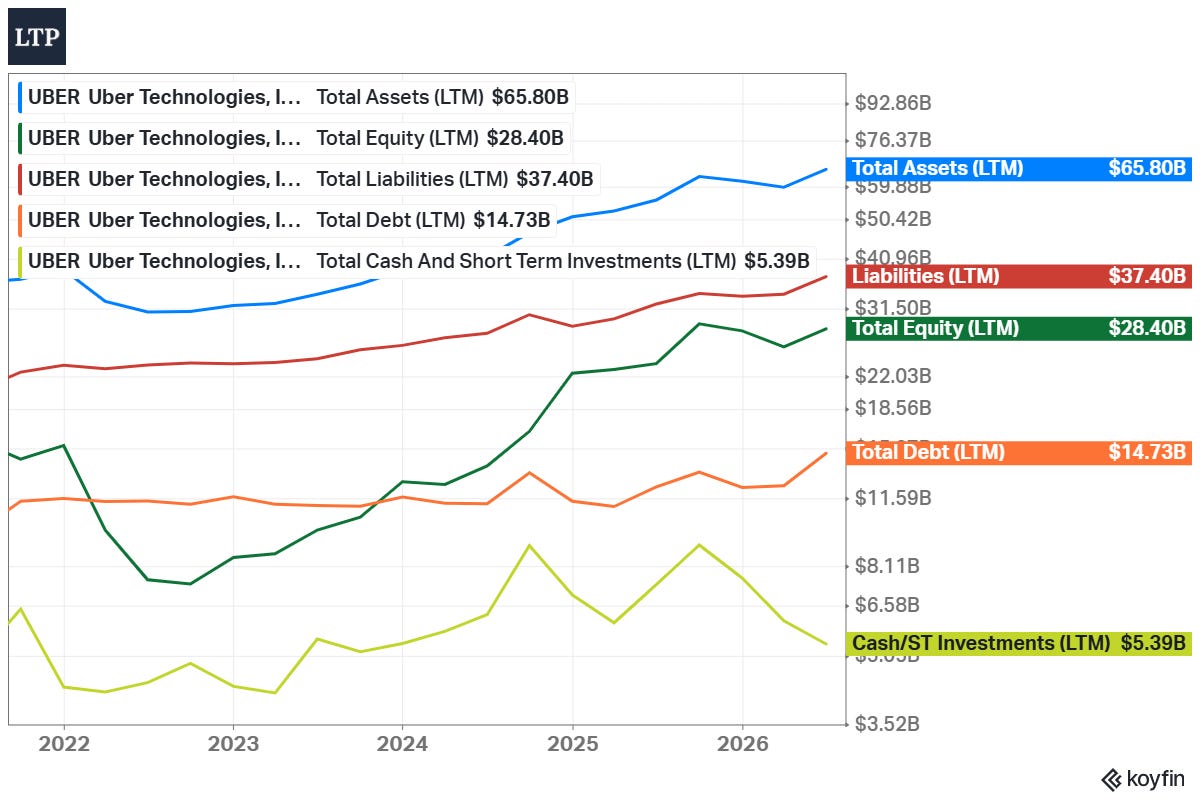
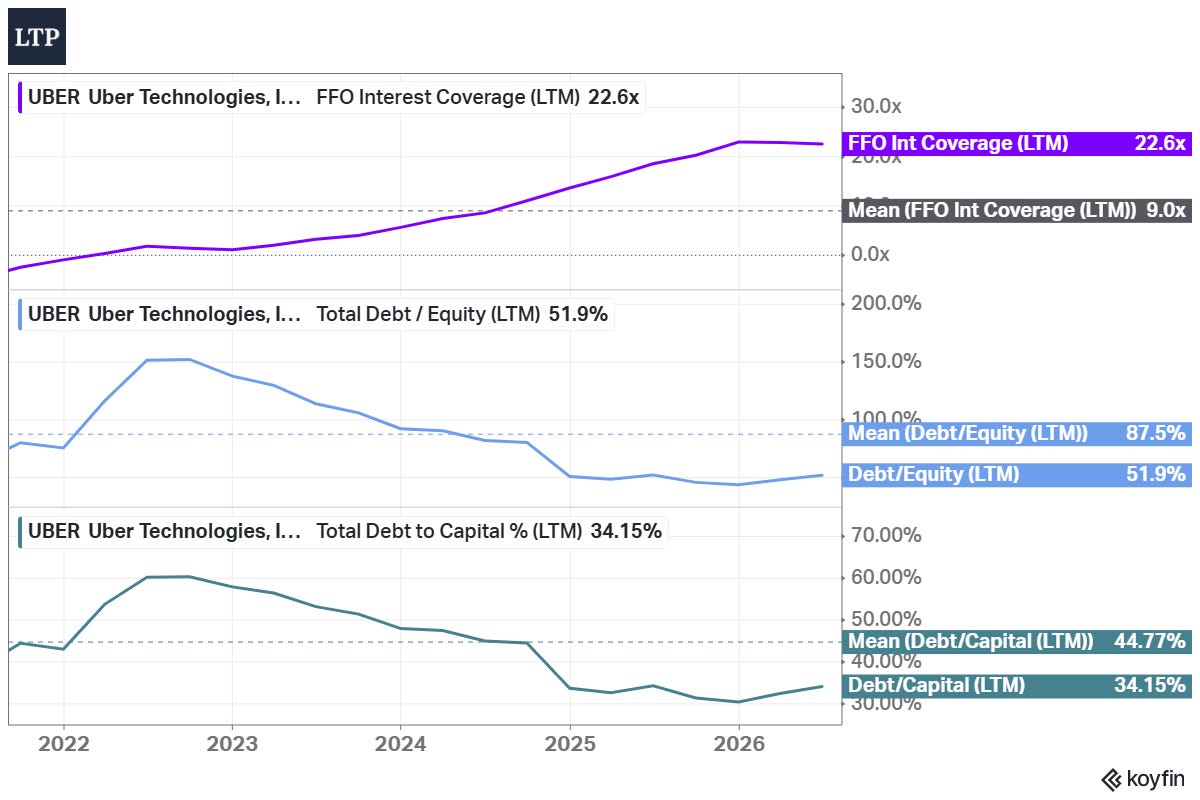
The balance sheet is solid but not excellent. Total debt is $14.7B against $5.4B of cash; Uber has a net debt position of ~$9.3B. The trend is what matters: Debt/Equity fell to 0.52 against a 0.88 historical mean, Debt/Capital is 0.34, and FFO covers interest 22.6x against a 9.0x mean. Worth noting that the debt edged up over the last year - the balance sheet improvement comes from earnings, not from repayment.
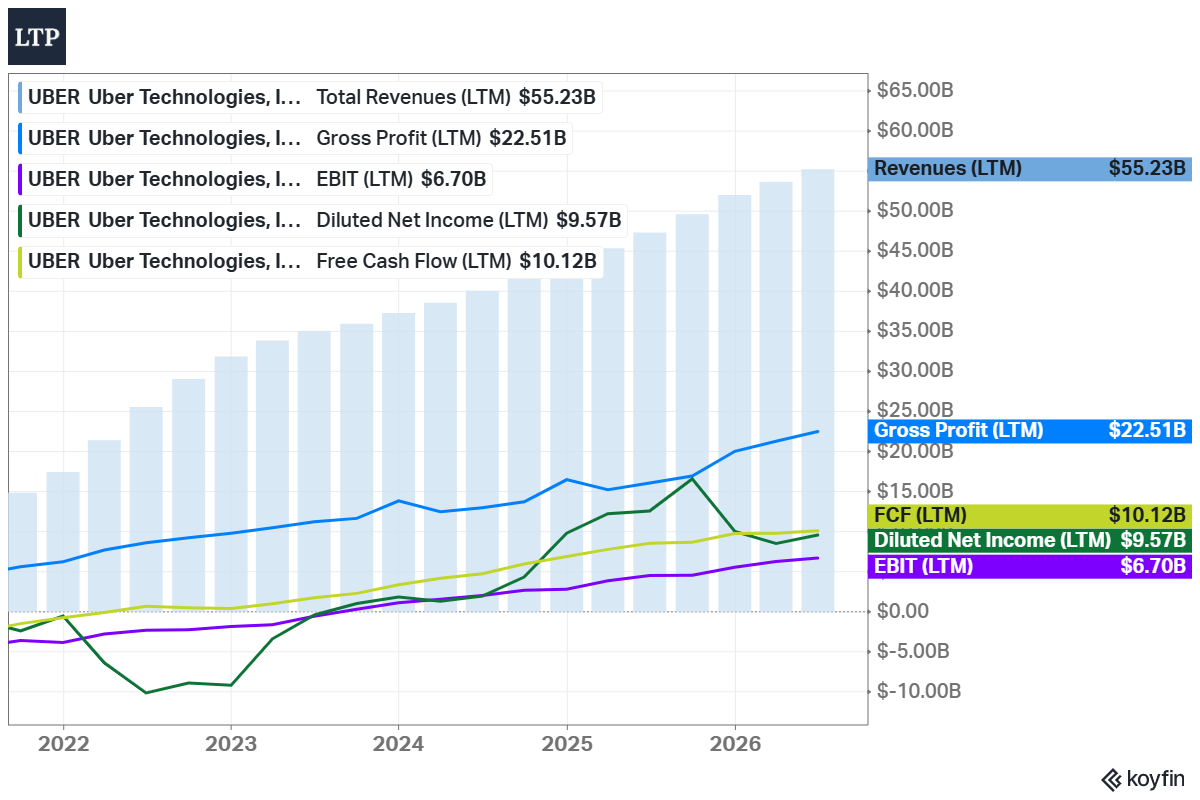
Free cash flow is the story of the decade for this company - from a trailing burn of more than $1B in early 2022 to $10B over the last 12 months. Capex is minimal, so operating cash and free cash are almost the same number.
There is no dividend. Instead, Uber buys back stock: $510M in Q2 alone, with a stated plan of directing roughly half of free cash flow to repurchases. The diluted share count declined ~4% YoY, and the trailing buyback yield is 4.2%. With SBC down to 3.5% of revenue, the buyback is real: it reduces the count instead of hiding dilution.
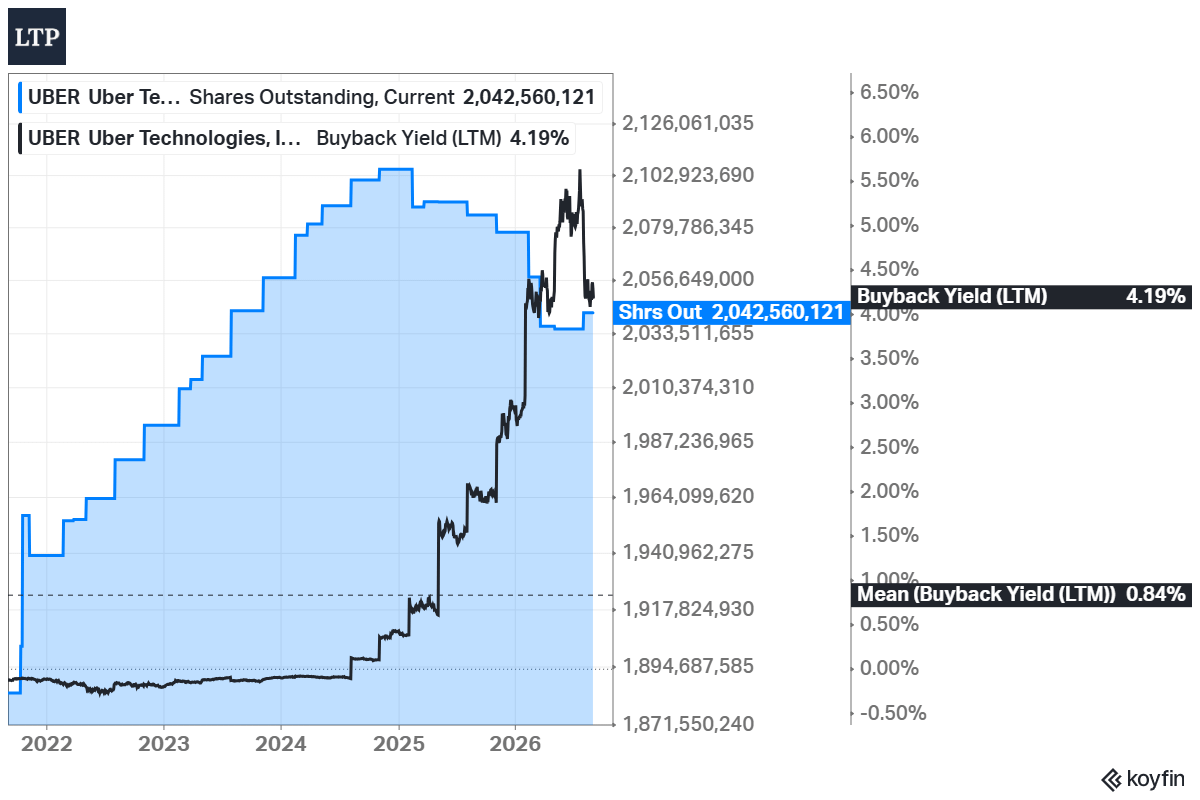
Worth mentioning also the Q2 exception. Buybacks were smaller than usual because ~$4B went into a ~37% economic interest in Delivery Hero - the first step of the full acquisition, with the rest funded through existing liquidity and debt, and closing targeted for the second half of 2027. Management states gross leverage stays below 2x through the deal.
Advantages
The network effect. 200 million users taking 18-19 trips a quarter - the highest engagement in the industry, and it reinforces itself.
Asset-light economics. $308M of capex on $55B of revenue. Uber owns the marketplace, while drivers own the cars.
The cash machine. Trailing FCF passed $10B for the first time, an 18.3% margin, and a buyback that retires 4% of the shares annually.
Diversification. Two large segments plus freight, 70+ countries, and only ~30% of US bookings from the top 20 cities. A robotaxi launch in one place does not touch most of the business.
The data flywheel. Billions of trips provide data for pricing and matching algorithms that competitors cannot replicate at smaller scale - and that AV companies will need.
Disadvantages
The AV question. Waymo and Tesla can build their own demand apps and bypass the aggregator. The Waymo relationship is already cooling: the exclusive partnerships in Austin and Atlanta expire in the first half of 2028, and the two companies lobby for opposite regulatory frameworks.
Regulation. The business model depends on drivers being contractors, not employees. California’s Proposition 22 went Uber’s way, but there are many jurisdictions, and one unfavorable ruling can reprice the whole cost structure.
GAAP noise. Uber’s stakes in Didi, Grab, and Aurora swing reported earnings every quarter. In Q2 alone, revaluations added a $1.6B pre-tax benefit - GAAP EPS came in at $1.17 against $0.81 Non-GAAP. Trailing EPS of $4.58 is inflated the same way, so I use consensus EPS everywhere in this post.
Low switching costs. A rider with two apps installed pays whoever is cheaper. Uber One softens this, but the platform still has to win on price and wait time every single day.
Ambitions cost money. Uber plans to commit over $10B (equity stakes, infrastructure, and vehicle offtake commitments) to bring AVs to market, and the Delivery Hero acquisition adds debt to the balance sheet on top. Both strain the asset-light story - the company states it is evaluating financing structures with third-party capital providers for the AV deployments.
What the bears get right: if Waymo proves the vertical model in the top places, Uber's pricing power in its densest, most profitable markets erodes first - and the market will not wait for the suburbs to confirm it.
Competitors
The competitor set depends on the segment. In US ride-hailing, it is Lyft; in delivery, it is DoorDash and Instacart (CART); internationally, it is Didi, Grab, and Bolt; in the AV scenario, potentially Waymo and Tesla. I made the comparison in numbers.
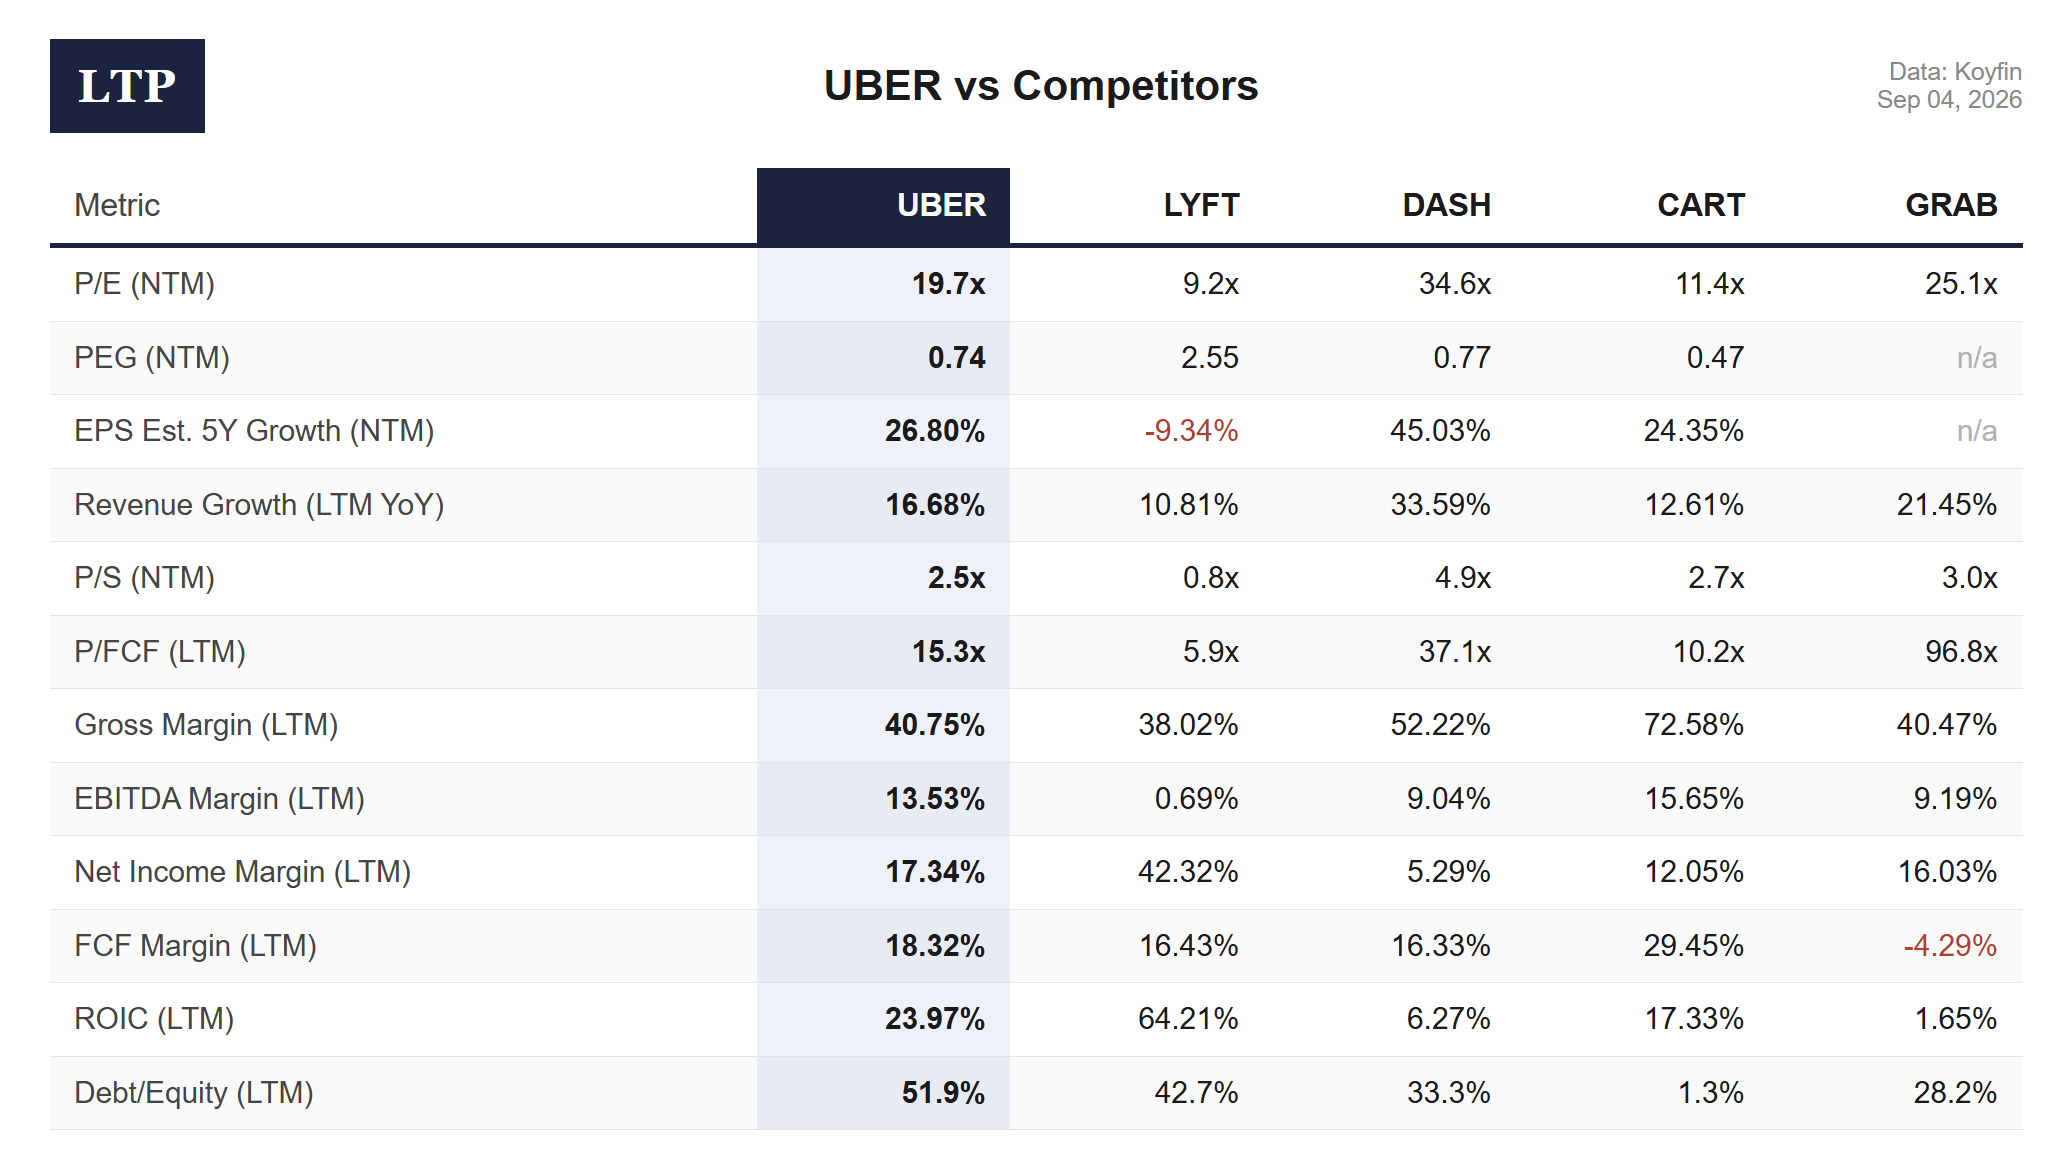
DoorDash is the one real operational rival. Consensus expects 45% EPS growth from DoorDash over the next 5 years against Uber’s 27%, and charges 34.6x forward earnings against Uber’s 19.7x. On PEG, the two are almost identical: 0.77 against 0.74. The difference is what the buyer gets today. Uber trades at 15.3x free cash flow with a 23.97% ROIC; DoorDash trades at 37.1x free cash flow with a 6.27% ROIC. At the same price per unit of growth, Uber is the one that already produces the cash and the returns.
Lyft looks like the cheapest stock in the table. The 9.2x P/E comes with negative expected EPS growth over the next 5 years, and the PEG of 2.55 is the worst in the set - the multiple is low because the earnings are expected to decline. The 42.32% net income margin with a 64.21% ROIC is not operational either - in Q4 2025, Lyft released the valuation allowance on its deferred tax assets and booked a $2.9B one-time benefit. The 0.69% EBITDA margin shows the operating reality. Uber recorded the same kind of benefit in 2024, so I treat both the same way and look at cash instead. On cash, Lyft is genuinely cheap at 5.9x P/FCF, but cheap with declining earnings is a value case, not a growth case.
Instacart is the cheapest per unit of growth. A PEG of 0.47 with a 72.58% gross margin is the best-looking line in the table. But Instacart is a one-category company, and both Uber and DoorDash are pushing into groceries with much larger user bases. The 11.4x multiple prices in the risk that the growth does not survive that competition. Grab is the opposite case - the market pays 3.0x forward sales for Southeast Asian growth with a negative FCF margin and a 1.65% ROIC today. Worth noting that Uber holds equity stakes in both Grab and Didi, so the international competition is partly owned by Uber itself.
In my view, Uber is the only company in the set that combines expected EPS growth above 25%, a ROIC above 20%, and a free cash flow multiple below 20x. DoorDash has the growth without today’s returns, Lyft has the cash without the growth, and Instacart’s discount is the price of competing with the first two. Debt changes nothing here: Debt/Equity ranges from 1.3% at Instacart to 51.9% at Uber, and every company in the table generates positive free cash flow against it.
Past
The last report (Q2 2026) was strong: gross bookings reached a record $58.0B, +24% YoY (+22% in constant currency), once again above the high end of the company’s own outlook. Revenue grew 12% to $14.2B - the gap versus bookings comes from business model changes that cut ~8 points off reported revenue growth. Adjusted EBITDA increased 33% to $2.8B (4.9% of bookings), and Non-GAAP EPS grew 35% to $0.81. The only soft spot was Brazil, the highest-volume market on the platform - a driver shortage in Moto cost ~2 points of global trips growth. The trailing 12 months: revenue $55.2B, net income $9.6B, FCF $10.1B.
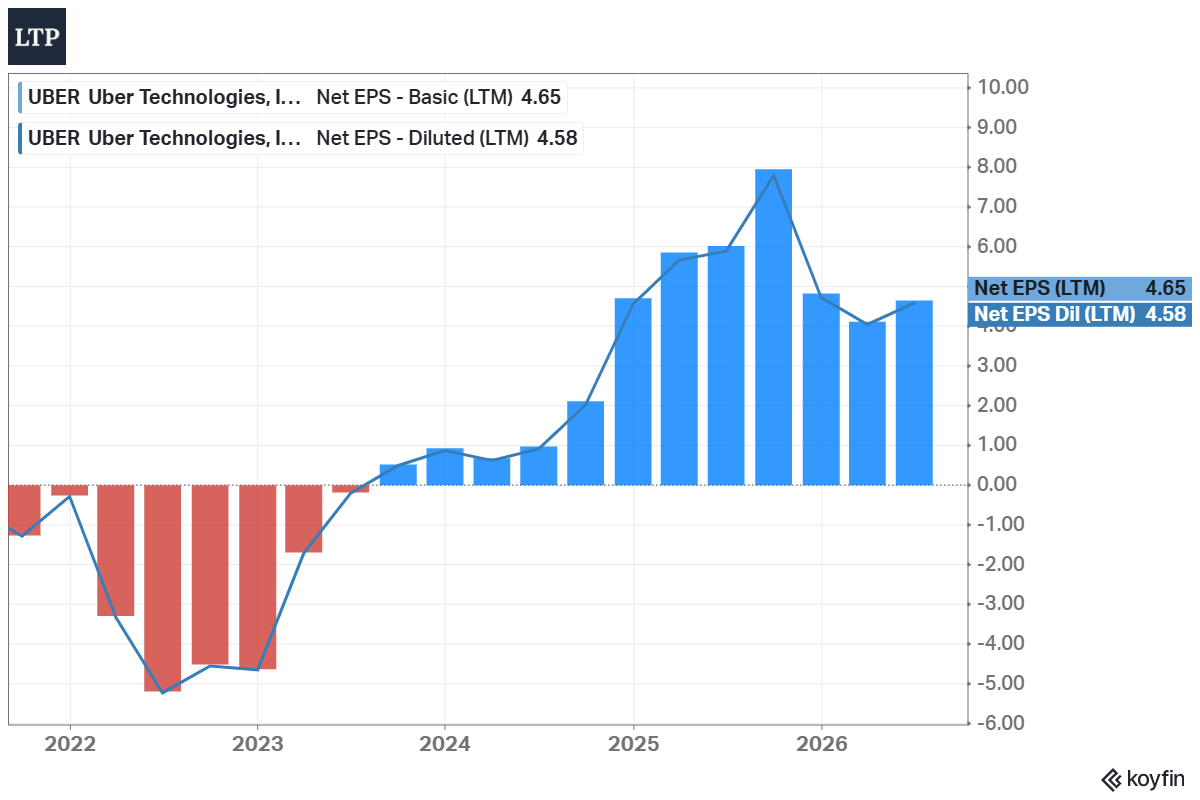
The EPS chart tells the whole 5-year arc: from -$5 in 2022 to +$4.58 today. There is no smoothing in that line - the whole swing happened in about 30 months.
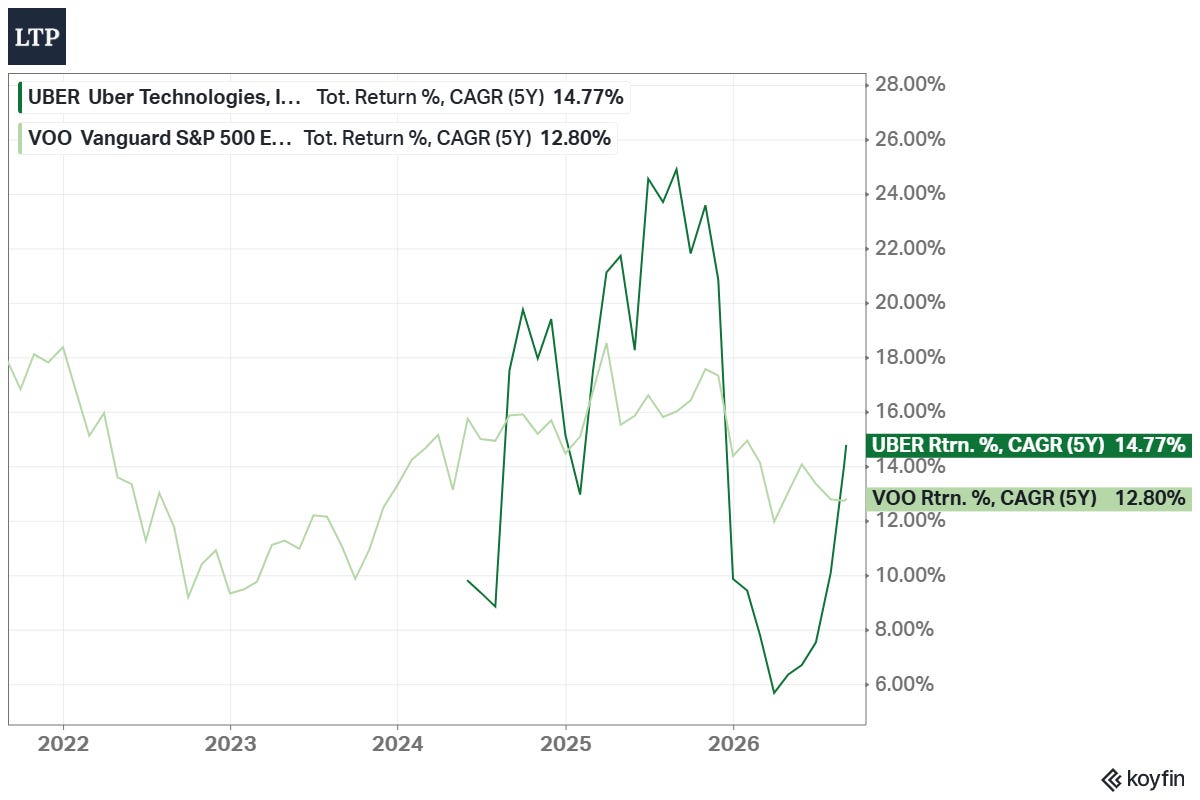
A 14.8% 5Y CAGR against 12.8% for the S&P 500 (VOO) - ahead, but not by what the business did. The last year explains it: -16%, driven not by results but by the AV narrative. The selling started with the February guidance (19% bookings growth at the midpoint - a deceleration) and accelerated on every Waymo headline since. Why did the stock fall on strong numbers? Because the market is not pricing this year. It is pricing the terminal value of an aggregator in a robotaxi world.
Future

Revenue consensus: $57.96B this year (+11.42%), $66.84B in 2027 (+15.32%), $76.22B in 2028 (+14.05%).
EPS consensus: $3.36 -> $4.38 -> $5.46 (+37.34%, +30.2%, +24.56%).
The 5Y forward EPS growth estimate is 26.8%.
Analysts: 51 cover the stock; the average rating is Strong Buy, the average target is $101.81 (range $70-150), which is +34% above the current price.
Company guidance for Q3: gross bookings of $58.25-60.25B (+18-22% constant currency, with ~1 point of currency headwind) and Non-GAAP EPS of $0.84-0.88 (+28-35%), which translates to Adjusted EBITDA of $2.86-2.96B. The midpoint implies a step down from Q2’s pace - that deceleration, not the results, is what the market keeps selling.
Current Valuation
Current vs 5Y mean:
P/E (NTM): 19.7x (mean not usable)
P/S (NTM): 2.5x vs 2.7x
P/FCF (LTM): 15.3x (mean not usable)
P/B (LTM): 5.8x vs 8.7x (at the -1 SD band)
PEG (NTM): 0.74 vs 0.72
EV/EBITDA (NTM): 13.0x
Analyst’s note:
Uber’s 5Y valuation means are mostly unusable. The company was unprofitable until 2023, so the P/E “mean” of 41x and the P/FCF mean of 50x average in the loss-making years - I do not use them anywhere in my model. And I use the forward P/E, not the trailing 17x: trailing GAAP earnings include revaluations of the Didi, Grab, and Aurora stakes, so the consensus $3.36 for this year is the honest denominator. The metrics that survive the history check: P/S, P/B, and PEG.
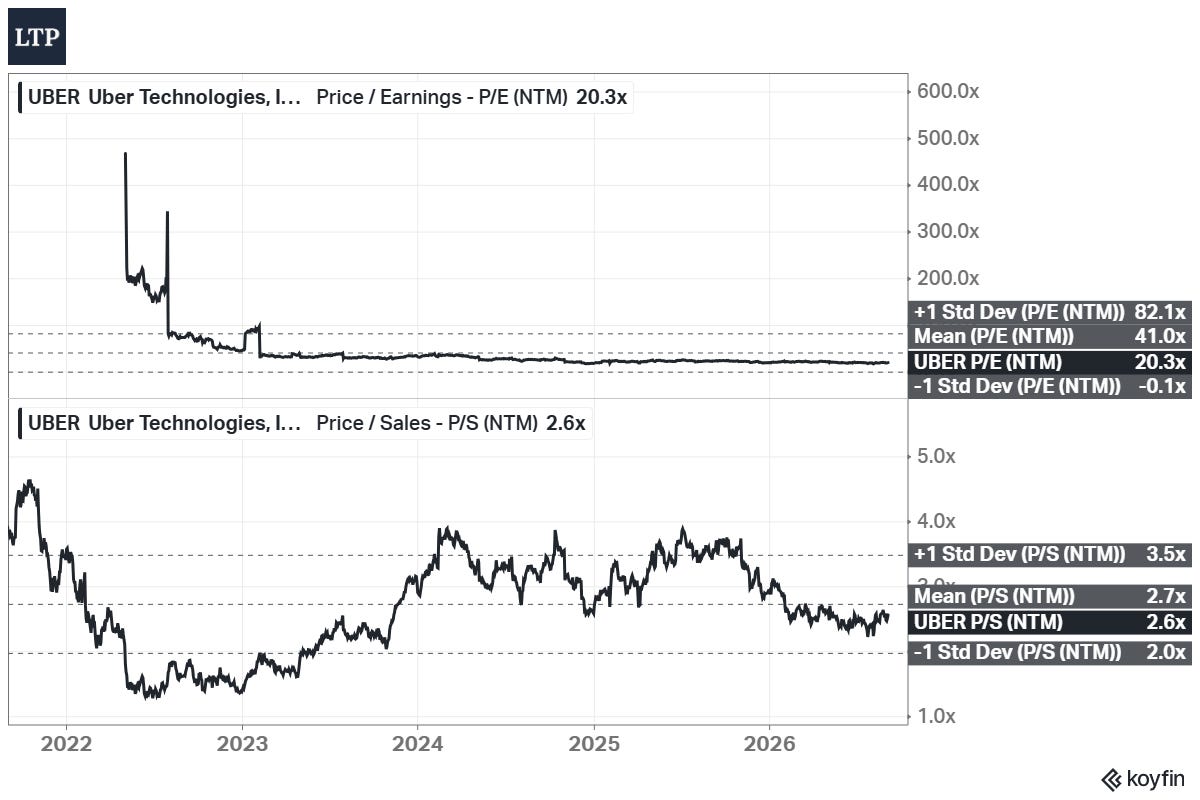
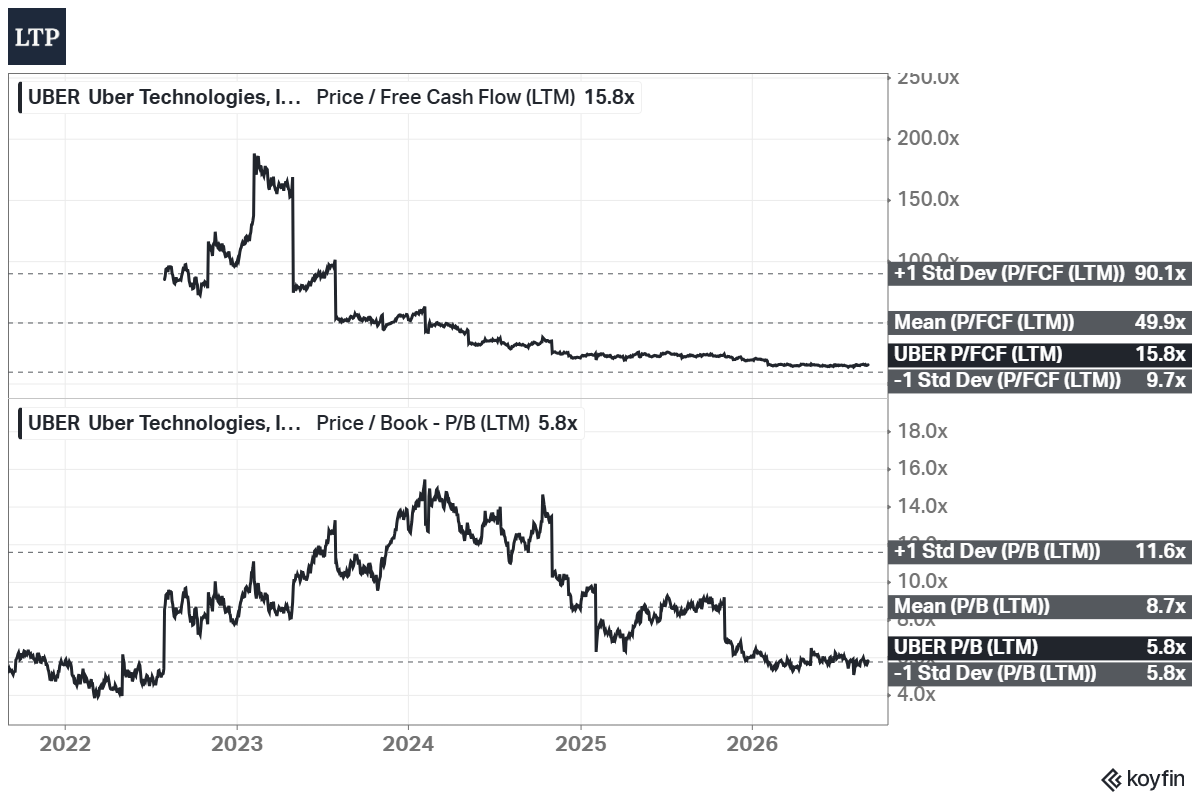
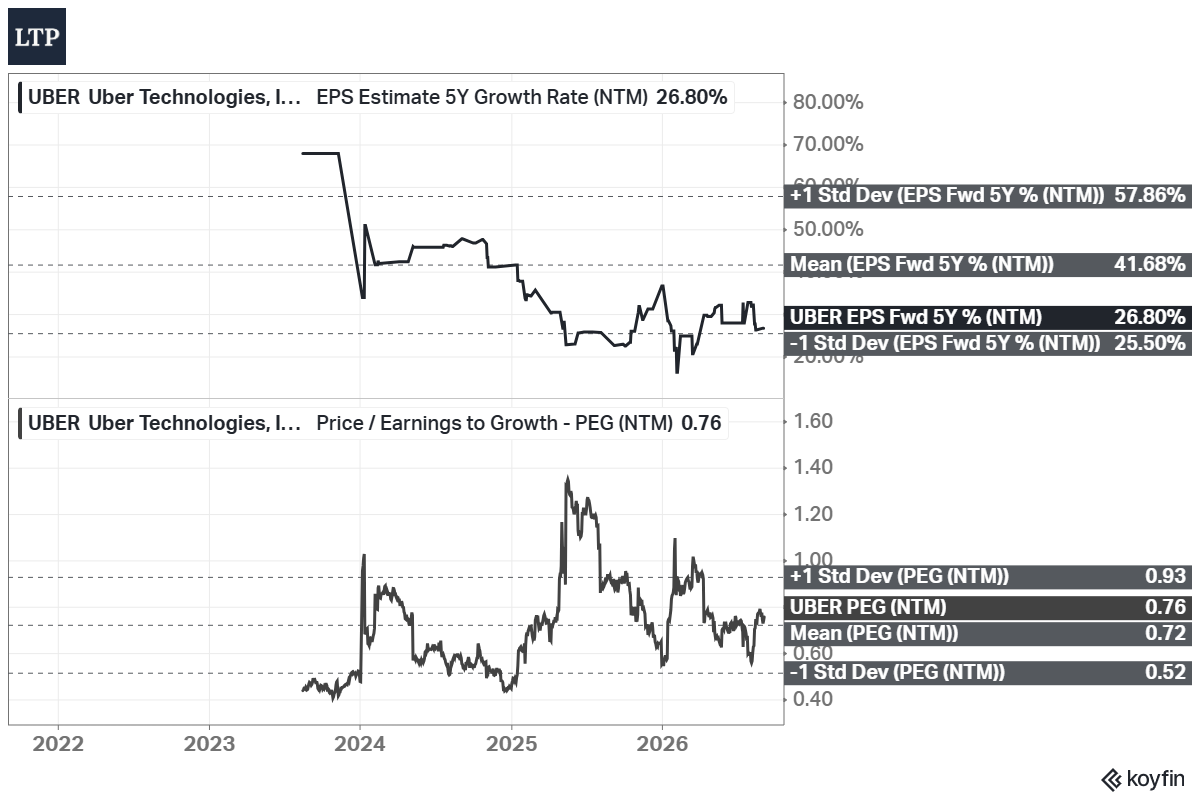
The readable metrics agree with each other: P/S slightly below its mean, P/B exactly at its -1 standard deviation band, PEG at 0.74. For a company growing bookings 24%, none of that reads expensive.
One chart frames this whole section:
Fair Price
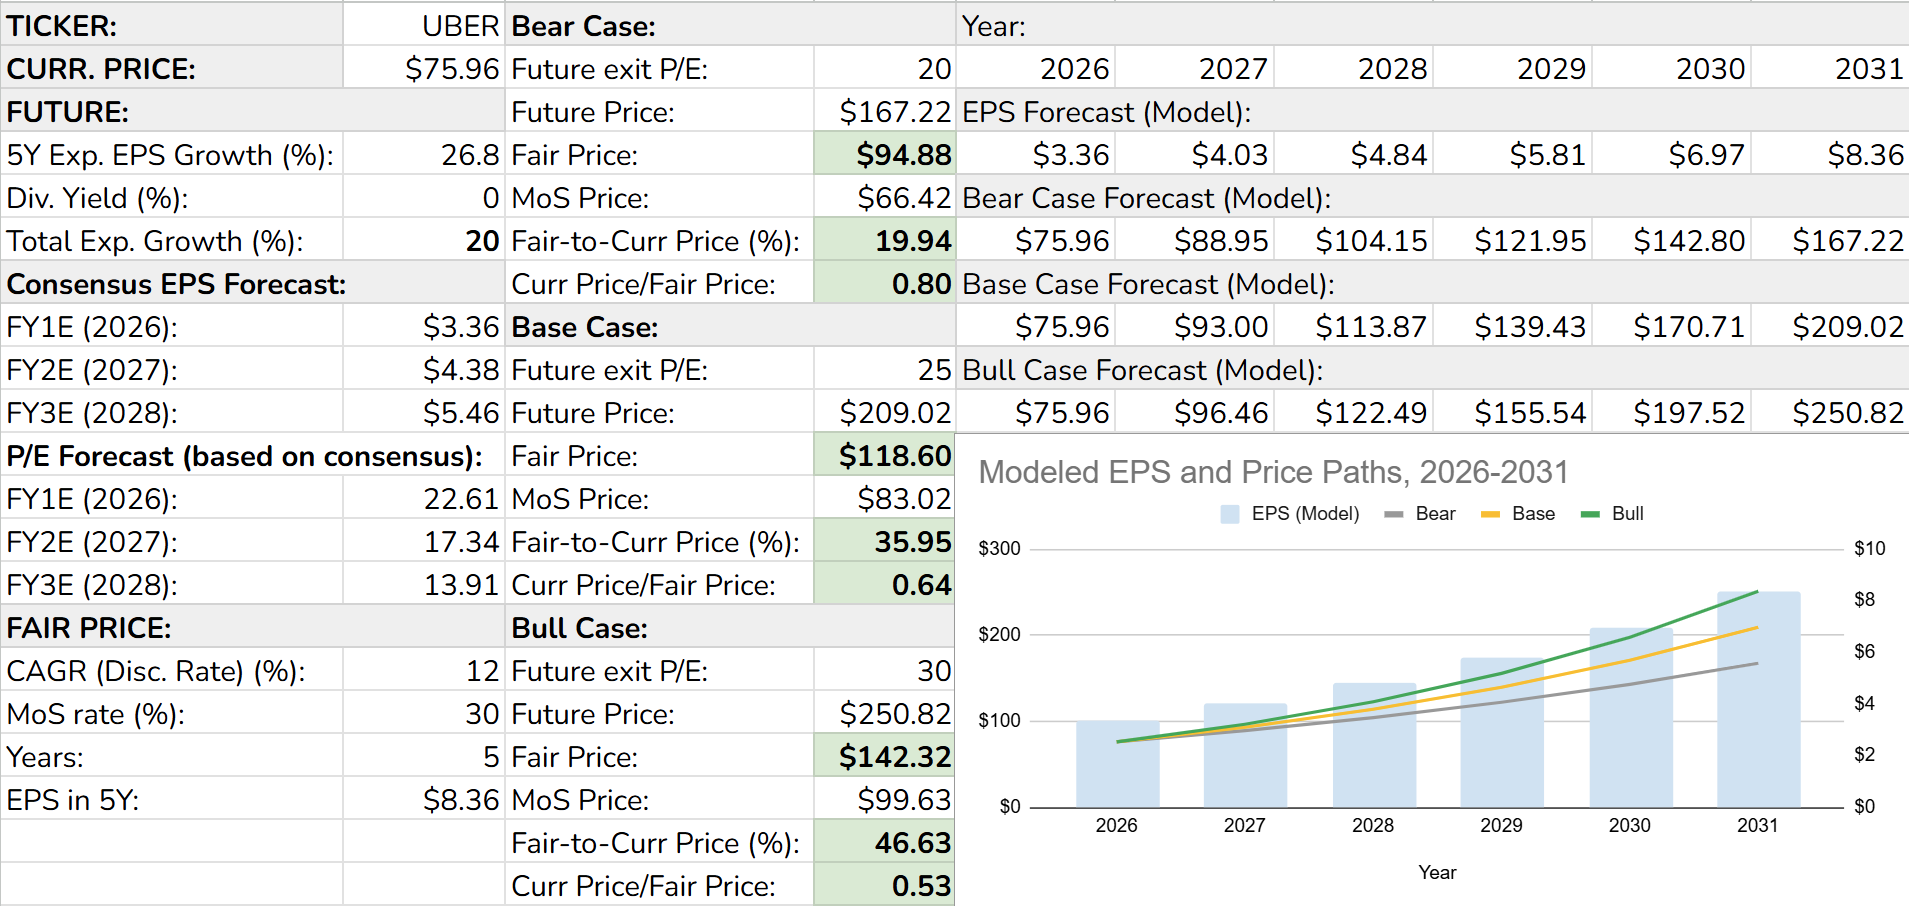
The model takes the consensus EPS for this year ($3.36) and grows it for 5 years. Consensus says 26.8% a year, but my model caps growth at 20% (the cap is a rule). The result is multiplied by three exit multiples and discounted back.
The discount rate is 12%; the margin of safety is 30%. The exit multiples are 20x/25x/30x: the Bear Case is today’s multiple (19.7x, rounded to 20x) - a market that never re-rates Uber; the Base Case is 25x - a PEG of 1.25 on my capped growth, since the polluted historical mean gives me nothing to anchor on; the Bull Case is 30x - a PEG of 1.5, the most my own rules allow me to pay for any stock.
Bear Case (exit P/E 20x): fair price: $95; MoS price: $66
Base Case (exit P/E 25x): fair price: $119; MoS price: $83
Bull Case (exit P/E 30x): fair price: $142; MoS price: $100
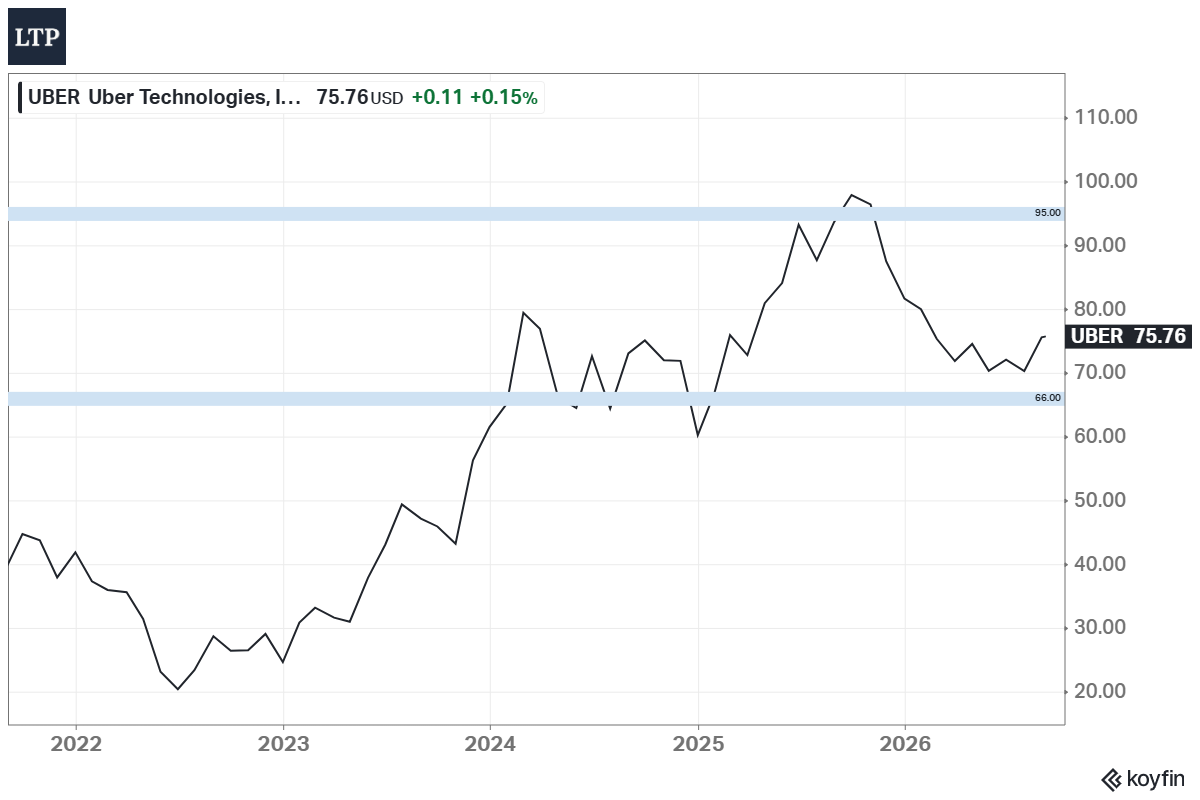
At $76, the stock is 20% below the Bear Case fair price - deep inside the accumulation zone, and below even the Base Case MoS price of $83. To say it plainly, the current quote assumes less than a never-re-rated multiple on a growth rate cut by a quarter.
Verdict: UBER belongs in a long-term portfolio as a large-cap growth holding. The business is the largest ride-hailing and delivery aggregator in the world: 208 million users, an 18% FCF margin, and a buyback of 4% of the shares a year. The stock trades at 19.7x forward earnings with a PEG of 0.74, and P/B is at its -1 standard deviation band. My corridor is $95-142, and the accumulation zone is everything up to the Bear Case fair price of $95; at $76, the price is 20% below it. The realistic bear case here is not a crash but dead money - the multiple stays where it is while every Waymo headline resets the AV debate, and the stock stays cheap until the terminal-value question gets an answer. Buy with a multi-year horizon, and judge the thesis on bookings growth and the FCF margin, not the share price.
Due Diligence
Profitability (11 of 15):
Positive Gross Profit: $22.5B
Positive Operating Income: $6.7B
Positive Net Income: $9.6B
Positive FCF: $10.1B
Gross margin >= 40%: Yes (40.75%)
Net margin >= 10%: Yes (17.34%)
FCF margin >= 10%: Yes (18.32%)
Management (ROIC, ROE, ROA) >= 10%: Mostly (23.97%/37.16%/6.88%)
Strong 3Y Revenue Growth: ~18% per year
Revenue Growth Forecast: ~14% per year over the next 3 years
ROE is increasing: negative in 2022 -> 37.16%
ROIC is increasing: negative in 2022 -> 23.97%
Revenue surprises in the last 5Y in a row: No (2025: -0.05%)
EPS surprises in the last 5Y in a row: No (2025: -11.71%)
EPS growth YoY for the last 5Y in a row: No (losses until 2023)
Financial Strength (4 of 6):
Total assets exceed total liabilities by 1.76x
Negative Net Debt: No ($14.7B of debt against $5.4B of cash)
Low Debt/Equity: 0.52 (historical mean: 0.88)
Debt/Capital: 0.34
Interest coverage (FFO): 22.6x
Piotroski F-Score: 6 of 9 (not passed: Higher ROA yoy, Higher Current Ratio yoy, and Higher Asset Turnover yoy)
Valuation and Advantage (3 of 4):
Valuation < mean: Yes (on the usable metrics: P/S, P/B, PEG)
Valuation < the industry: Mixed (below DASH and GRAB, above LYFT and CART)
Does it have a moat: Yes (narrow, network effects)
Outperformed the S&P 500 over 5Y: Yes (14.8% vs 12.8% CAGR)
Shares (1 of 3):
Insider ownership >= 5%: No (3.95%)
Fewer shares outstanding YoY: Yes (-4%)
Insider buys in the last 6M: No (the CFO bought in February)
Price (4 of 4):
1Y price forecast > 10%: +34% (average target $101.81)
Next 5Y EPS growth estimate (CAGR) > 10%: Yes (26.8%)
DCF Value: undervalued by 12% (86.85)
Short Interest < 5%: Yes (2.3%)
Watchlist Note
The largest ride-hailing and delivery aggregator. 19.7x fwd earnings, PEG 0.74, P/B at -1SD; 5Y means unusable (losses until 2023). Consensus +27%/yr, model capped at 20% -> fair value $95/$119/$142, zone up to $95 - price deep inside, below Base MoS $83. Watch: bookings growth >= 20%, FCF margin >= 15%, Waymo/AV headlines, gig-worker rulings. Next report: Nov 03 (estimated).
One-Pager
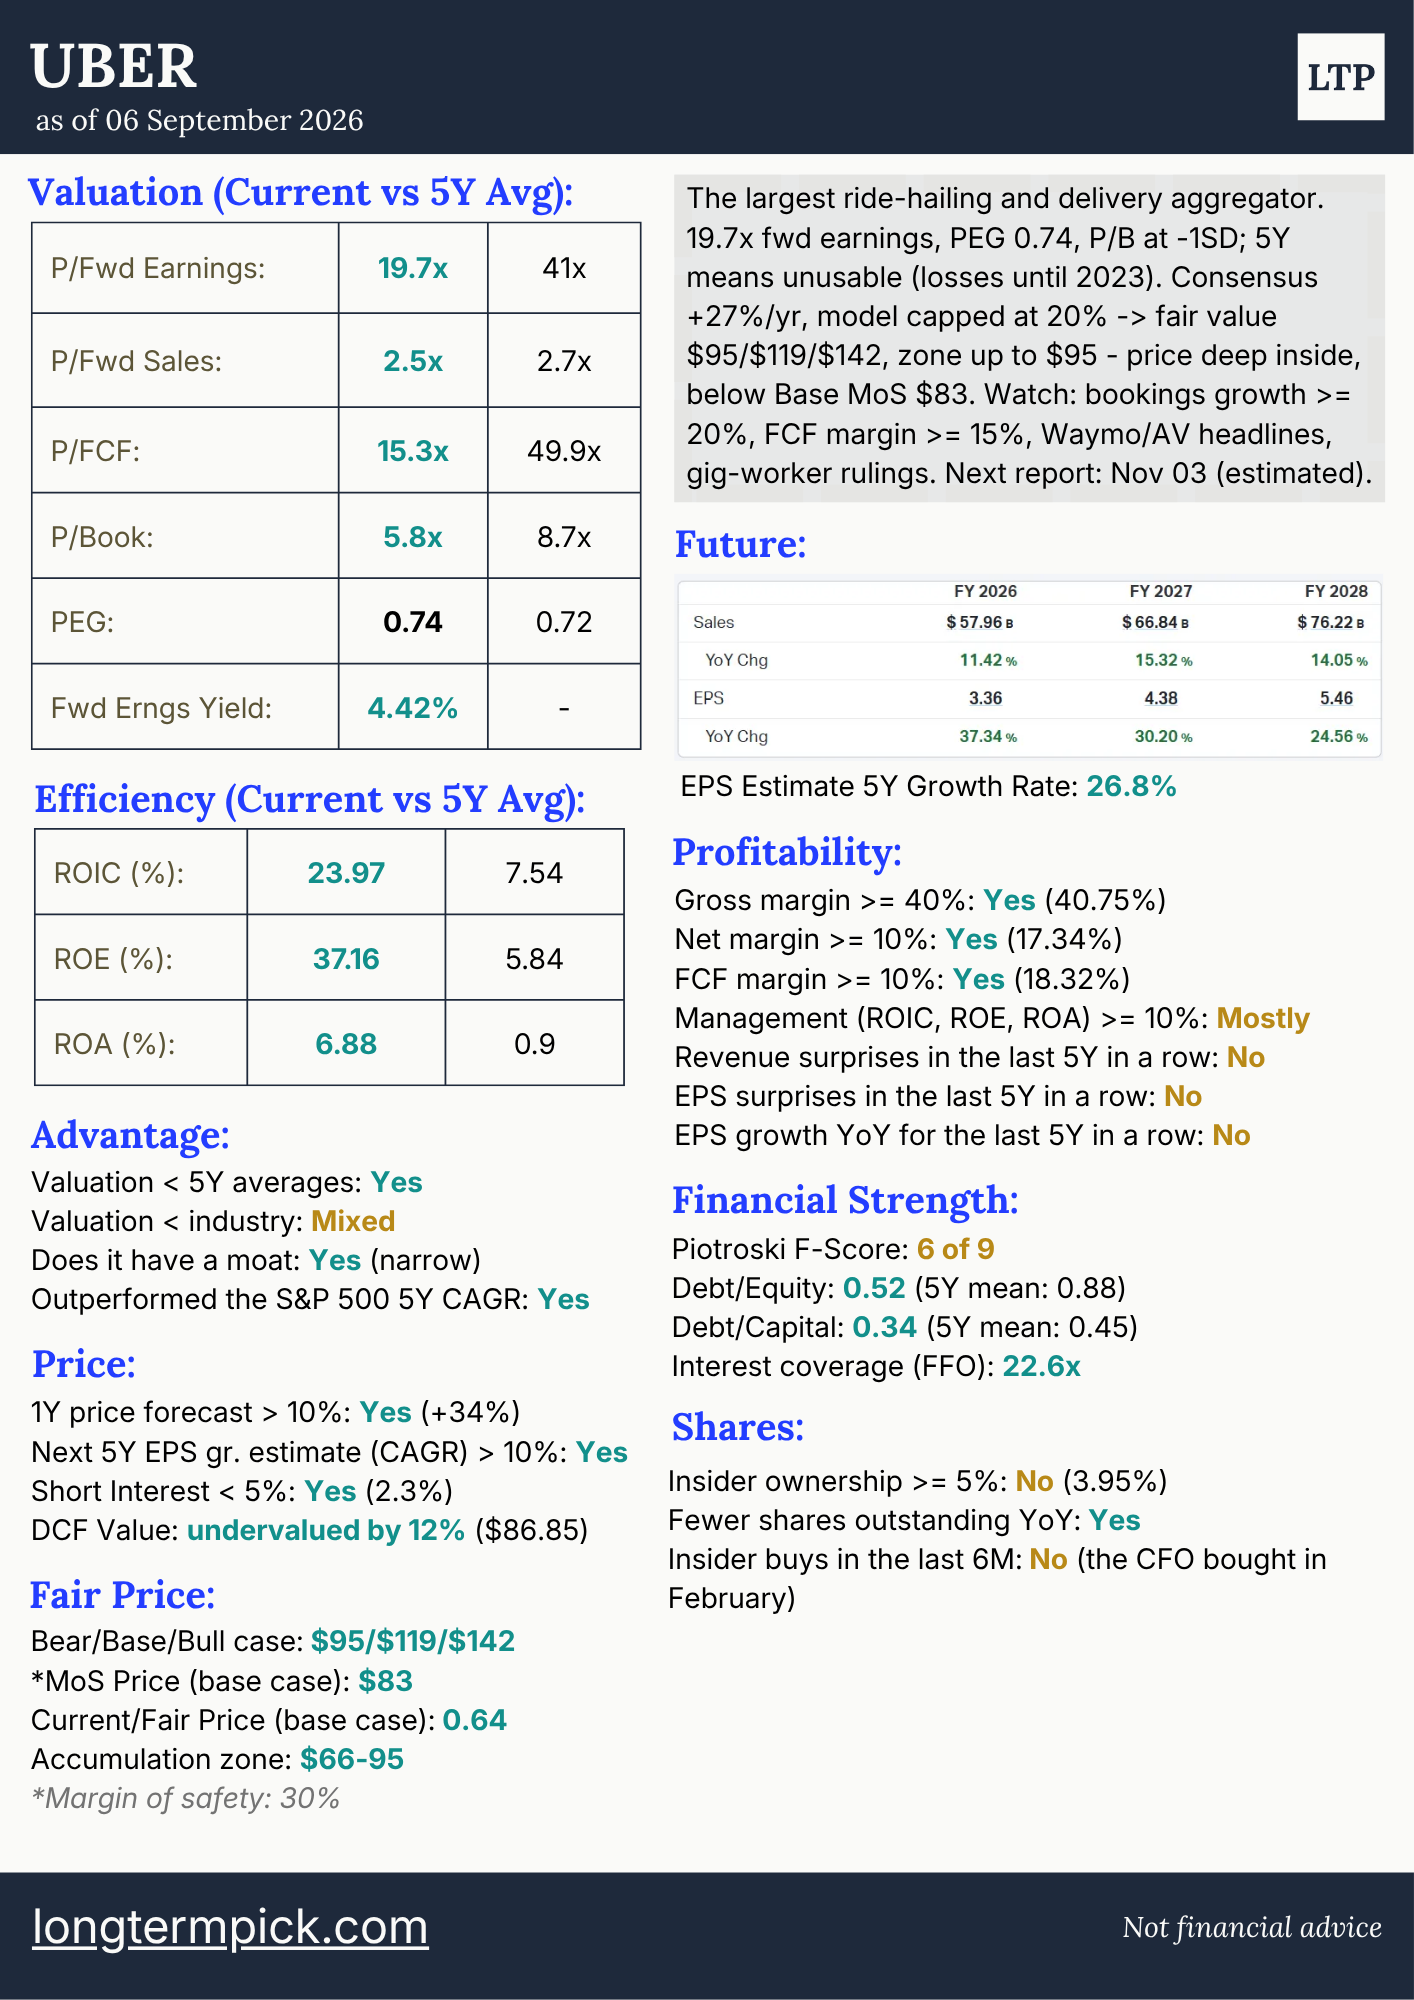
This is not a financial or investing recommendation. It is solely for educational purposes.
AV risk is way too much. Similar problem to Gen AI and ADBE. No matter how cheap it is the future is not great and will eventually catch up to UBER. I've read so many Uber articles but I just cannot put up with the AV risk. I think people should study more Chris Hohn.