

Something strange is happening: the best businesses on the planet keep getting better and cheaper at the same time. Microsoft grows earnings 16% a year - the stock fell 22%. Amazon achieved record margins - it trades at the lowest forward multiple in its history. Nvidia earns a 70% return on capital and costs 21x earnings - against a five-year average of 38x.
The name for this is AI-capex risk. I have a different one: a fear sale. Below are five giants I’d buy in exactly this order - each with the full thesis and fair value estimates.

Part 2, with five more names the market hates even more, is coming next. And at the end, a warning: Micron is the cheapest of them all at 6x earnings - and that is precisely why I refuse to touch it. That story is for paid subscribers.
Content:
AMZN
MSFT
META
NVDA
UBER
AMZN
TL;DR: Amazon dominates e-commerce and public cloud, with advertising as a third profit engine. The stock trades at 29.8x forward earnings vs a 50.5x 5Y average, the cheapest it has ever been on forward earnings, with revenue on track to cross $1T in FY2028. Verdict: core holding, the most balanced risk/reward. Base Case Fair Price: $369 - the stock trades ~33% below it; Buy Zone: $215-$307.
Overview
Next Earnings: Jul 30th, 2026, after-market (confirmed)
Sector: Consumer Discretionary
Industry: Broadline Retail
Beta (5Y Monthly): 1.46
Short Interest: 0.90%
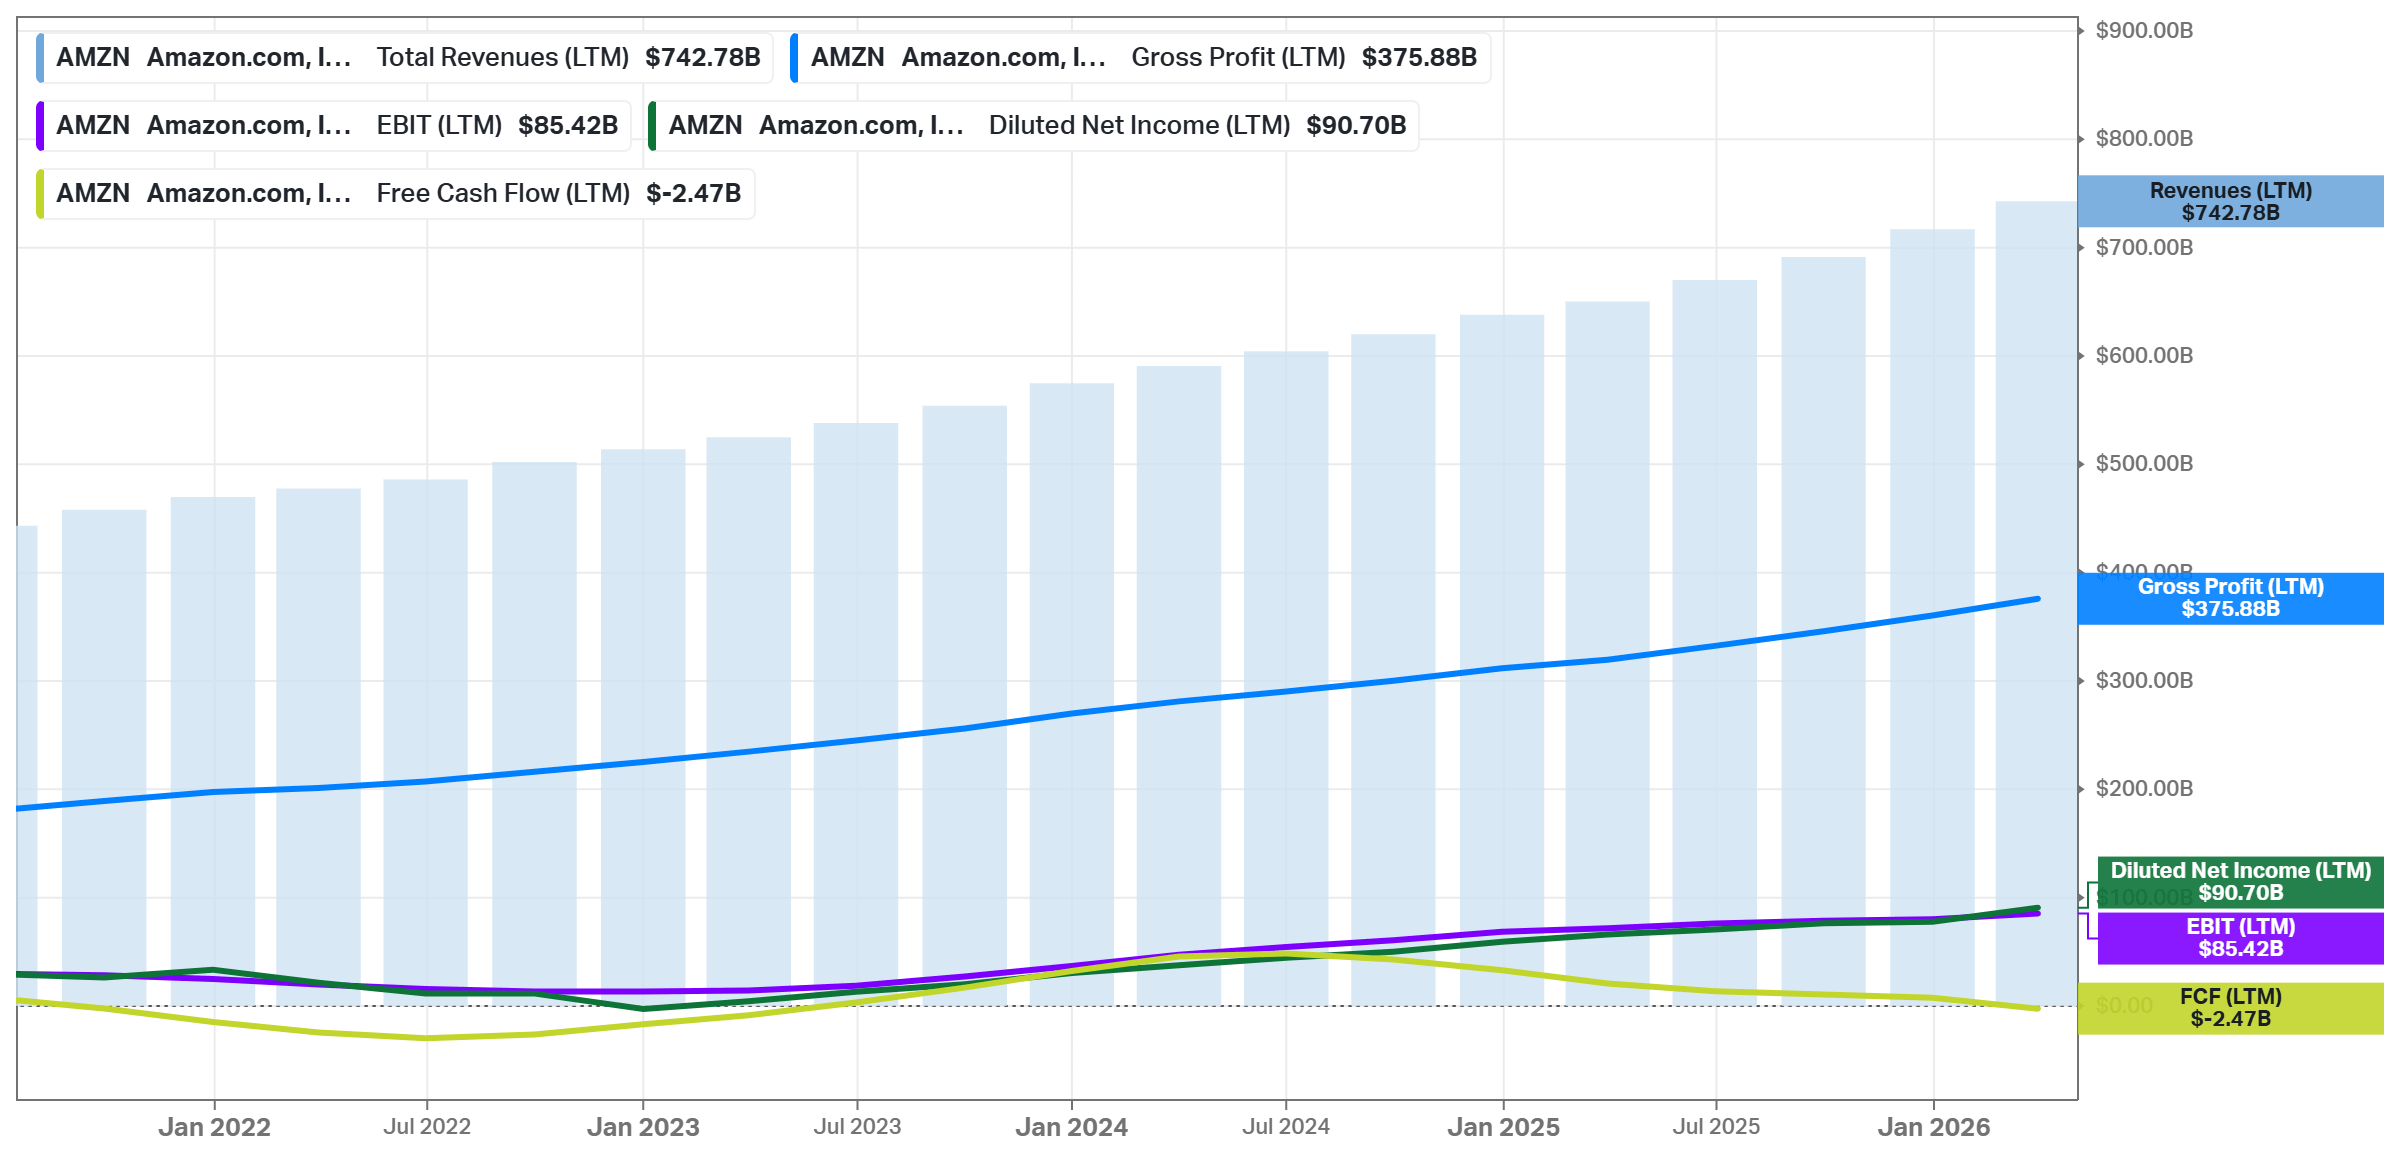
Amazon dominates two giant markets at once - e-commerce and public cloud. And has built several more businesses on top of them.
E-commerce & logistics: the world’s largest online retailer, with unmatched selection, pricing, and a vertically integrated delivery network. Prime memberships tie the ecosystem together: recurring high-margin fees in exchange for one-day shipping, video, music, and more - a flywheel where more customers attract more sellers and vice versa. Newer fronts include groceries, luxury, healthcare (One Medical, Amazon Pharmacy), and Kuiper (Amazon Leo) satellite internet.
Amazon Web Services (AWS): the #1 public cloud provider and the profit engine of the company. AWS is in the middle of a massive AI buildout: custom silicon (Trainium/Inferentia), the Bedrock model platform, and the multi-billion-dollar Anthropic partnership position it as core AI infrastructure for enterprises.
Advertising: already one of the largest ad businesses in the world, growing fast as ads spread across search results, Prime Video, and streaming - nearly pure margin, built on proprietary purchase data of hundreds of millions of consumers.
Devices & content: Kindle, Echo/Alexa, Ring, Fire TV, plus MGM/Prime Video originals feeding the Prime flywheel.
Amazon has a wide economic moat from network effects, cost advantages (scale, logistics, negative cash-conversion cycle), switching costs (AWS), and intangibles. And arguably the moat of the whole is greater than the sum of its parts, since every segment reinforces the others.
Main competitors: WMT, GOOGL, MSFT, META, EBAY, NFLX.
Financial Position
Market Cap: $2.74T
Total Debt: $235.54B
Cash & Investments: $143.09B
Enterprise Value: $2.84T
Net debt of ~$92B looks large in isolation but is modest against ~$823B of expected FY2026 revenue and an operating cash flow machine that funds one of the biggest capex programs in corporate history - data centers for AI, logistics robotics, and Kuiper (Amazon Leo) satellites, while still keeping $143B of cash on hand. Management is deliberately converting every operating dollar into AI and infrastructure capacity, exactly as it did in previous investment cycles (2014-2015, 2021-2022), each of which was followed by a margin increase.
Valuation (Current vs 5Y)
Price/Fwd Earnings: 29.8x vs 50.5x
Price/Fwd Sales: 3.2x vs 2.8x
PEG: 1.43 vs 1.90
Fwd Earnings Yield: 3.28% vs 1.98%
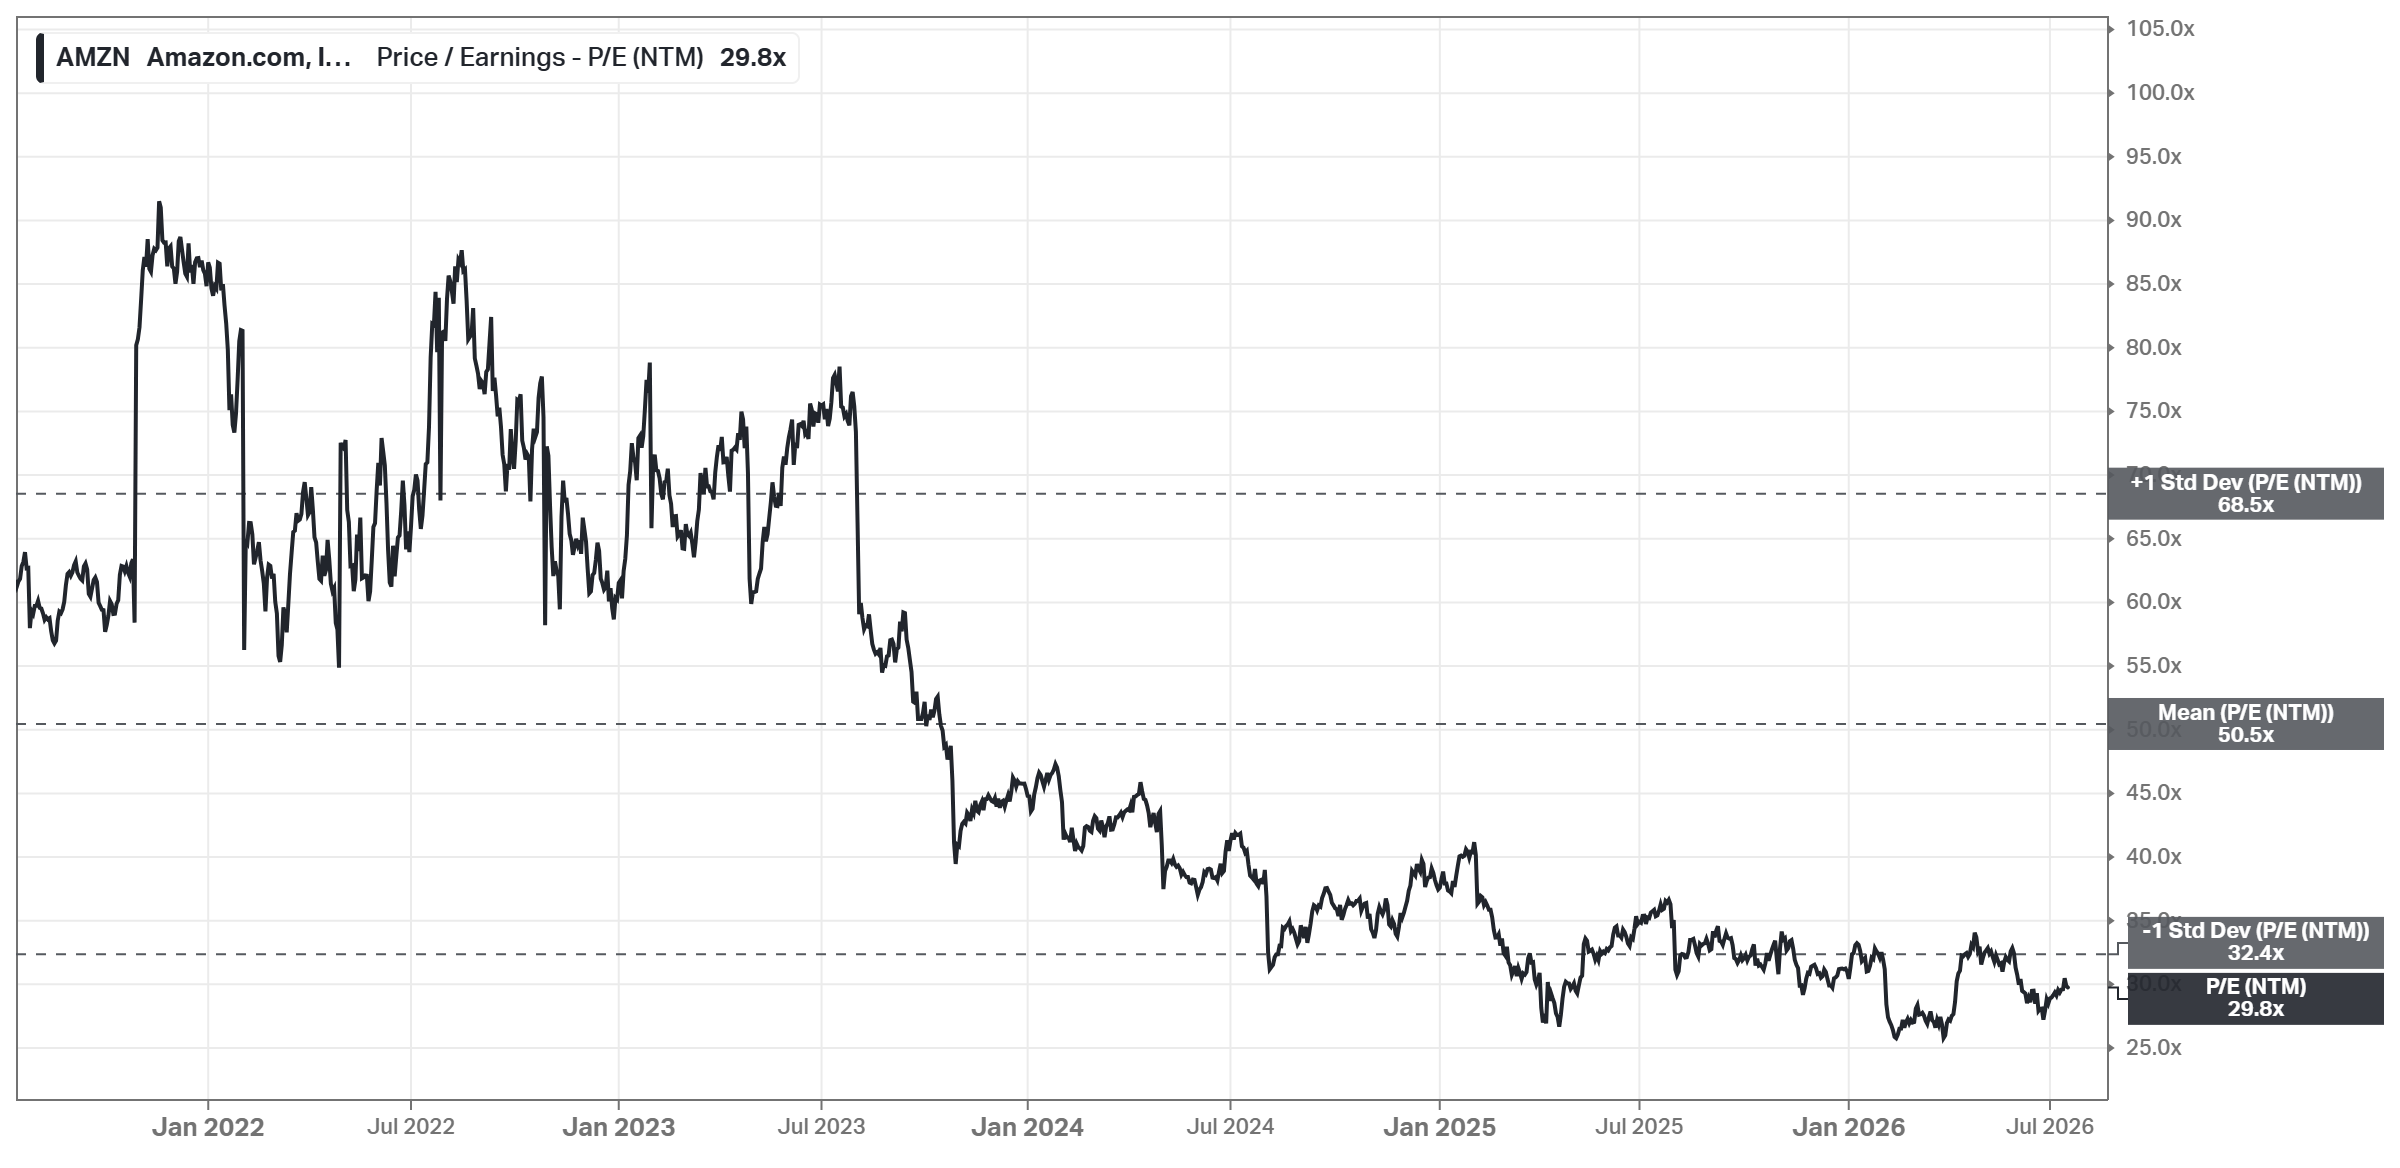
The forward P/E of 29.8x is the lowest in Amazon’s modern history - below its -1 standard deviation band (32.4x) and versus a 50.5x five-year average. For two decades, the standard objection to AMZN was “great company, impossible multiple”; that objection is now gone, because EPS has been compounding faster than the price. P/FCF is meaningless this year: earnings, not cash flow, are the honest benchmark during a capex super-cycle.
Growth
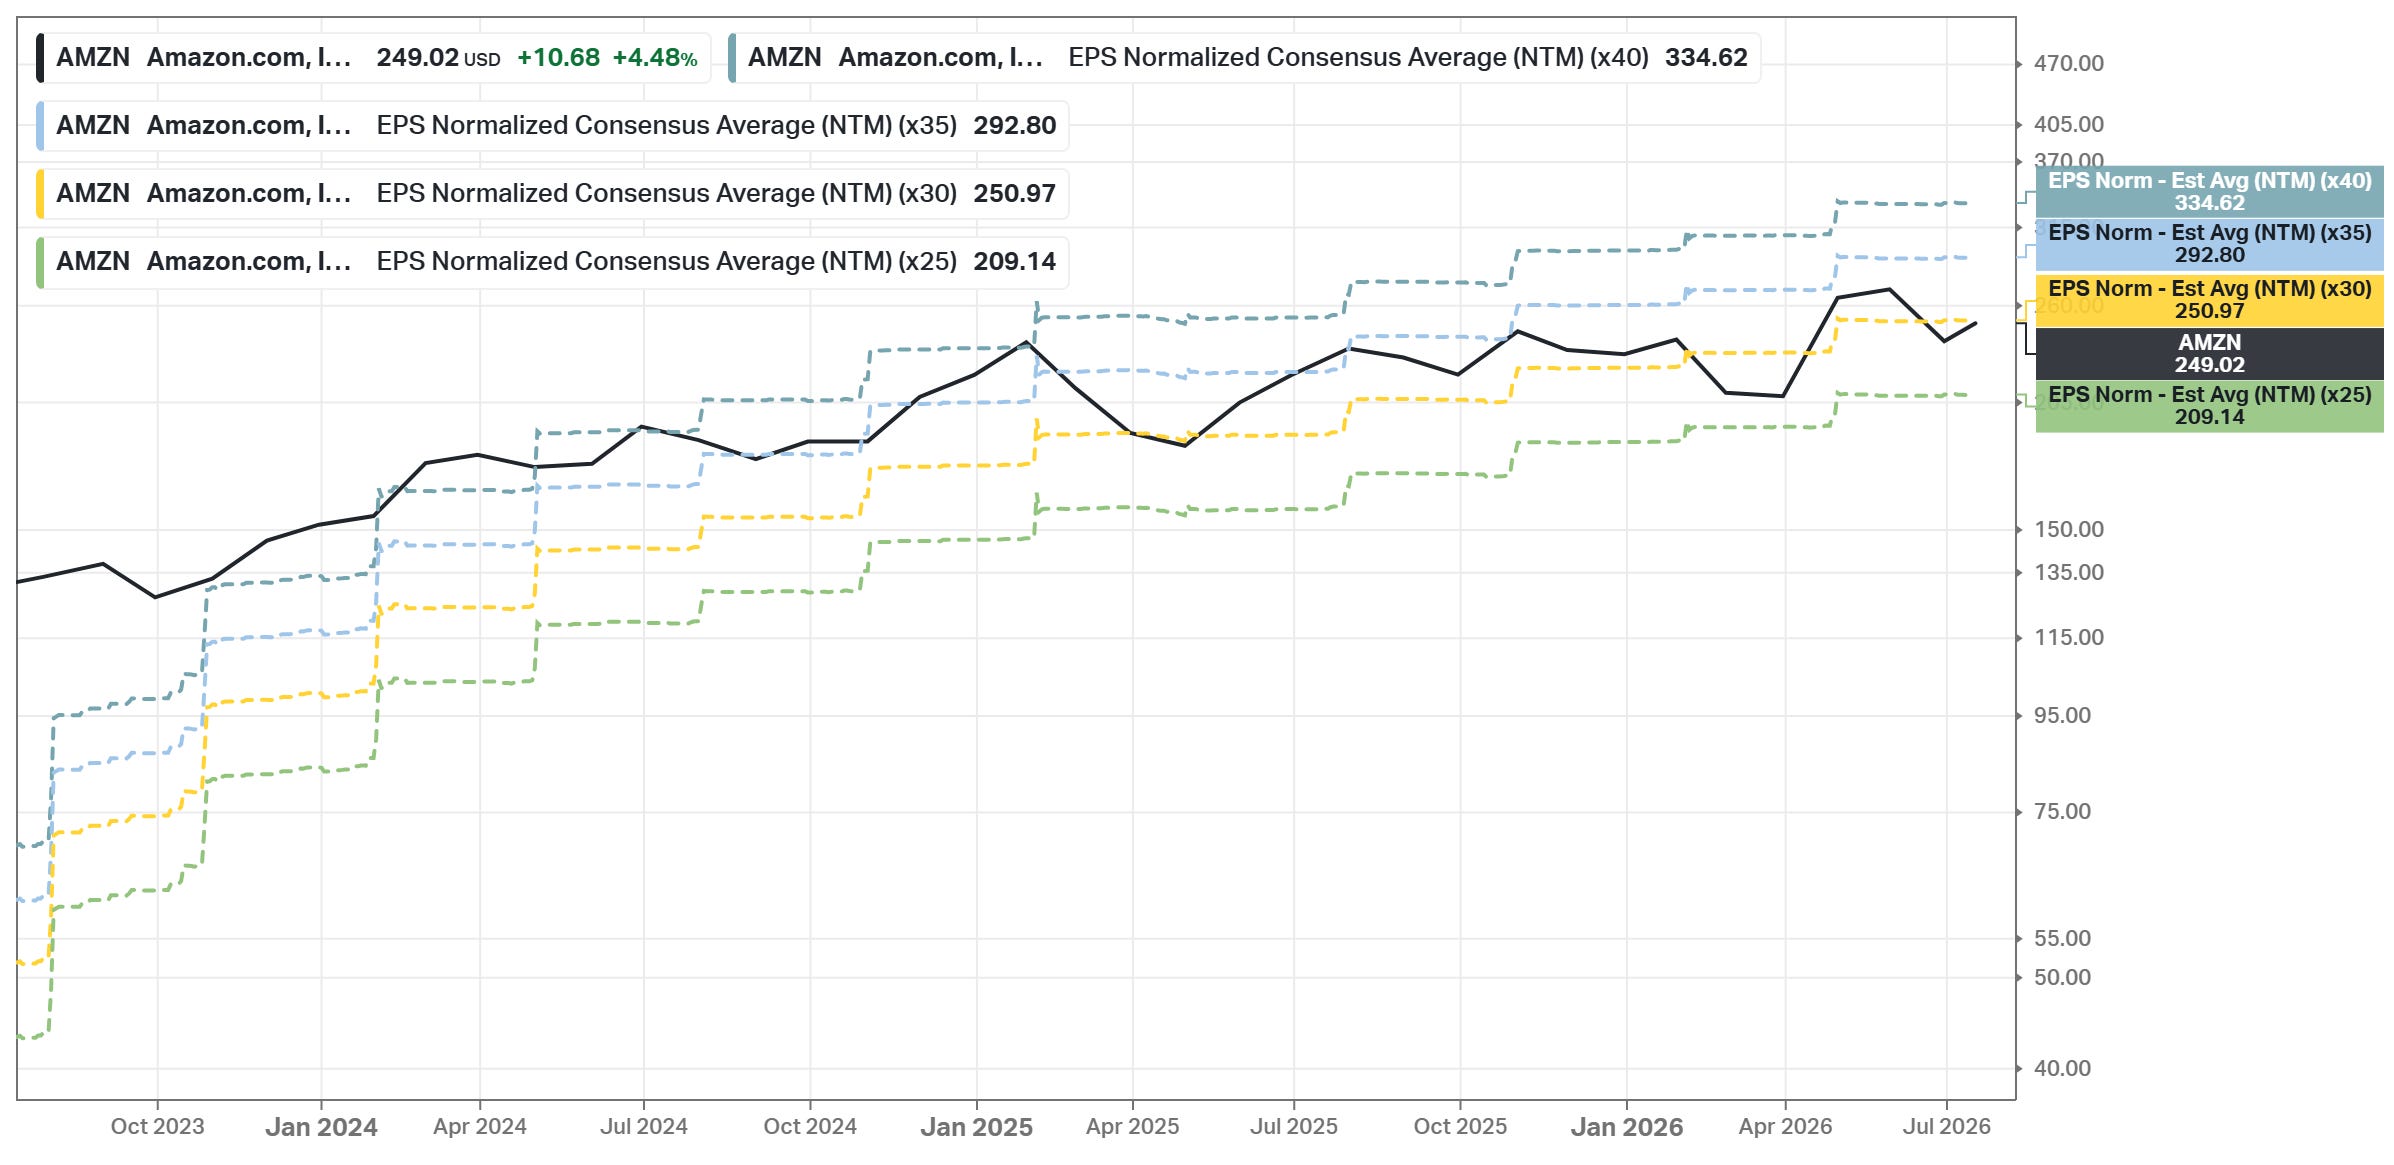
EPS Fwd 5Y CAGR: 21.31% (5Y mean: 29.05%)
Price Estimates 1Y: $314.35, +23.29% upside
Analyst Rating: Strong Buy (15 Strong Buy/47 Buy/3 Hold/0 Sell)
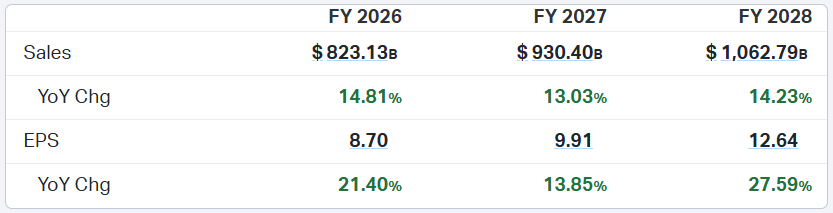
Consensus has Amazon crossing one trillion dollars of annual revenue in FY2028, the first company in history to do so, while still growing 13-15% a year.
Management Effectiveness (Current vs 5Y)
ROIC: 9.68% vs 9.09%
ROE: 24.28% vs 17.93%
ROA: 6.85% vs 5.05%
All three return metrics are above their 5-year averages. ROIC of 9.7% is the price of running a capital-heavy retail/logistics network alongside the software-margin businesses, plus a denominator inflated by the AI buildout. ROIC has roughly doubled from its 2022-2023 trough and keeps going higher.
Margins (Current vs 5Y)
Gross Profit: 50.60% vs 46.37%
EBIT: 11.50% vs 7.13%
Net Income: 12.22% vs 6.29%
FCF: -0.33% vs 1.03%
AWS and advertising (high margin) grow faster than retail (thin margin), so consolidated margins expand year after year. FCF margin near zero is the AI capex bill - the same pattern as MSFT and META.
Dividends
Dividend: none
Buybacks: none
Total Shrhldr Yield: ~-2.3% (debt paydown component -2.28%)
Amazon remains the purest reinvestment machine in mega-cap tech: no dividend, no meaningful buyback, and currently a net borrower to fund the AI buildout. All shareholder return comes through compounding the business itself. Every previous heavy-investment cycle produced a step-change in profitability.
Advantages
Three reinforcing wide-moats: #1 in e-commerce (with a logistics network nobody can replicate), #1 in cloud via AWS, and a top-3 digital ad platform - tied together by Prime and proprietary consumer data.
Structural margin expansion: Net margin doubled (6.3% avg to 12.2%) as high-margin AWS and ads outgrow retail, and the mix shift is nowhere near done - EBIT margin at 11.5% still has obvious room versus pure software peers, converting ~14% revenue growth into 20%+ EPS growth.
The cheapest multiple in Amazon’s history: 29.8x forward earnings versus a 50.5x average, below -1 standard deviation, while margins and returns are at all-time highs, revenue heads toward the historic $1T mark.
Disadvantages
FCF has vanished into the AI capex cycle: FCF margin is negative (-0.33%), and the company is issuing debt while spending on data centers, chips, and satellites. If AI demand or AWS growth disappoints, the market will punish the spend, and there is no dividend or buyback to cushion the wait.
30x earnings still demands execution: The multiple is cheap only relative to Amazon’s own past, and expected EPS growth (21.3% fwd CAGR) is below its own historical expectation (29.1%). Any stumble in AWS growth or margin trajectory compresses both the E and the multiple.
Regulatory and competitive pressure: Antitrust scrutiny of the marketplace model (FTC suit), rising competition in cloud AI (Microsoft/Google), low-cost cross-border retail (Temu, Shein) attacking the value segment, and the sheer difficulty of moving the needle at $1T scale - Amazon’s law of large numbers problem is the biggest in corporate history.
Fair Price
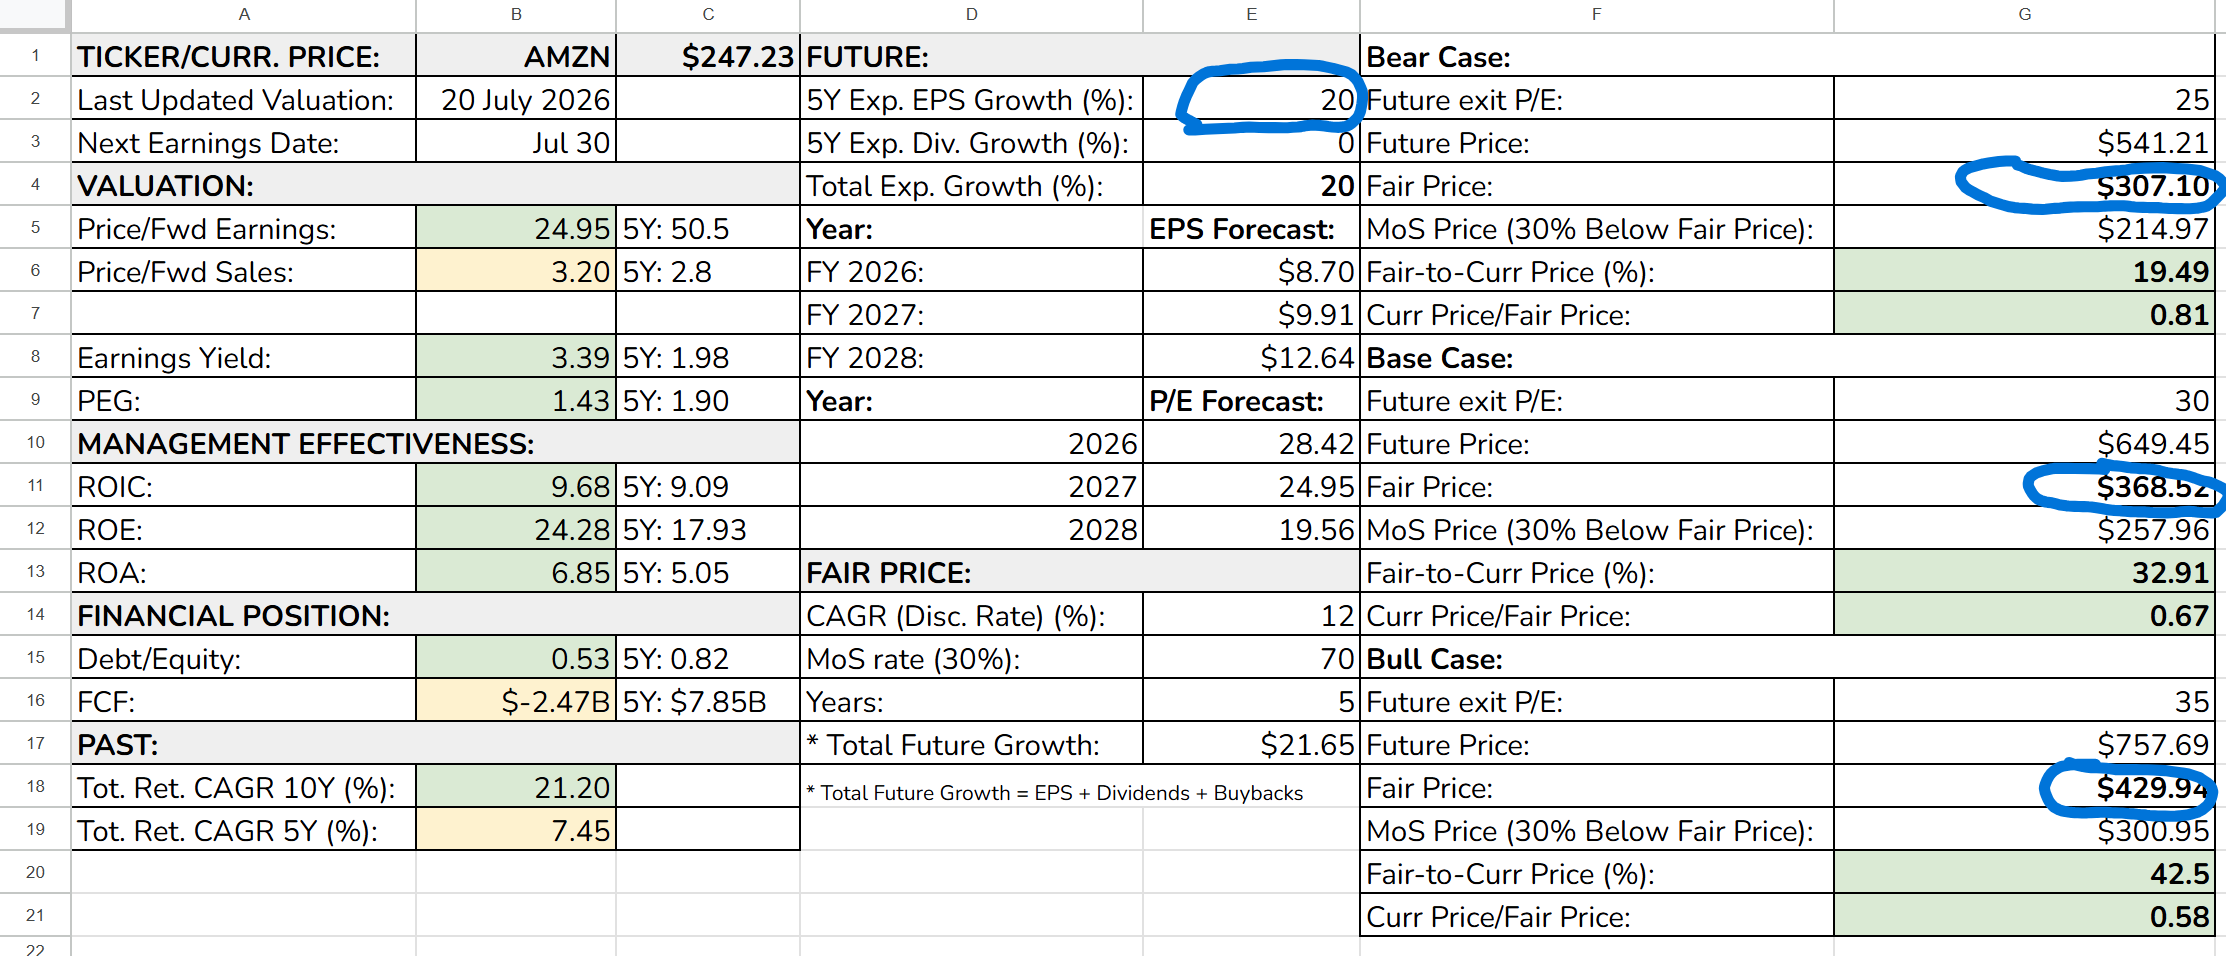
Same model as always: project EPS five years out, apply an exit multiple, discount the result back at 12% a year (my required return).
For Amazon, I use 20% annual EPS growth, in line with consensus estimates through FY2028 ($8.70 to $12.64 is ~20.5% a year), with nothing added for dividends, because there are none. That turns FY2026 EPS of $8.70 into ~$21.65 by 2031.
The exit multiples are deliberately conservative: 25x is roughly today’s forward multiple (the market never re-rates), 30x is a modest premium for the quality, and even the bull case at 35x is ~30% below Amazon’s own 5-year average of 50.5x. In other words, none of the three scenarios needs the old Amazon multiple to come back.
Bear case (exit P/E 25x): fair price $307 - MoS price $215
Base case (exit P/E 30x): fair price $369 - MoS price $258
Bull case (exit P/E 35x): fair price $430 - MoS price $301
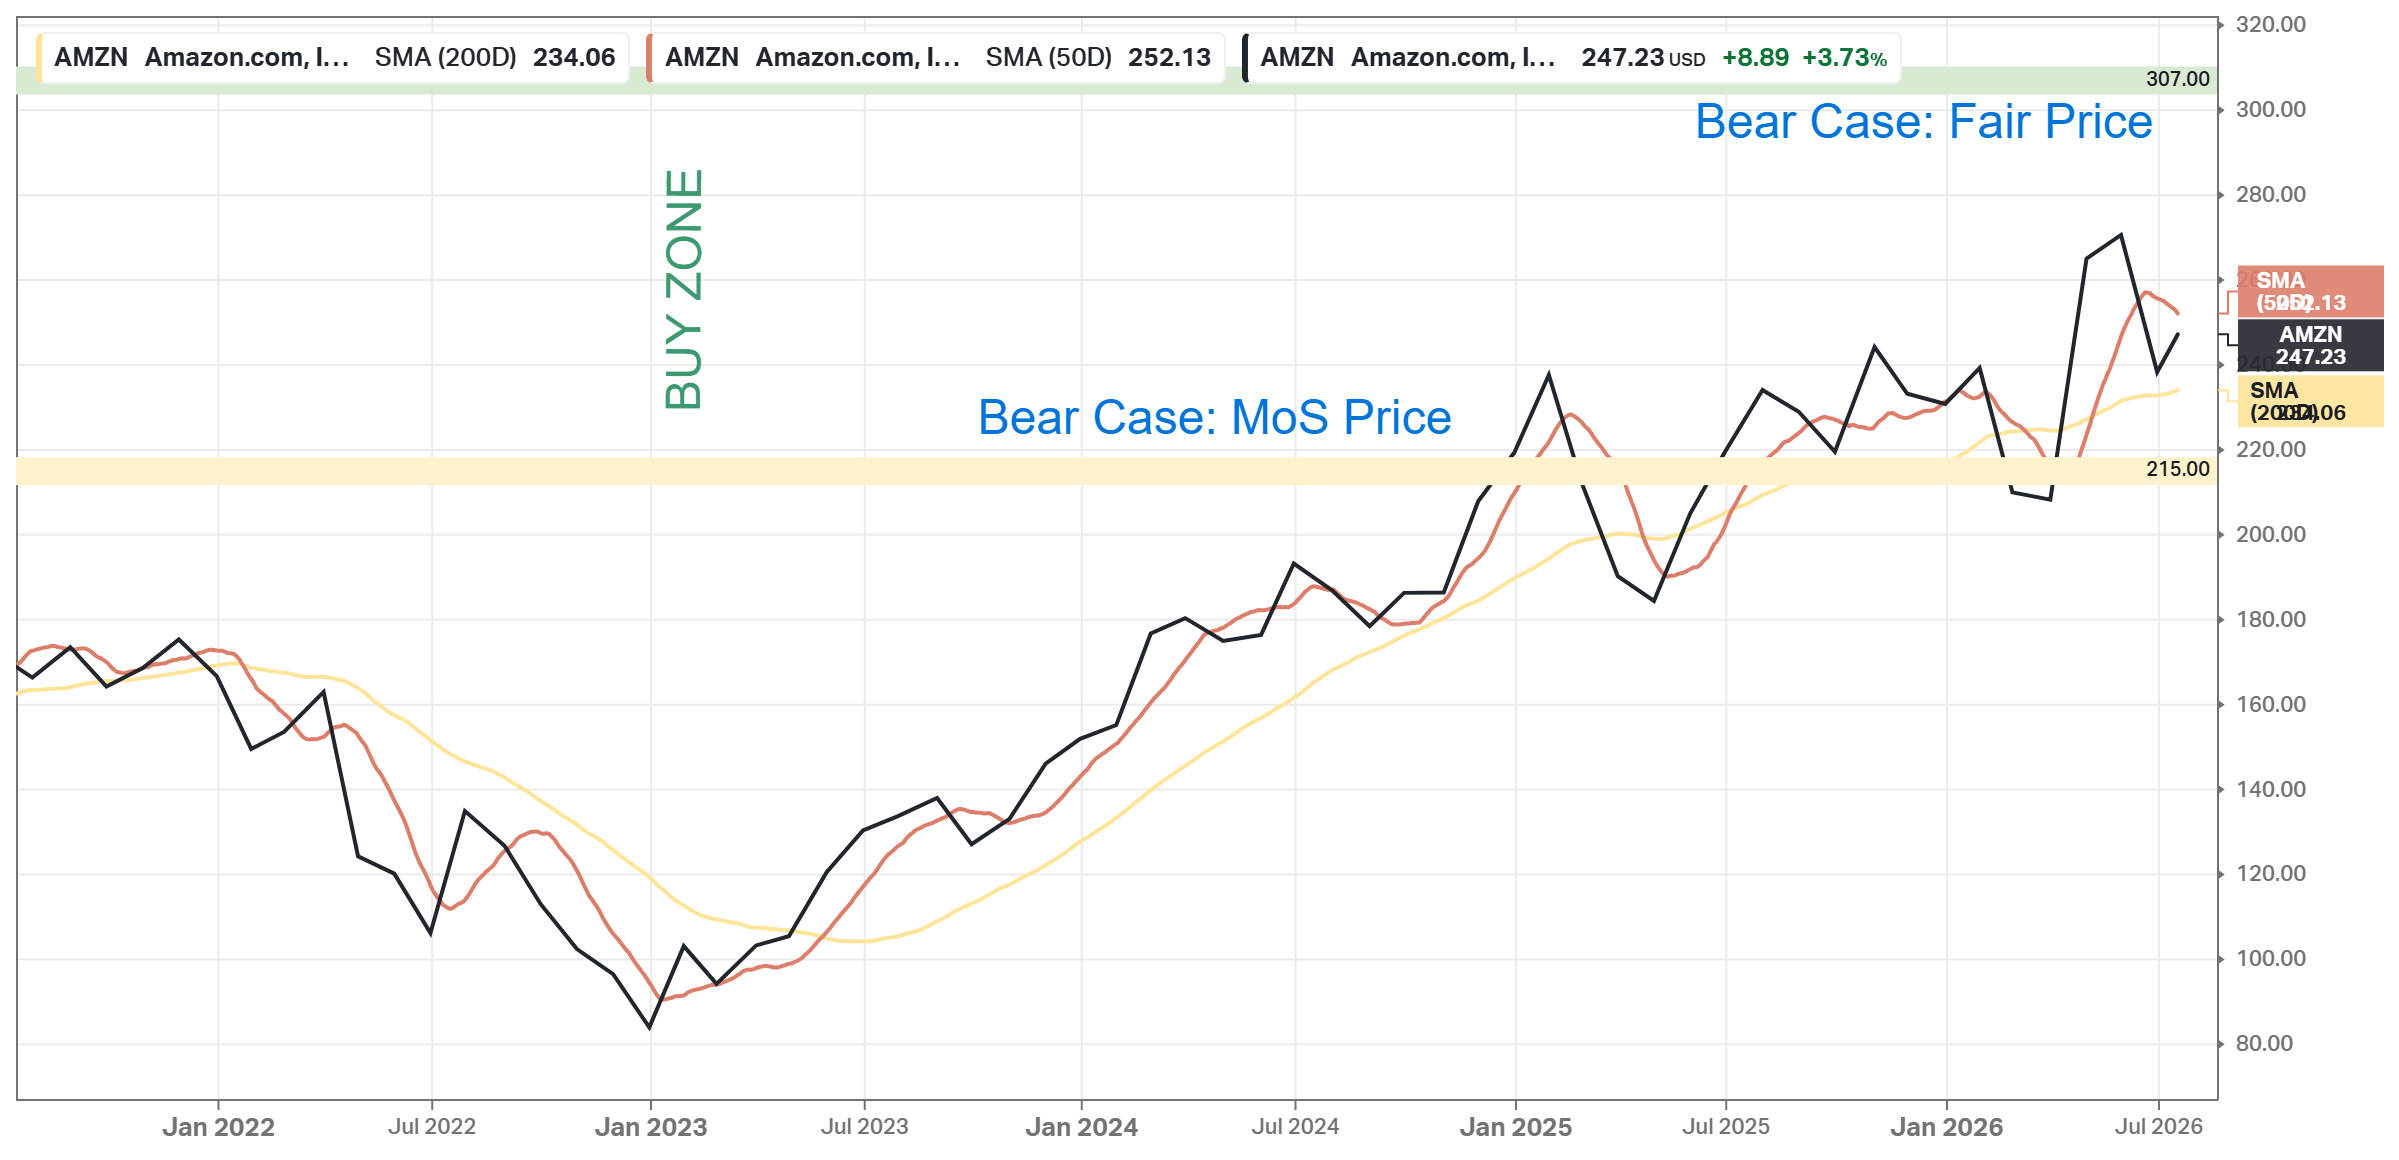
Note: At $247, the stock trades below the base case MoS price of $258 - meaning the full 30% margin of safety is already in the price if the base case plays out. Even in the bear case, the stock trades ~19% below a $307 fair price.
The bear case MoS price ($215) and the bear case fair price ($307) form the accumulation zone.
Investment Thesis
Amazon is the “quality compounder still compounding”. The forward multiple fell to the lowest level in its modern history (29.8x vs a 50.5x average) because earnings outgrow the price. Fundamentals are at their best ever: net margin doubled to 12.2%, ROE at 24%, and revenue on track to make Amazon the first trillion-dollar-revenue company by FY2028.
Retail acquires customers, while AWS and advertising, the profit machines, grow faster than the whole, so consensus turns ~14% revenue growth into 21-27% EPS growth. AWS is one of three hyperscale clouds building AI-era infrastructure, with its own silicon and the Anthropic partnership as differentiators - all wrapped inside a diversified giant, not a pure-play bet.
The costs: free cash flow is zero while management spends everything, plus borrowed money, on the buildout; all shareholder return is price appreciation, and 30x earnings leaves less valuation slack than CRM at 12x or ADBE at 8.7x.
A core long-term holding, arguably the most balanced risk/reward. Historic-low relative valuation, record and still-expanding margins, wide-moat dominance in three markets, near-zero short interest. Expect ~20% annual EPS growth plus possible re-rating from 29.8x as FCF returns post-capex; the main risk is an AI-capex digestion year flattening the stock.
Buy, hold through the capex noise, and treat any drawdown toward the $220 area as a gift.
MSFT
TL;DR: Microsoft is a wide-moat software and cloud giant built around Office, Azure, and AI. The stock trades at 21.4x forward earnings vs a 29.9x 5-year average - the cheapest it has been in five years. The margins are above their historical norms. Verdict: a buy-the-fear quality compounder/core position, worth accumulating at these levels. Base Case Fair Price: $520 - the stock trades ~24% below it; Buy Zone: $291-$416.
Overview
Next Earnings: Jul 29th, 2026, after-market (confirmed)
Sector: Information Technology
Industry: Software
Beta (5Y Monthly): 1.13
Short Interest: 1.30%
Microsoft develops and licenses consumer and enterprise software. Everyone knows Windows and Office, but today the company is much more than that. It is organized into three roughly equal segments:
Productivity and Business Processes: Office 365/Microsoft 365 (Word, Excel, PowerPoint, Outlook), Exchange, SharePoint, Teams, LinkedIn, and Dynamics 365 (ERP/CRM). Office still holds a quasi-monopoly in productivity software, and Microsoft keeps upselling customers to higher-priced tiers (security, Teams Phone, Copilot).
Intelligent Cloud: Azure (the #2 public cloud provider), Windows Server, SQL Server, GitHub (the dominant code-hosting and developer platform, home of GitHub Copilot), Visual Studio developer tools, and Nuance (healthcare AI). Azure is the centerpiece of the modern Microsoft: an estimated ~$75B+ business still growing around 30% a year. Through the OpenAI partnership, Microsoft also became one of the leaders in AI infrastructure and AI-powered products.
More Personal Computing: Windows Client, Xbox and gaming (including Activision Blizzard: Call of Duty, Warcraft, Candy Crush - now pushed toward Game Pass subscriptions and cloud gaming), Bing search and Edge, advertising, and Surface devices.
Analyst’s Note:
Personally, I use a Surface and write the analysis on this device 😉
On top of that is Microsoft 365 Copilot and the whole AI product layer, which the company monetizes across every segment. Microsoft has a wide economic moat built primarily on switching costs, with network effects and cost advantages as secondary sources.
Main competitors: NVDA, GOOGL, ORCL, CRM, NOW.
Financial Position
Market Cap: $2.94T
Total Debt: $125.43B
Cash & Investments: $78.23B
Enterprise Value: $2.99T
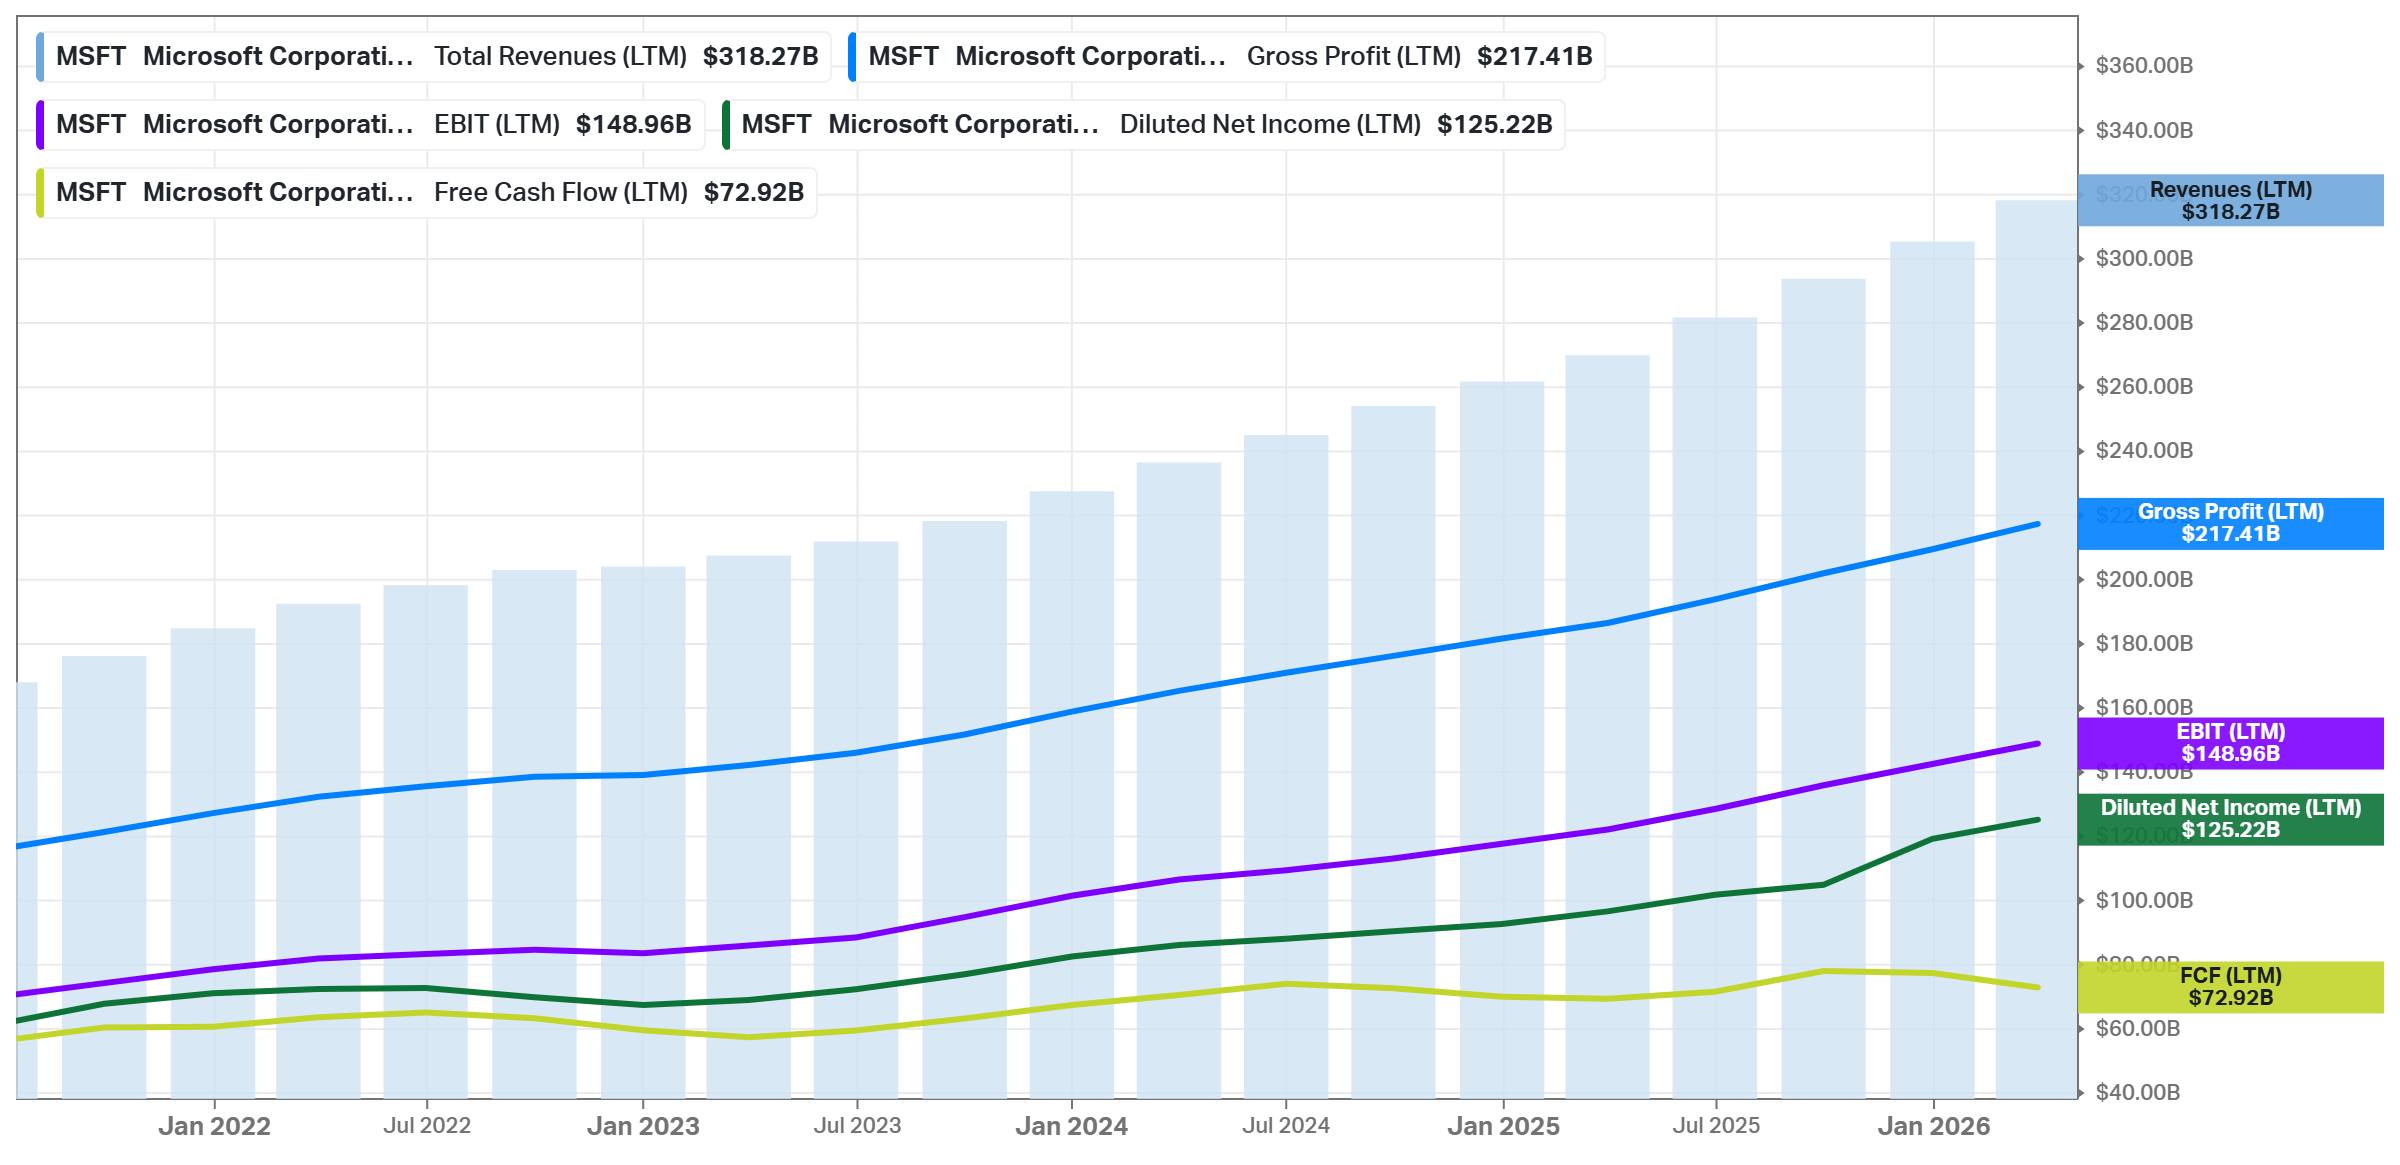
FCF (LTM): ~$72.9B
The balance sheet is rock solid: net debt of only ~$47B against ~$73B of annual free cash flow means Microsoft could pay down its entire net debt in well under a year of FCF. Debt is simply not a topic here.
Valuation (Current vs 5Y)
Price/Fwd Earnings: 21.4x vs 29.9x
Price/Fwd Sales: 8.0x vs 10.4x
Price/FCF: 40.3x vs 40.7x
PEG: 1.32 vs 2.24
Fwd Earnings Yield: 4.67% vs 3.34%
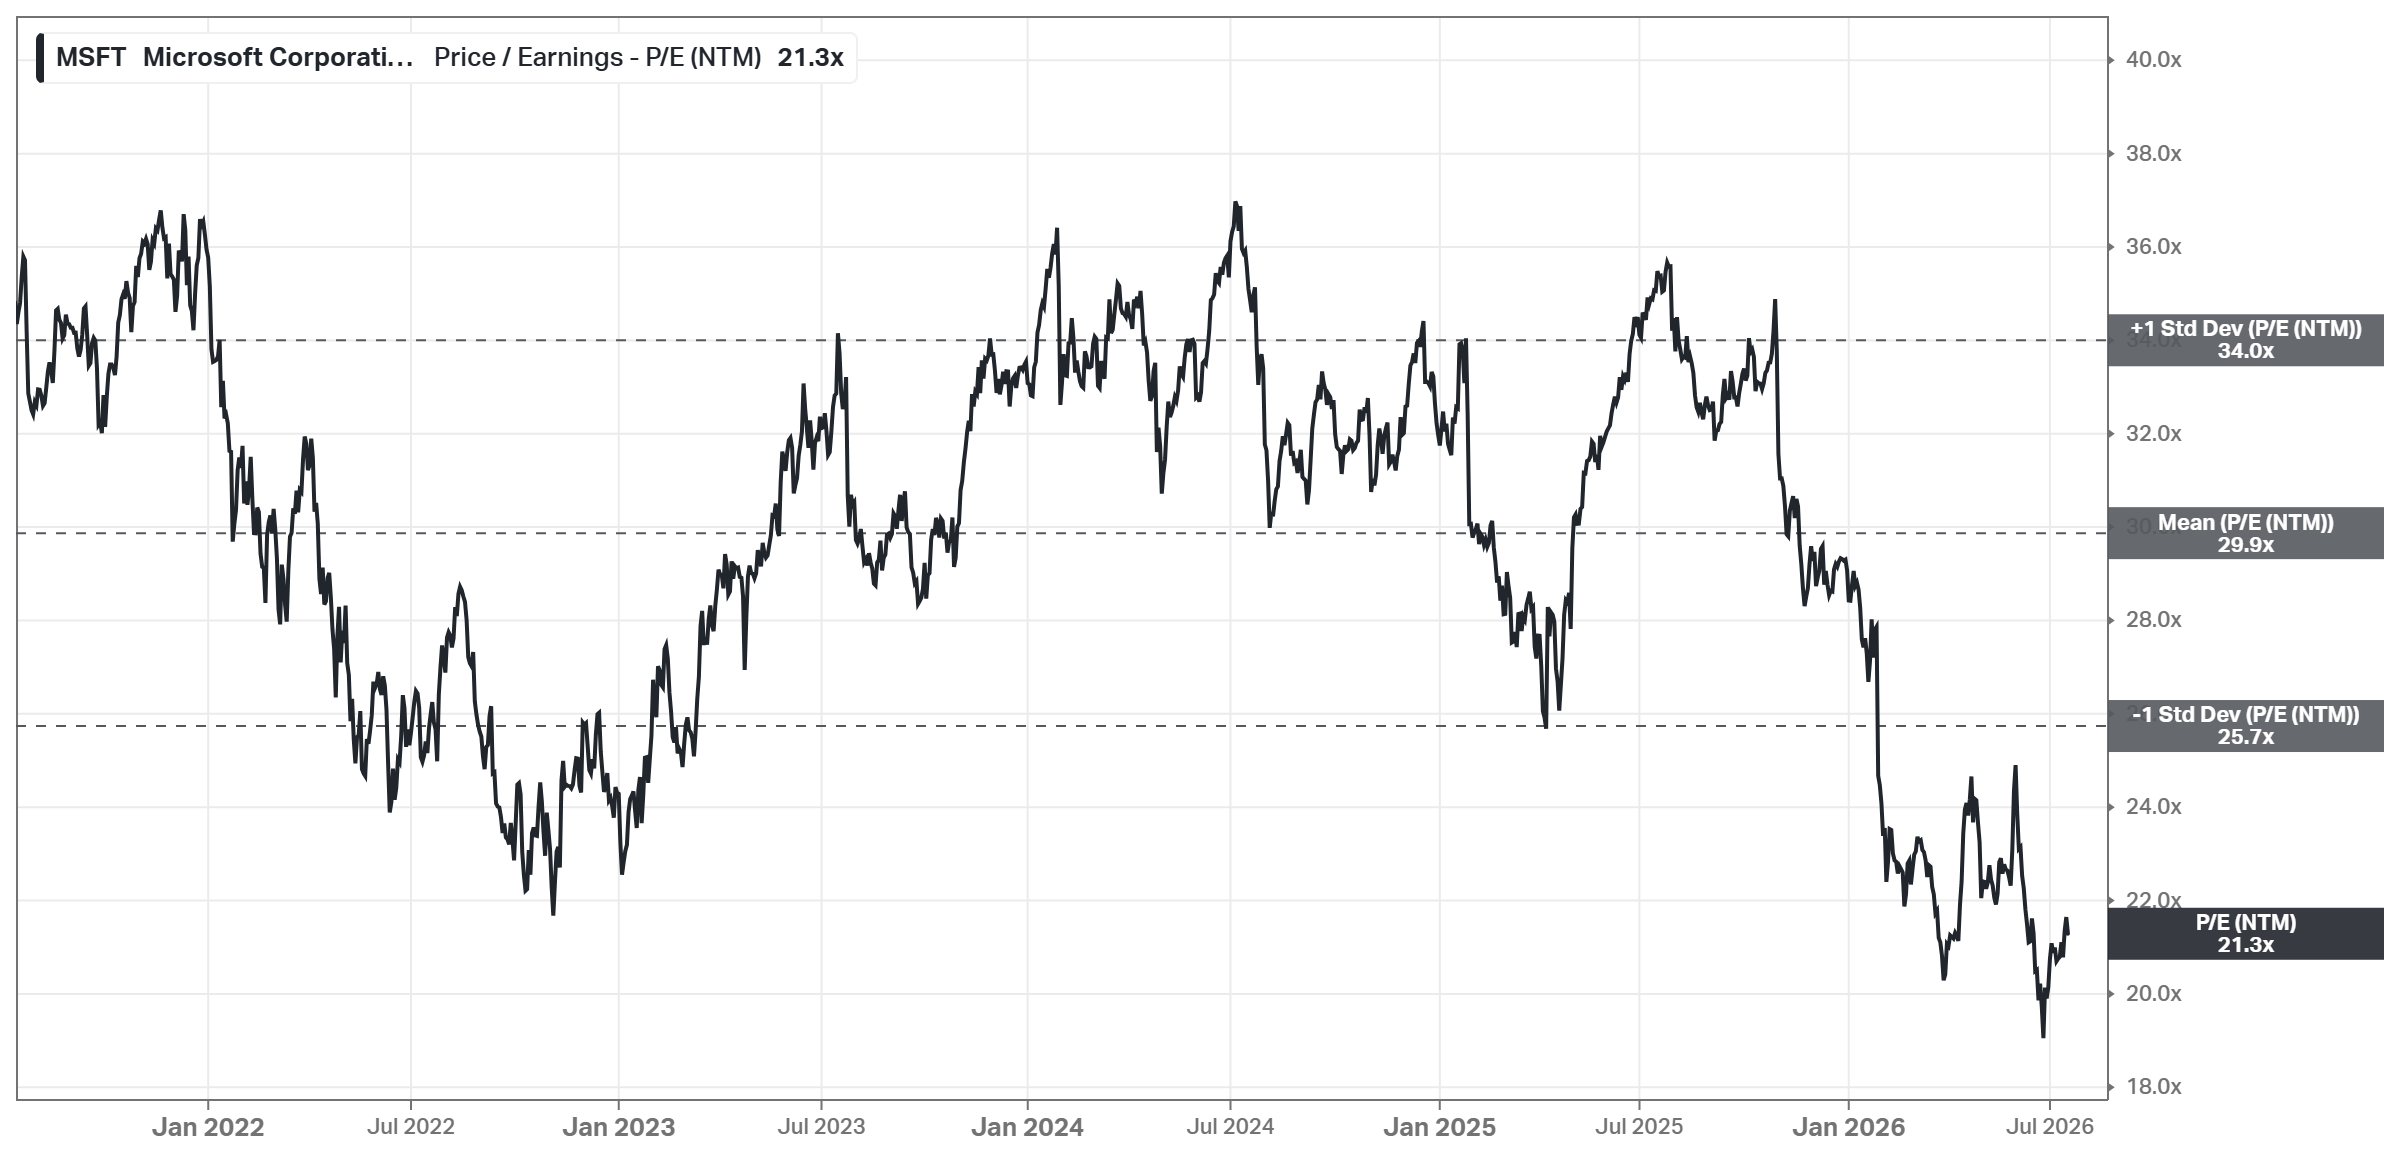
The forward P/E is well below its own -1 standard deviation band (25.8x) - this is the cheapest MSFT has been on forward earnings in the last five years. The only metric that has not de-rated is Price/FCF, which is still around its historical average (40.3x vs 40.7x) because free cash flow is temporarily depressed by the enormous AI capex cycle.
Growth
EPS Fwd 5Y CAGR: 16.13% (5Y mean: 13.43%)
Price Estimates 1Y: $558.77, +41.24% upside
Analyst Rating: Strong Buy (12 Strong Buy/41 Buy/3 Hold/0 Sell)
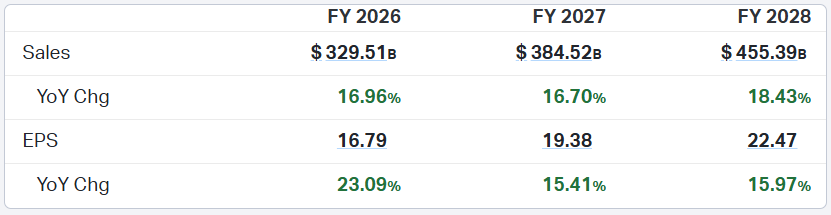
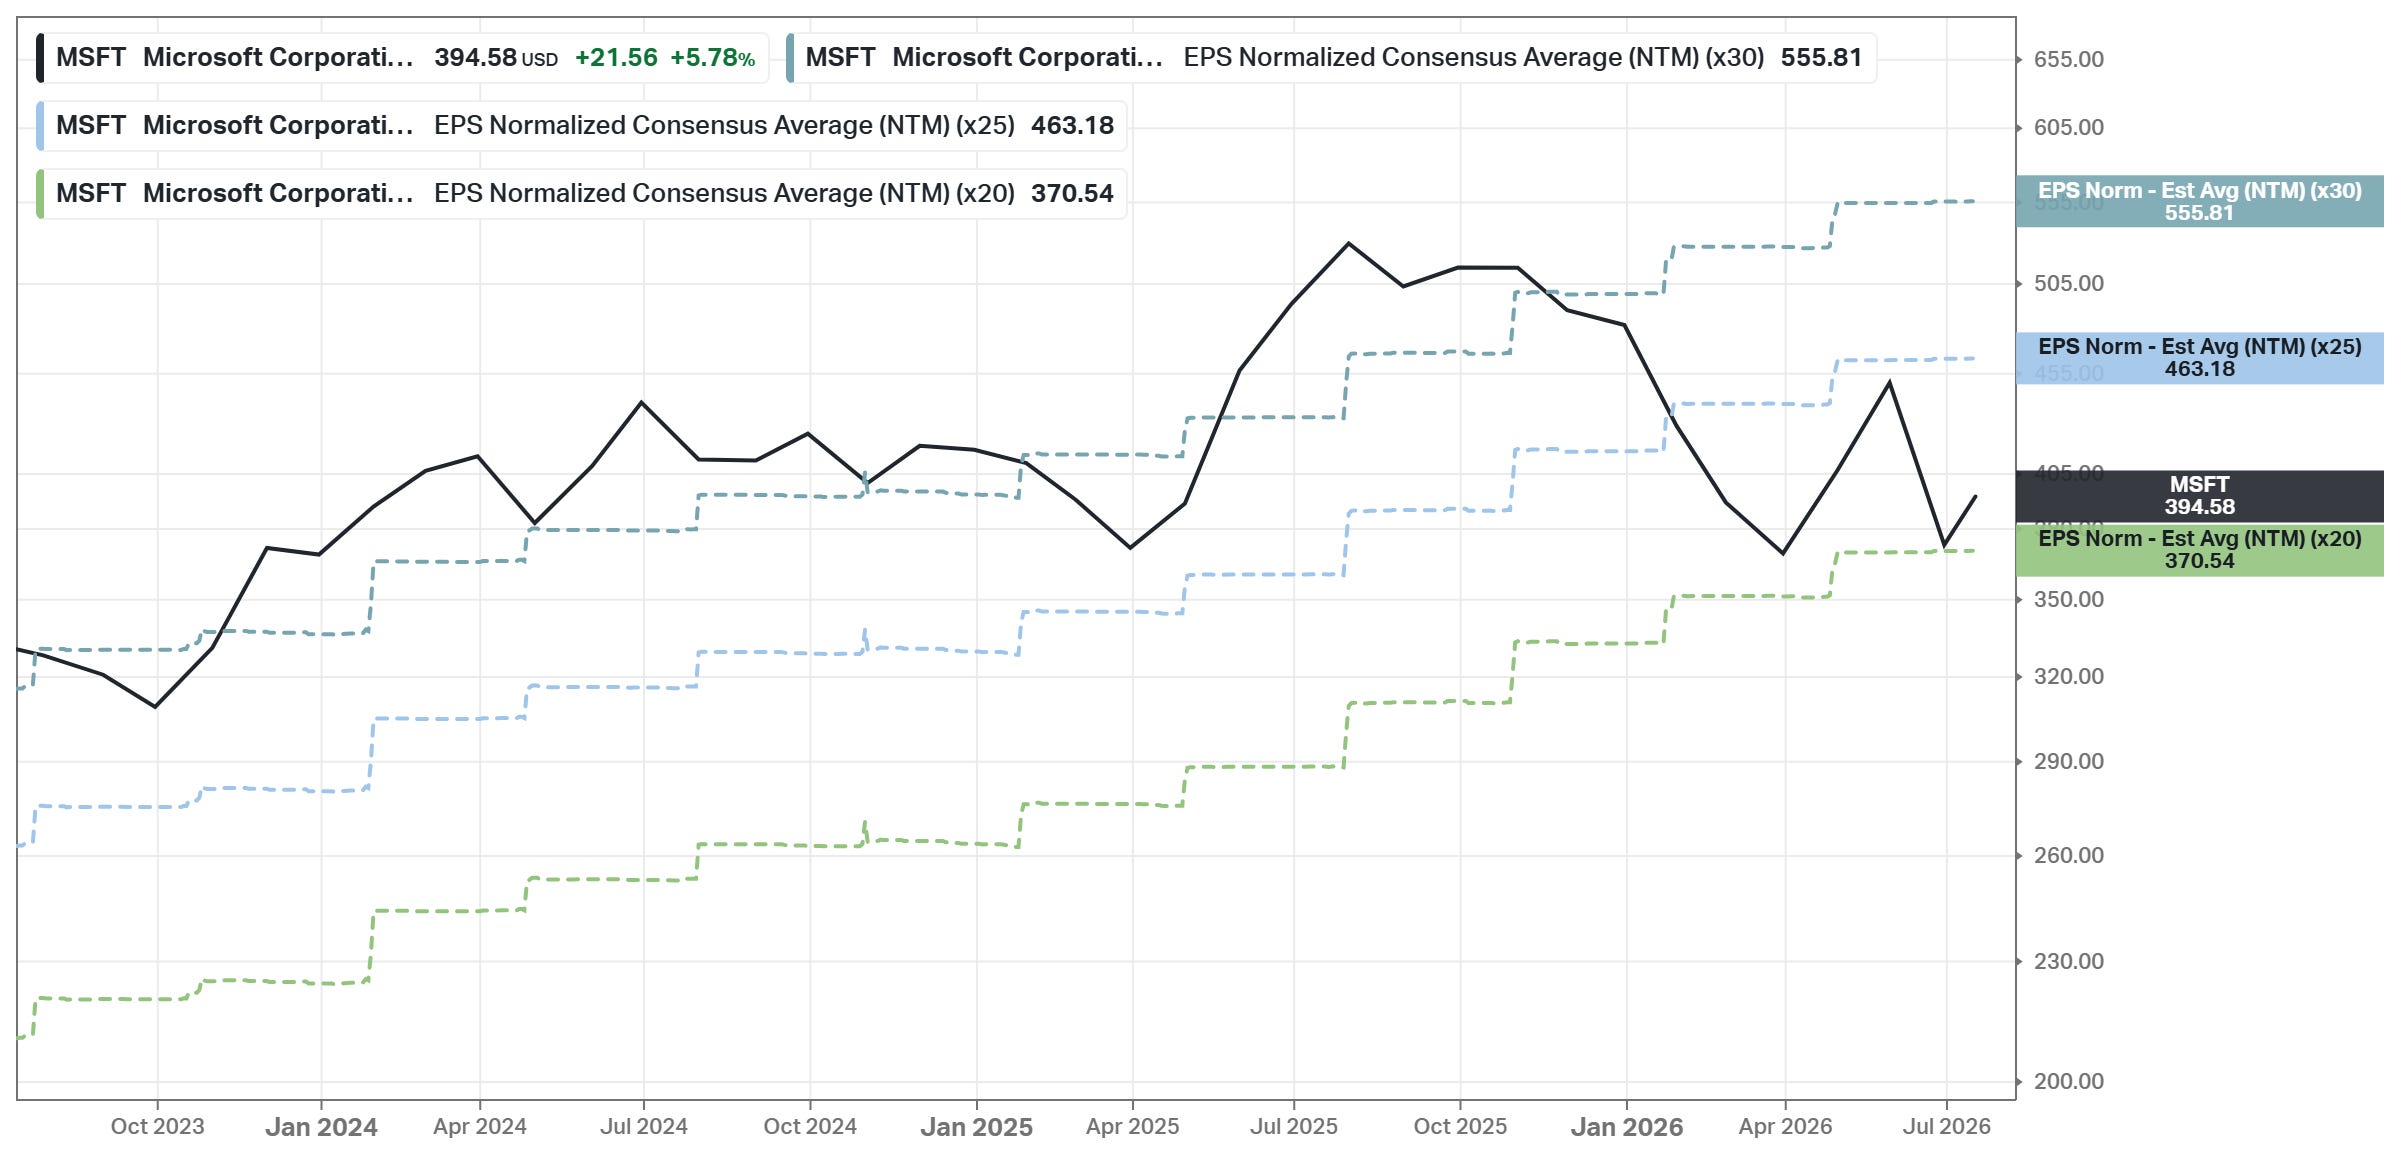
Notable detail: expected EPS growth is actually accelerating (16.13% fwd 5Y CAGR vs the 13.43% average expectation of recent years), while the multiple has compressed. That combination is what pushed the PEG from 2.24 down to 1.32. Even the lowest analyst target ($400) is above the current price.
Management Effectiveness (Current vs 5Y)
ROIC: 22.71% vs 25.81%
ROE: 34.01% vs 39.22%
ROA: 14.81% vs 14.81%
Returns on capital have drifted down from exceptional to merely excellent. The decline in ROIC/ROE is mostly a denominator effect: the capital base is growing from investments in AI data centers, which are currently not yielding full returns. A 22.7% ROIC is still far above the cost of capital.
Margins (Current vs 5Y)
Gross Profit: 68.31% vs 68.95%
EBIT: 46.80% vs 43.74%
Net Income: 39.34% vs 36.17%
FCF: 22.91% vs 28.90%
Operating and net margins are above their 5-year averages - the core business keeps getting more profitable. The FCF margin is the outlier (22.91% vs 28.90%) and again reflects record capex for AI infrastructure, not a deterioration of the underlying business. If capex normalizes, a lot of that gap should convert back into free cash flow.
Dividends
Yield: 0.92% (forward NTM: 0.98%)
Payout Ratio: 20.65%
Dividend Per Share: $0.91 quarterly ($3.64 annualized)
Dividend Per Share 5Y CAGR: 10.21%
Consecutive Annual Increases: 21 years
Total Shrhldr Yield: 1.67% (dividend 0.90% + buybacks 0.69% + debt paydown 0.10%)
The yield is small, but this is a classic dividend-growth profile: a low payout ratio, double-digit dividend growth for a decade, and 21 straight years of increases. Plenty of room to keep compounding the payout.
Advantages
Wide moat with enormous switching costs: Office, Windows, Azure, GitHub, and Dynamics are deeply embedded in business workflows worldwide. Ripping out an ERP or a productivity suite takes years and real money, so enterprise customers rarely leave, which should let Microsoft earn returns above its cost of capital for decades.
Structural growth from cloud + AI: Azure (~$75B revenue, ~30% growth) is one of only three hyperscale clouds, and the OpenAI partnership gives Microsoft a front-row seat in AI monetization. Consensus sees ~17% annual revenue growth through FY2028 with EPS growing even faster - rare for a company of this size.
The valuation finally makes sense: 21.4x forward earnings vs a 29.9x 5-year average and a PEG of 1.32 vs 2.24. Margins (EBIT 46.8%, net 39.3%) are above their historical averages, so the de-rating is not caused by a weaker business.
Disadvantages
The AI capex bet has to pay off: Free cash flow margin fell from a ~28.9% average to 22.91%, ROIC slipped from 25.8% to 22.7%, and P/FCF (40x) is not cheap. If AI demand disappoints, Microsoft has poured tens of billions into data centers with mediocre returns.
Negative momentum: The stock is down ~22% over the past year and ~18% YTD while the market debates AI monetization. Catching a falling knife is a real risk if the next few earnings reports show Azure deceleration.
Maturity in core franchises and competitive pressure: Office is a mature product with slowing subscription momentum; Microsoft has no meaningful mobile presence, and in its key growth markets it is not the leader - AWS leads cloud, Salesforce leads CRM, and Google/Amazon compete hard on AI.
Fair Price
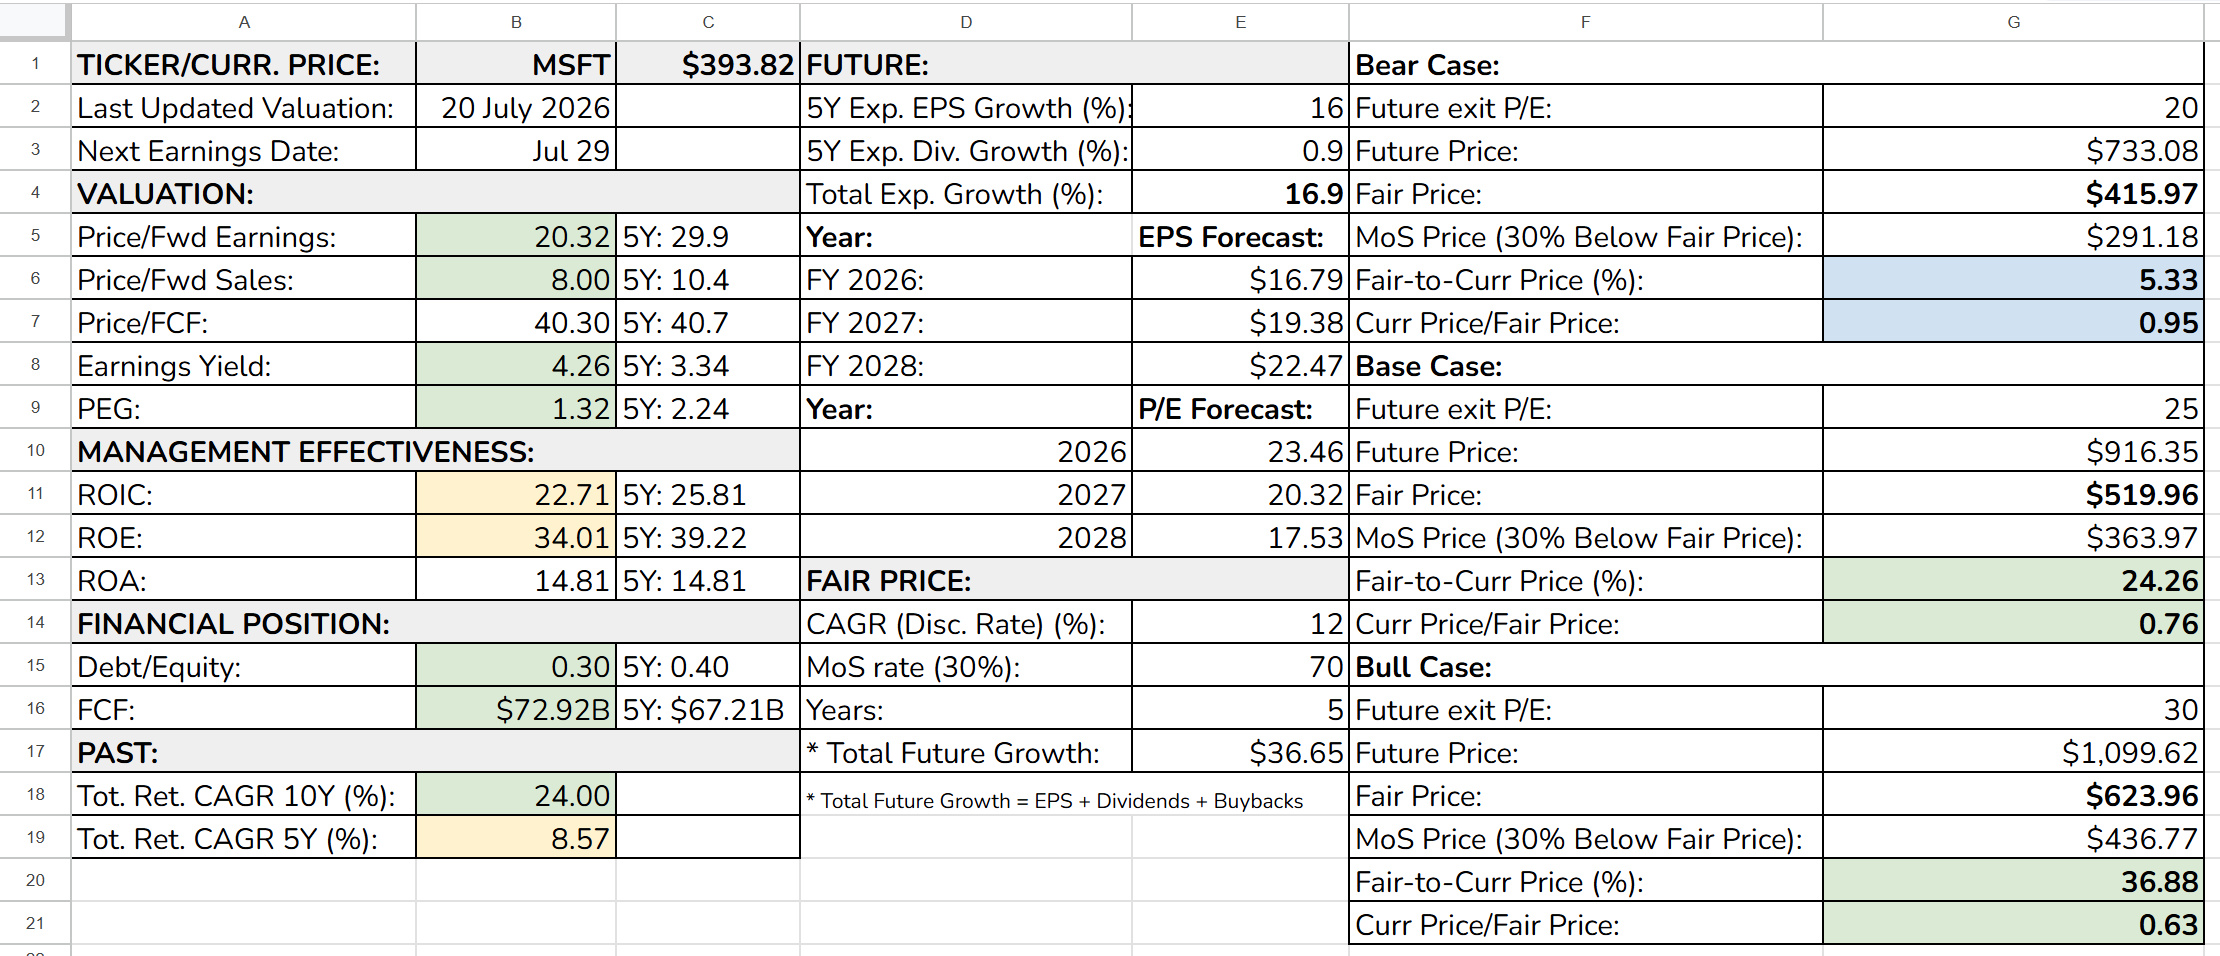
For Microsoft, I use 16% annual EPS growth, in line with consensus estimates through FY2028 plus ~0.9% from dividends, for a total expected growth of 16.9% a year. That turns FY2026 EPS of $16.79 into ~$36.65 by 2031.
The three exit multiples are not arbitrary: 20x is roughly today’s depressed multiple (the market never re-rates), 25x is a middle ground, and 30x is simply a return to Microsoft’s own 5-year average of 29.9x.
Bear case (exit P/E 20x): fair price $416 - MoS price $291
Base case (exit P/E 25x): fair price $520 - MoS price $364
Bull case (exit P/E 30x): fair price $624 - MoS price $437
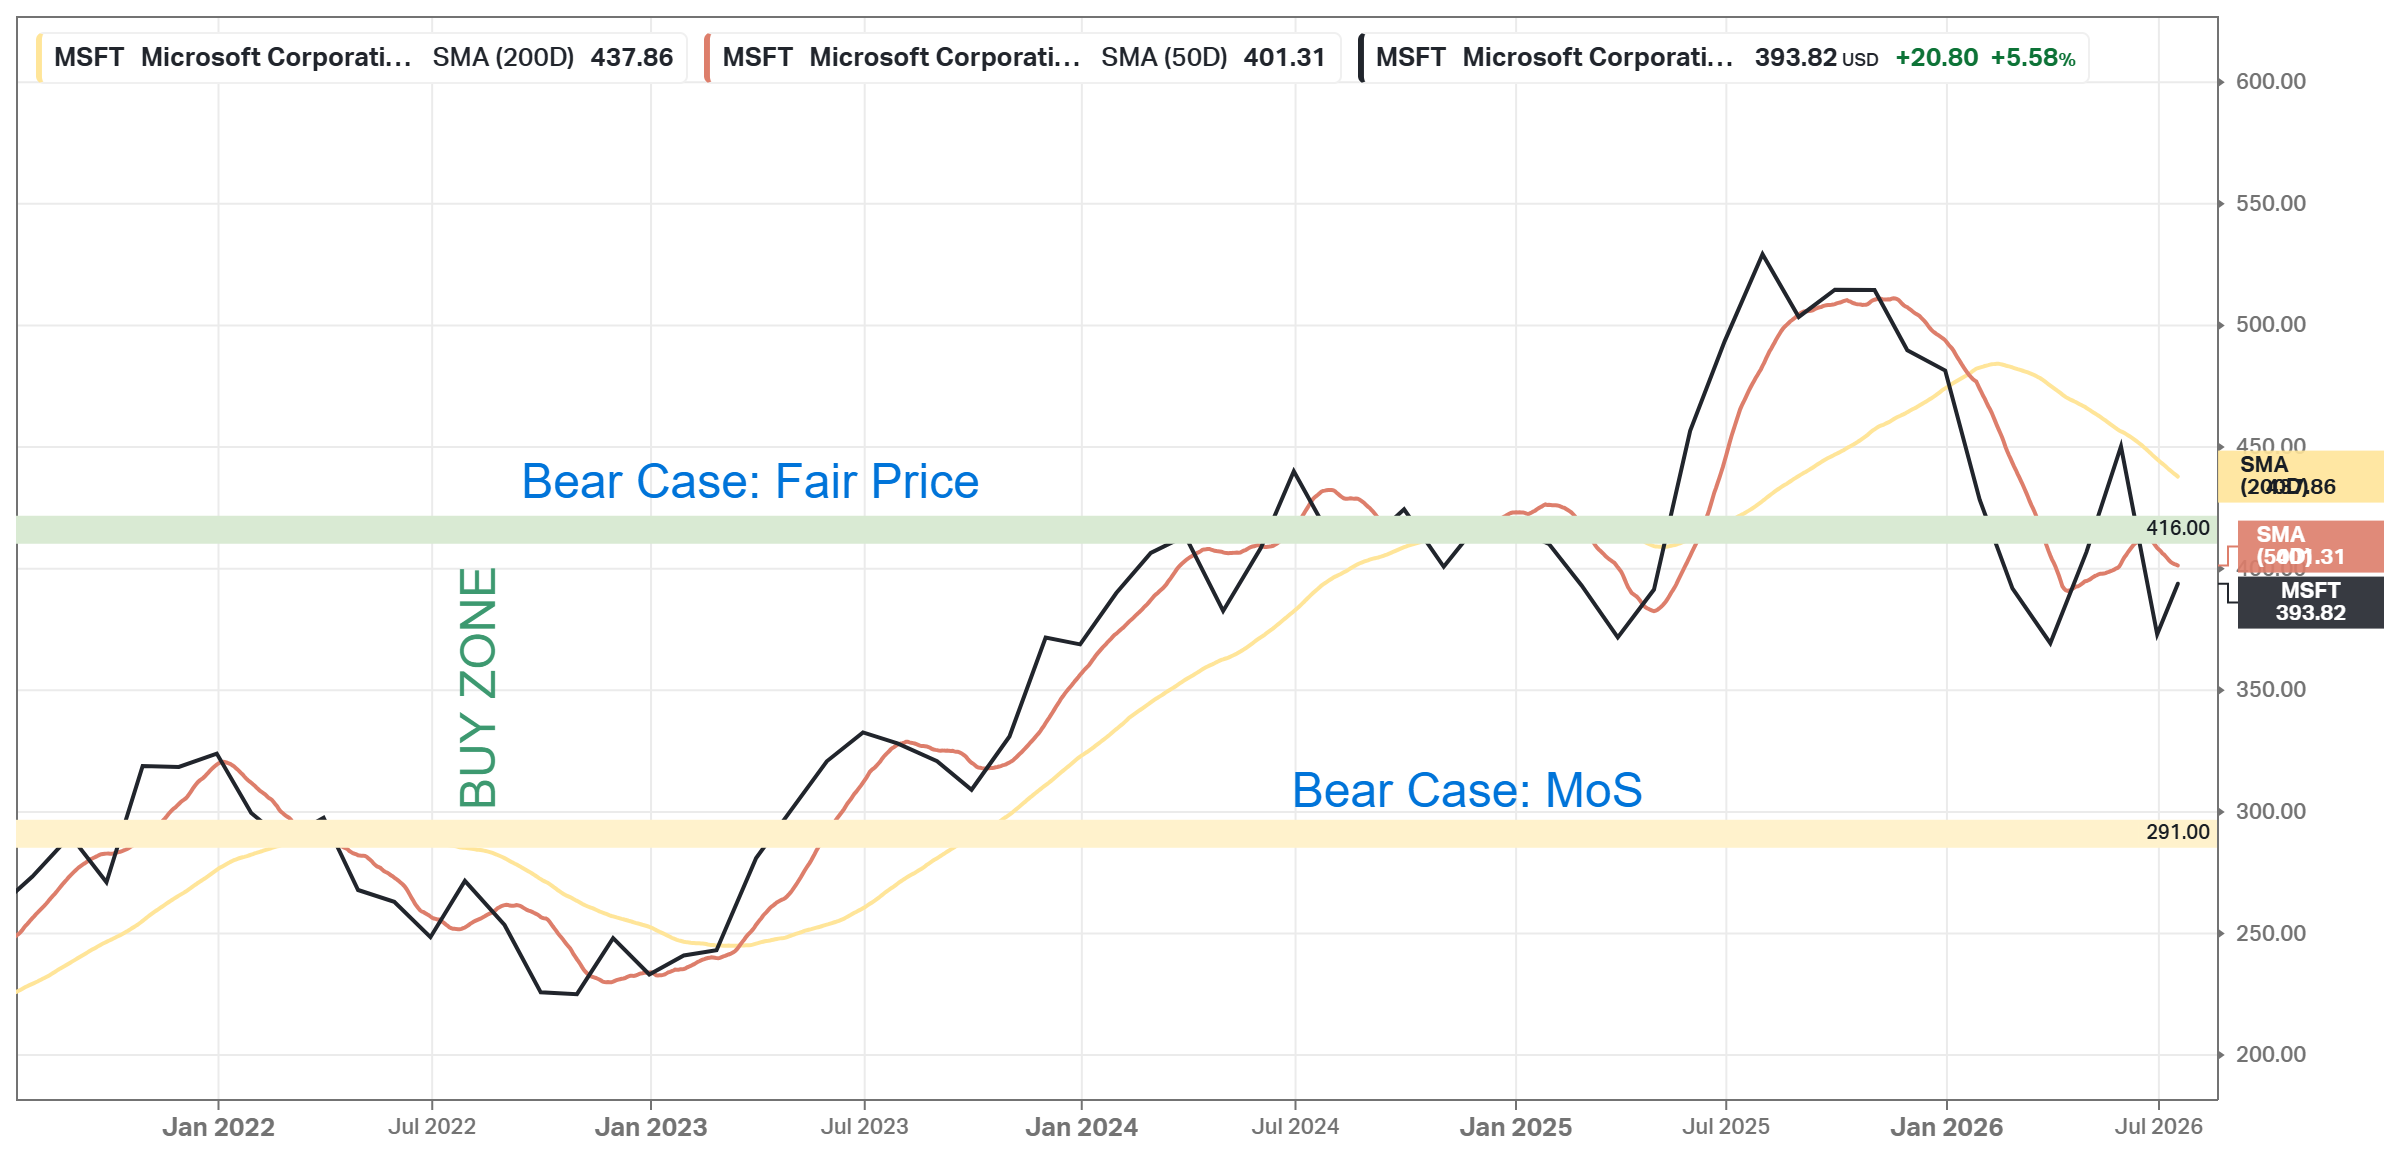
Note: At $394, the stock trades below fair value even in the bear case - you are effectively paying a price that assumes the multiple stays at its 5-year low forever while earnings keep compounding at 16%. In the base case, the stock trades ~24% below a $520 fair price.
The full margin-of-safety price of $364 is just above the $349 52-week low. The bear case MoS price ($291) and the bear case fair price ($416) form the accumulation zone.
Investment Thesis
A wide-moat compounder trading at its lowest forward multiple in five years - not because the business broke, but because AI-spending sentiment soured.
Revenue should grow ~17% a year through FY2028 and EPS ~16% (accelerating), margins are above their 5-year averages, and net debt is just ~$47B against ~$73B of annual FCF. Yet the stock has de-rated from 29.9x to 21.4x forward earnings, pulling the PEG from 2.24 to 1.32. The average target of $558.77 implies ~41% upside; even the lowest target ($400) is above the current price.
The bear case rests on one variable: the return on the AI capex wave, which depresses FCF margin (22.9% vs 28.9%) and ROIC (22.7% vs 25.8%). The risk is real, but it is a timing question, not an existential one - the spending builds capacity for Azure, still growing ~30% with visible demand, and management has a strong capital-allocation record. If capex normalizes and the FCF gap partly closes, today’s 40x P/FCF turns into low-30s at unchanged prices.
For a long-term portfolio, this is one of the highest-quality “buy the fear” opportunities in mega-cap tech: a market-like multiple (21.4x forward) for ~16% EPS growth plus a 21-year dividend-growth streak. The discipline required is patience through AI-capex noise and possible further short-term downside.
Accumulating at these levels, with room to add closer to the 52-week low, looks like favorable risk/reward.
META
TL;DR: Meta is the world’s largest social media company, monetizing nearly 4 billion users through advertising. After a flat year, the stock offers ~20% expected EPS growth at 19.8x forward earnings (below its 21.6x 5Y average) and a PEG of 1.01 vs a 1.55 norm - the main debate is whether the AI capex wave pays off. Verdict: a high-conviction core growth holding, with capex guidance as the key risk to watch. Base Case Fair Price: $1,142 - the stock trades ~43% below it; Buy Zone: $639-$913.
Overview
Next Earnings: Jul 29th, 2026, after-market (confirmed)
Sector: Communication Services
Industry: Interactive Media and Services
Beta (5Y Monthly): 1.25
Short Interest: 1.20%
Meta is the largest social media company in the world, with close to 4 billion monthly active users. The business is built on two segments:
Family of Apps: Facebook, Instagram, WhatsApp, Messenger, and Threads. This is the core business: users get free social products, and Meta monetizes their attention by selling highly targeted advertising. Years of investment in ad-targeting and content-recommendation algorithms (now supercharged by AI) keep improving advertisers’ return on ad spend, which lets Meta raise average revenue per user year after year. Newer surfaces like Reels, Stories, and Threads still carry ad loads below their potential, leaving room for further inventory growth. WhatsApp monetization (business messaging, click-to-message ads) is another lever that is still early.
Analyst’s Note:
Personally, I also use Threads 📱 It joins Instagram and Substack as my main social platform. And Pinterest still installed and frequently opened on my phone.
Reality Labs: Quest headsets, Ray-Ban Meta smart glasses, and the broader AR/VR platform bet. It loses billions of dollars a year, but it is the company’s long-term option on the next computing platform.
On top of that is the AI layer: the in-house Llama family of models and the Meta AI assistant embedded across all apps, plus one of the largest GPU fleets in the world. A recent development worth watching: in July 2026, it was reported that Meta is considering renting out excess AI compute capacity to external customers - the stock jumped ~10% on the news, since this would create a direct monetization path for the massive infrastructure spend. Meta has a wide economic moat built on network effects around its user base and intangible assets (user data and ad-targeting).
Main competitors: GOOGL, RDDT, SNAP, PINS, Tencent (700.HK), AMZN.
Financial Position
Market Cap: $1.73T
Total Debt: $86.77B
Cash & Investments: $81.18B
Enterprise Value: $1.74T
FCF (LTM): ~$48.3B
The balance sheet is essentially net-debt-free: $86.77B of debt against $81.18B of cash and investments, a net position of only ~$5.6B for a company generating ~$48B of free cash flow a year. One nuance: the debt paydown component of shareholder yield is -1.58%, meaning Meta is actively issuing debt - a deliberate choice to help fund the AI data-center buildout rather than a sign of stress.
Valuation (Current vs 5Y)
Price/Fwd Earnings: 19.8x vs 21.6x
Price/Fwd Sales: 6.6x vs 6.4x
Price/FCF: 35.8x vs 27.0x
PEG: 1.01 vs 1.55
Fwd Earnings Yield: 4.81% vs 4.63%
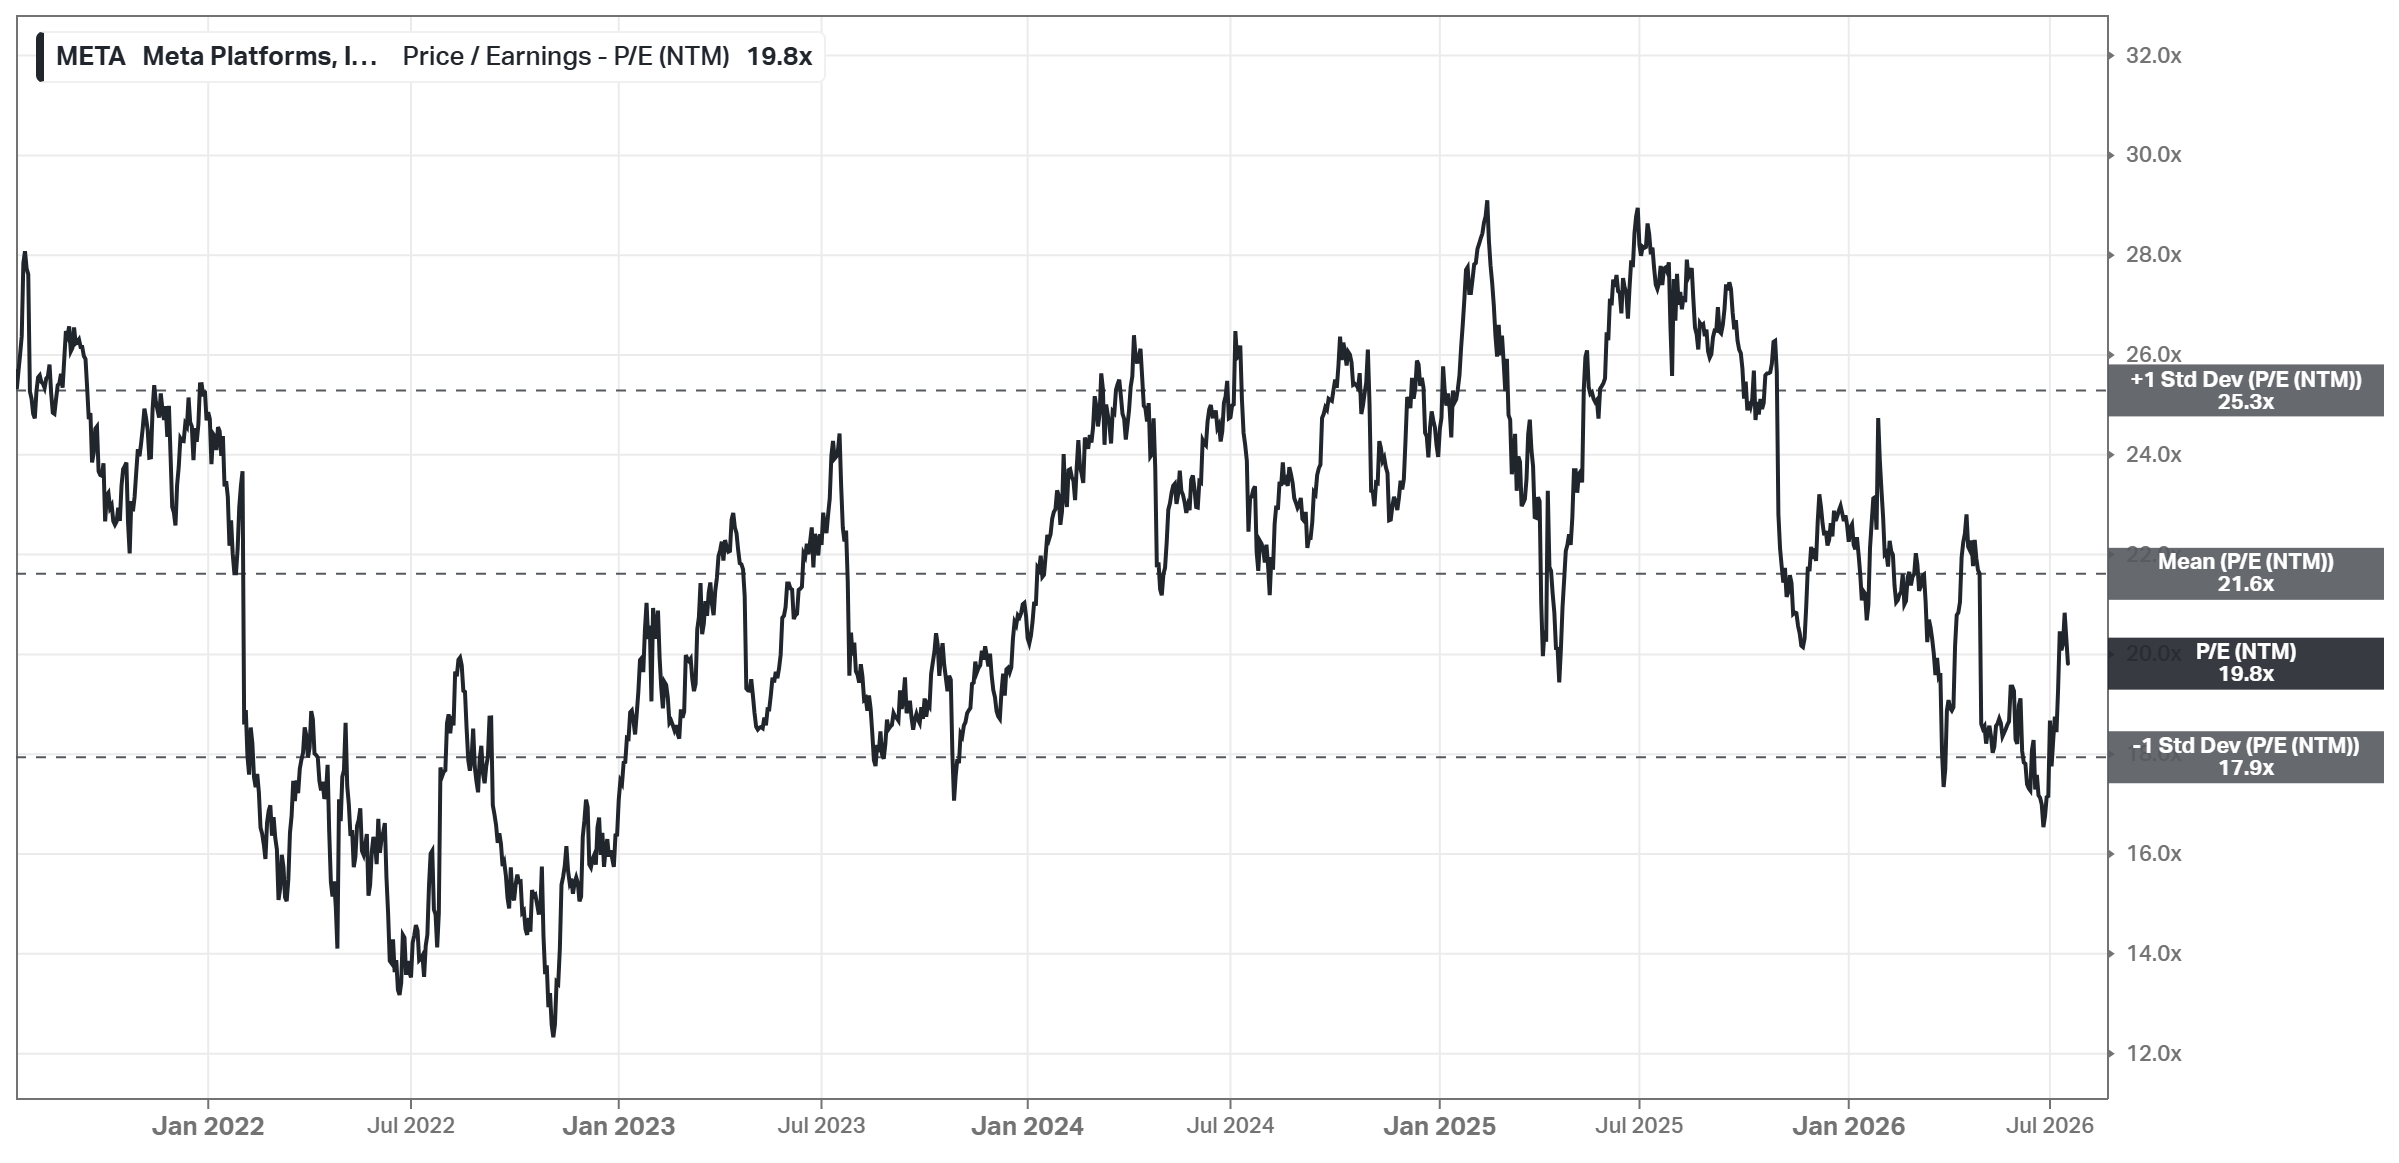
The headline P/E looks only “fair” (19.8x vs 21.6x average), but the PEG tells the real story: 1.01 vs a 1.55 average, because expected growth has accelerated while the multiple stayed flat. Growth at ~1x PEG is rare for a business of this quality. The one expensive-looking metric, P/FCF at 35.8x vs 27.0x, is inflated by AI capex eating free cash flow. On earnings power, the stock is cheap; on current cash conversion it is not.
Growth
EPS Fwd 5Y CAGR: 20.71% (5Y mean: 16.01%)
Price Est 1Y: $826.63, +21.33% upside
Analyst Rating: Strong Buy (8 Strong Buy/49 Buy/6 Hold/0 Sell)
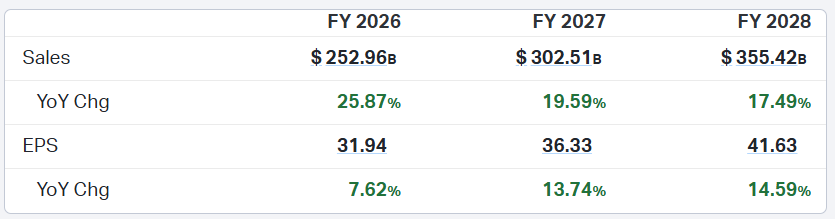
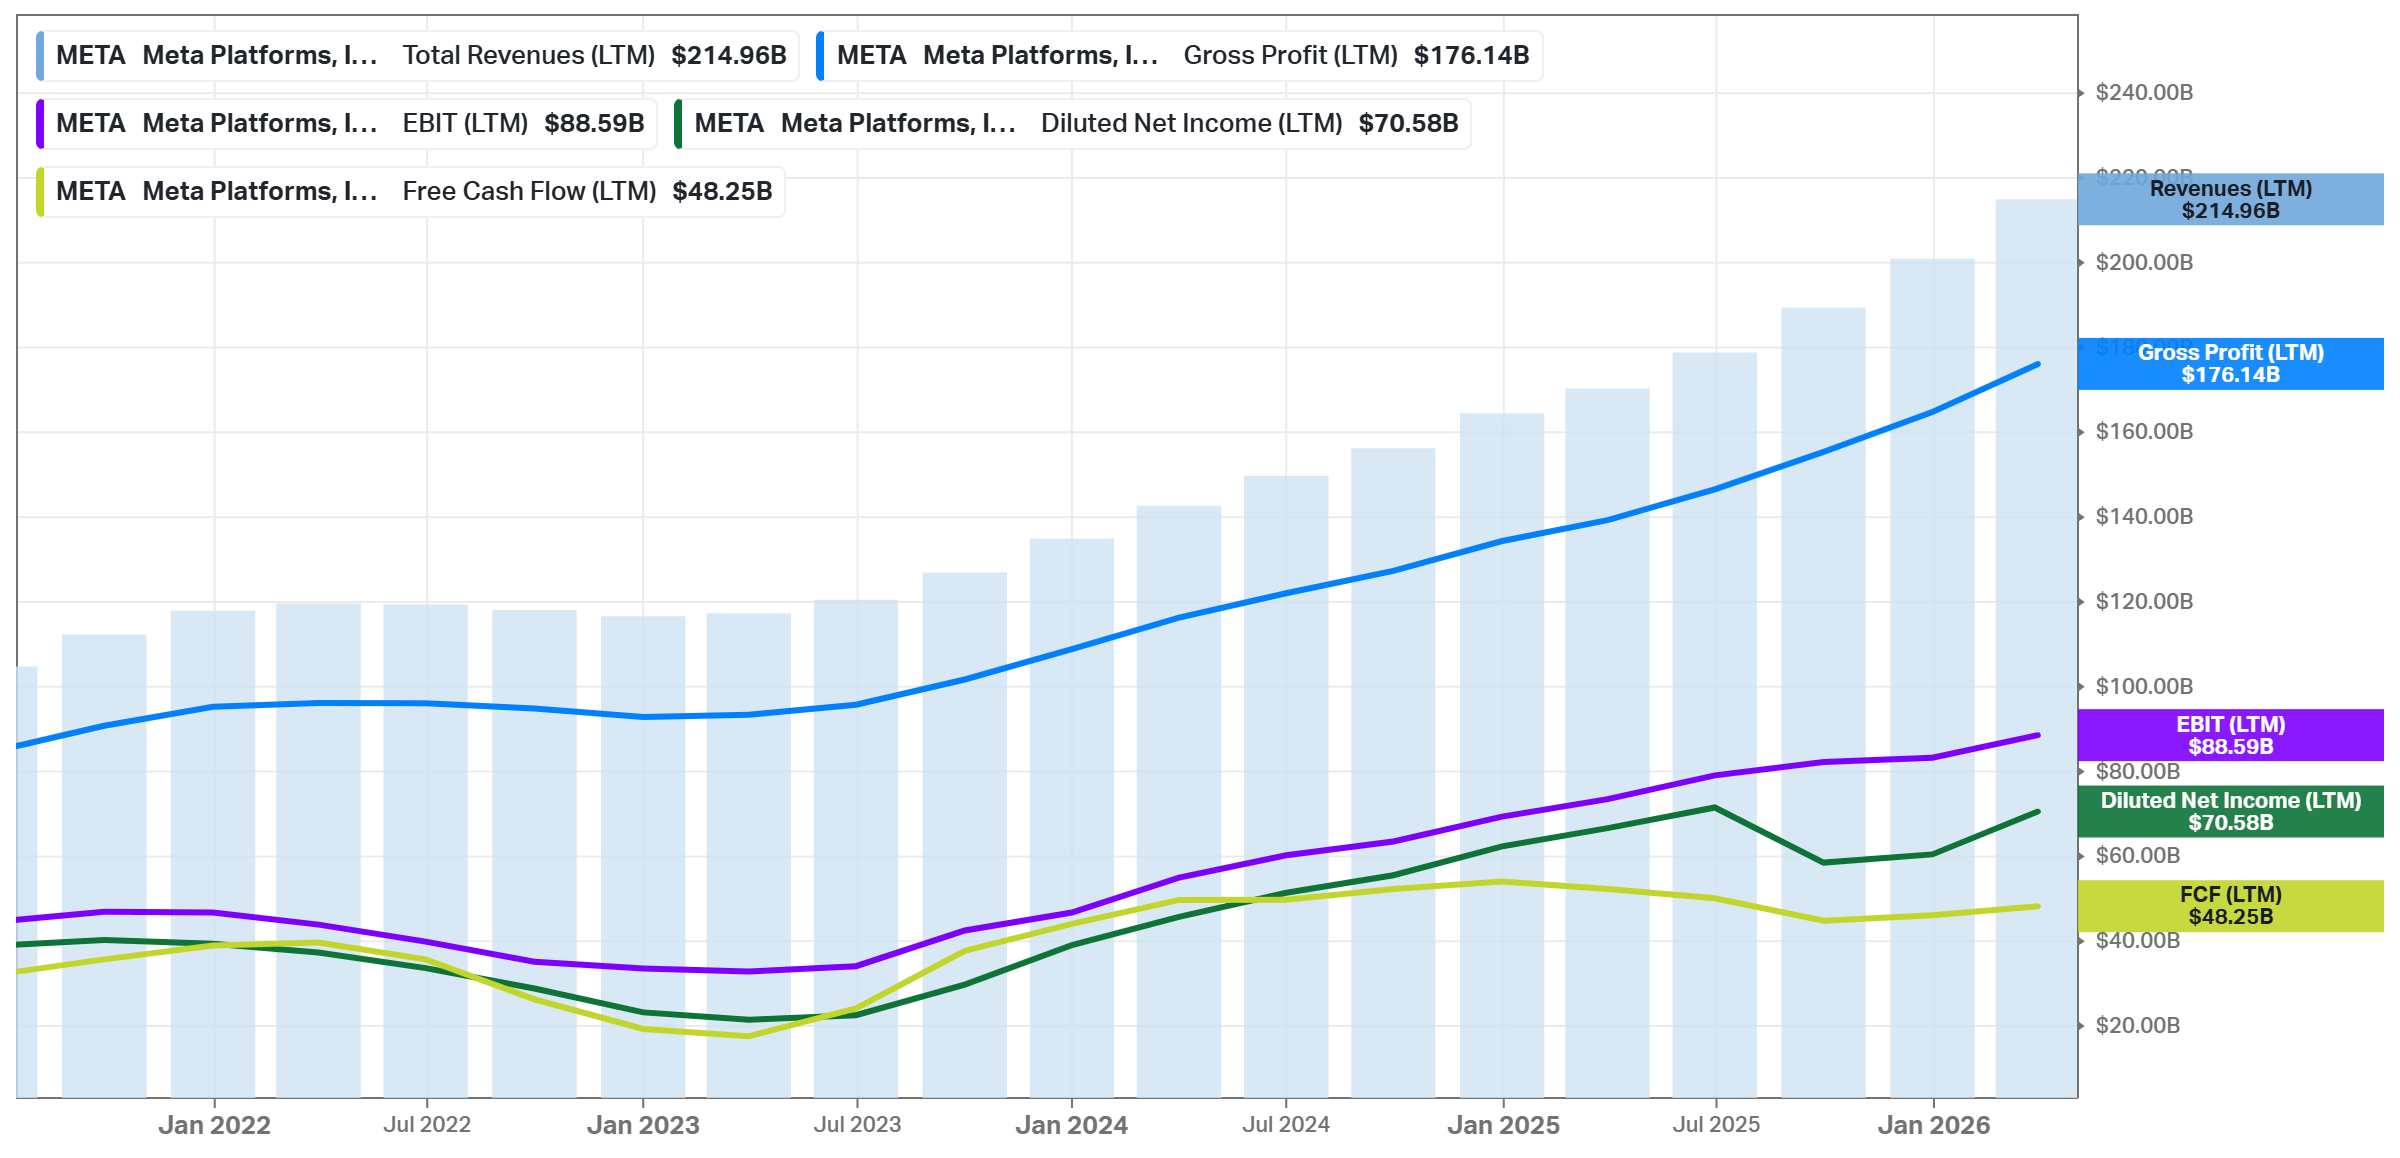
Look at the gap between the two lines: revenue is expected to grow ~26% this year, but EPS only +7.6% - that is the depreciation and opex from the AI buildout flowing through the income statement. Consensus then has EPS growth reaccelerating to ~14-15% as the spending curve flattens.
Management Effectiveness (Current vs 5Y)
ROIC: 22.09% vs 23.56%
ROE: 32.93% vs 29.58%
ROA: 16.39% vs 15.75%
ROE and ROA are above their 5-year averages - remarkable given how much capital the company is pouring into data centers. Only ROIC is slightly below average (22.1% vs 23.6%), reflecting the growing invested-capital base that has not started earning yet. All three metrics remain far above the cost of capital.
Margins (Current vs 5Y)
Gross Profit: 81.94% vs 80.95%
EBIT: 41.21% vs 37.34%
Net Income: 32.84% vs 30.27%
FCF: 22.45% vs 27.70%
Three of four margins are above their 5-year averages - an 82% gross margin and a 41% operating margin while absorbing multi-billion Reality Labs losses shows how absurdly profitable the core ad business is. The exception is again FCF margin (22.45% vs 27.70%), compressed by record capex. The 2022 “year of efficiency” reset is still paying off: the margin trend since 2023 is a steady climb.
Dividends
Yield: 0.31% (forward NTM: 0.32%)
Payout Ratio: 7.57%
Div Per Share: $0.525 quarterly ($2.10 annualized)
Div Growth: +3.70% (1Y); initiated in 2024, 1 consecutive annual increase so far
Total Shrhldr Yield: 0.55% (dividend 0.31% + buybacks 1.82% + debt paydown -1.58%)
The dividend is symbolic for now - a 7.6% payout ratio and a 0.31% yield. But that is exactly what the start of a long dividend-growth story looks like: the payout could grow 20%+ a year for a decade without straining cash flow. Buybacks (1.82% yield) remain the main return channel, partially offset by new debt issuance for the AI buildout.
Advantages
Unmatched scale and network effects in social media: Close to 4 billion people use Facebook, Instagram, WhatsApp, Messenger, or Threads every month. That scale produces ad-targeting data nobody else (except perhaps Google) can match, and it is self-reinforcing: users stay where other users are, advertisers go where users are.
Still-improving profitability: Gross margin 81.9%, EBIT margin 41.2% (vs 37.3% 5Y average), net margin 32.8%, ROE 32.9% - all above their historical averages even while Reality Labs burns billions a year. The core ad machine funds every experiment and still expands margins.
Growth at a reasonable price with AI optionality: PEG of 1.01 (vs 1.55 average) for ~20.7% expected EPS growth, plus free options: WhatsApp monetization, Threads ad load, Meta AI, smart glasses, and the potential sale of excess AI compute to external customers.
Disadvantages
The AI capex super-cycle strains cash flow: FCF margin fell from a 27.7% average to 22.45%, P/FCF is 35.8x vs a 27.0x norm, FY2026 EPS growth slows to +7.6%, and the company is issuing debt to fund data centers. If monetization of all that compute disappoints, returns on capital will keep sliding.
Regulatory and antitrust overhang: Meta faces a US monopoly case that could, in a worst case, force a breakup (separating Instagram or WhatsApp), plus constant privacy and content-regulation pressure in the EU and elsewhere. These are low-probability but high-impact risks.
Revenue concentration in cyclical advertising: Essentially all profit comes from ads, which are macro-sensitive; a meaningful chunk of recent growth came from Chinese cross-border retailers (Temu, Shein), whose spending can reverse quickly. Reality Labs losses, meanwhile, remain a multi-billion annual drag with no clear payoff date.
Fair Price
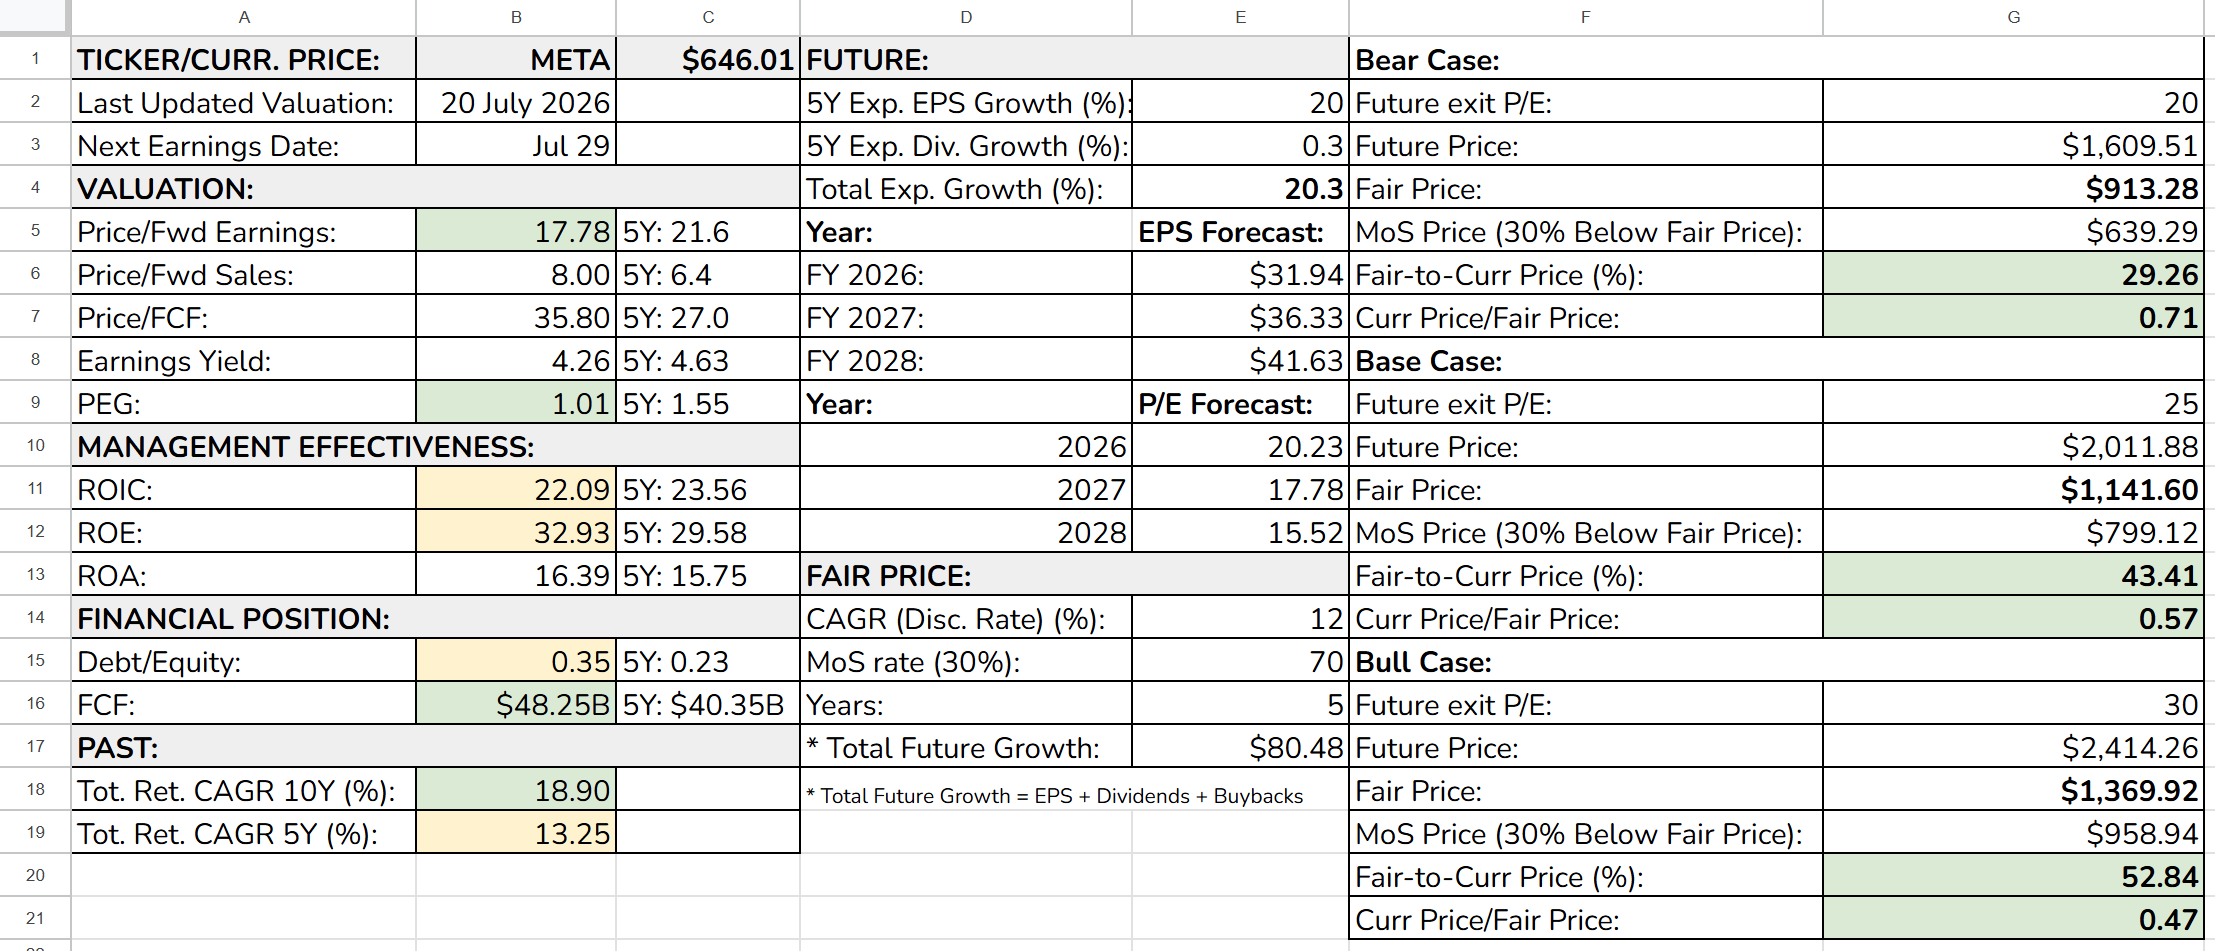
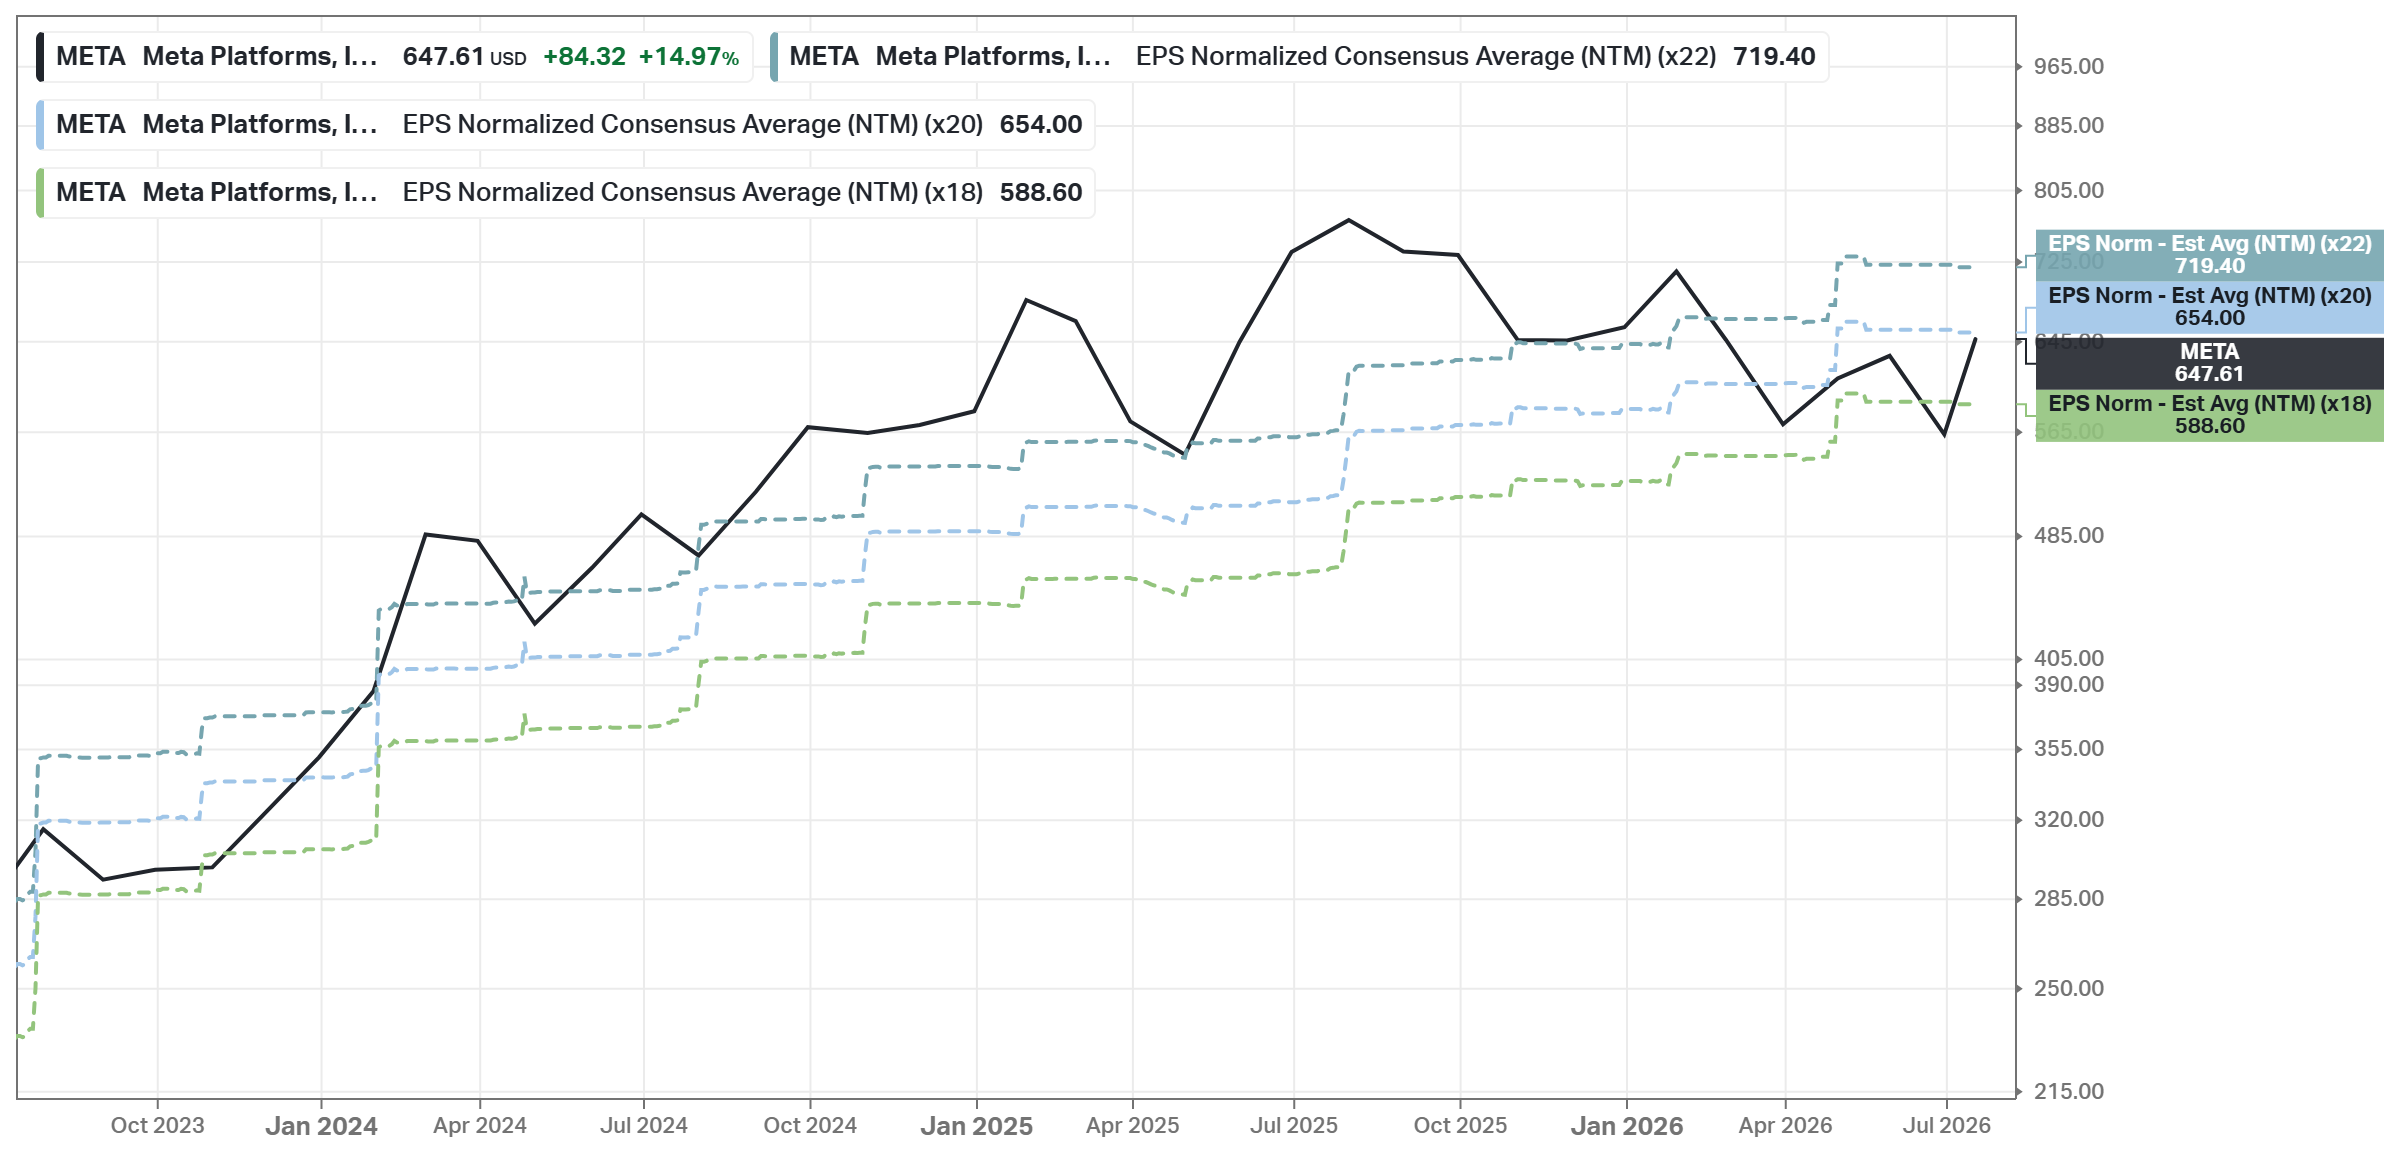
For Meta, I use 20% annual EPS growth, matching the 20.7% forward 5Y CAGR analysts expect, plus ~0.3% from the young dividend, for a total expected growth of 20.3% a year. That turns FY2026 EPS of $31.94 into ~$80.48 by 2031.
The exit multiples stay modest: 20x is below Meta’s own 5-year average of 21.6x (though a notch above today’s fear-priced 17.8x), 25x is a small premium that 20% growth would easily justify (a PEG of just 1.25), and even the bull case at 30x only asks for what the market routinely pays slower-growing mega-caps.
Bear case (exit P/E 20x): fair price $913 - MoS price $639
Base case (exit P/E 25x): fair price $1,142 - MoS price $799
Bull case (exit P/E 30x): fair price $1,370 - MoS price $959
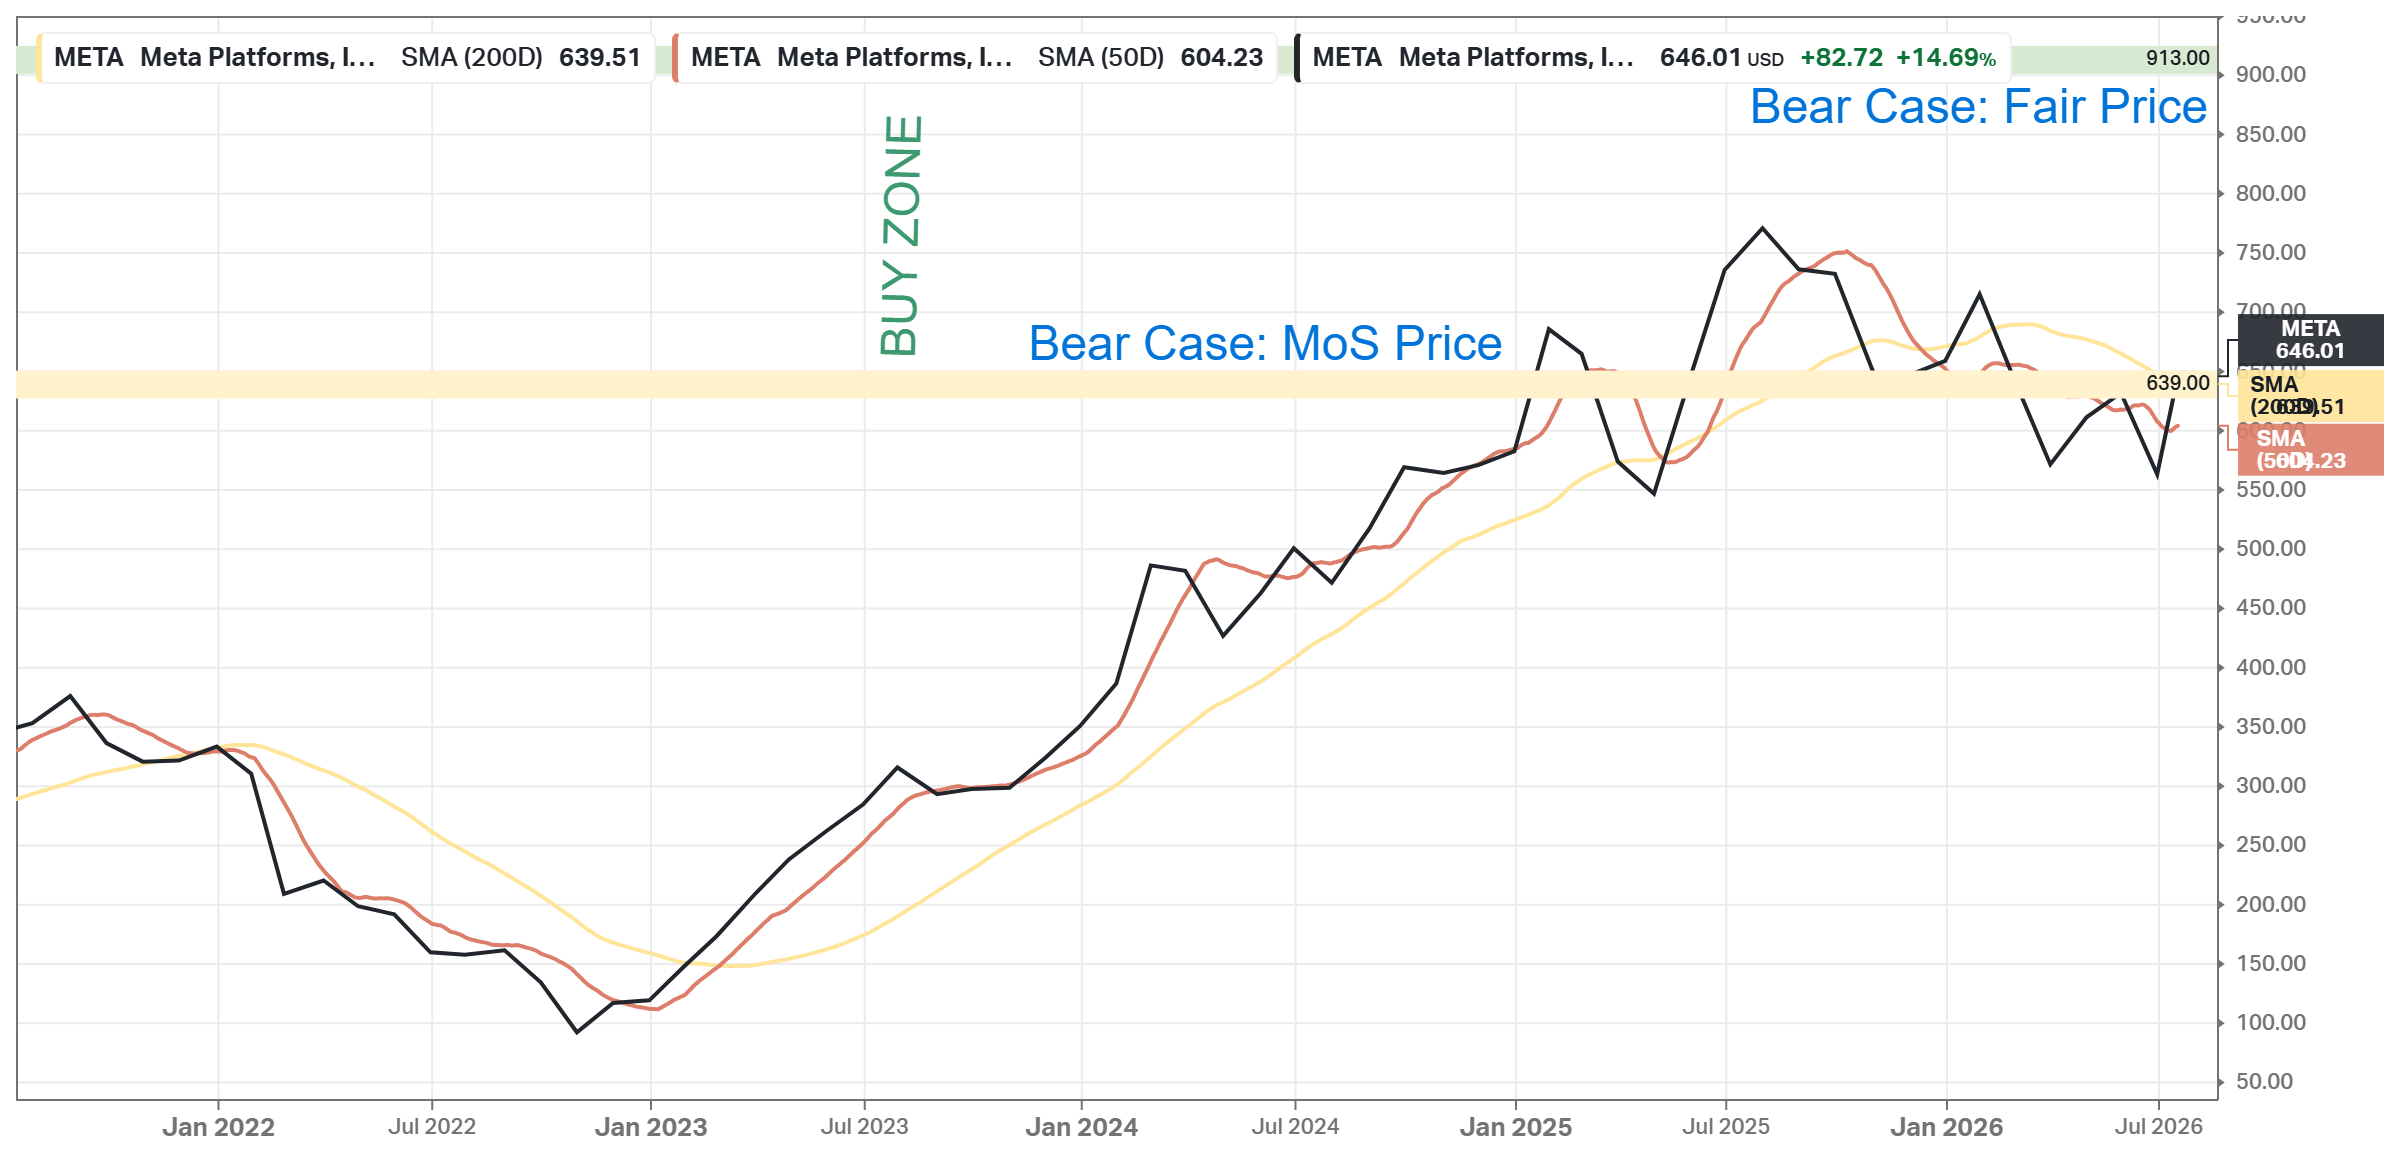
Note: At $646, the stock trades right at the bear-case MoS price of $639 - in other words, the market is already offering nearly the full 30% margin of safety on the pessimistic scenario. The base case implies a ~43% discount to a $1,142 fair price.
The multiple assumptions are conservative, but the 20% growth assumption is not - if the capex payoff disappoints and EPS grows at the near-term ~14% pace instead, fair value drops meaningfully. The bear case MoS price ($639) and the bear case fair price ($913) form the accumulation zone.
Investment Thesis
Meta is the rare mega-cap offering above-20% expected EPS growth at a market-average multiple. At 19.8x forward earnings, the stock trades below its own 5-year average (21.6x), while expected growth (20.7% fwd 5Y CAGR) beats its 16.0% norm - hence a PEG of 1.01 versus a 1.55 average, roughly 1x growth for one of the planet’s most profitable large businesses.
81.9% gross margin, 41.2% EBIT margin (above its 5-year average despite billions of Reality Labs losses), 32.9% ROE, a roughly net-cash-neutral balance sheet, and ~$48B of annual FCF. Revenue should grow ~26% this year and ~17-20% after.
The debate is capex. FCF margin is five points below its average, FY2026 EPS growth slows to +7.6% as depreciation bites, and management is issuing debt to keep building. But AI-driven ad targeting is already visibly working in the revenue line, and renting out excess compute could add a second business. The bet is whether AI pays off fast enough to justify 35.8x free cash flow today.
A high-conviction core holding for a growth-oriented long-term portfolio. ~20% expected EPS growth, a PEG of ~1, expanding operating margins, and unpriced options (WhatsApp, compute rental, smart glasses) outweigh the capex and regulatory risks at this price. The stock is 4% below a year ago while earnings kept compounding. Expect volatility around earnings (beta 1.25, capex guidance is the trigger), and treat any antitrust-driven selloff toward the low-$600s/high-$500s as a chance to add, not a reason to exit.
NVDA
TL;DR: Nvidia designs the GPUs and CUDA software that power essentially all AI computing. The stock is up ~24% in a year, yet trades at its cheapest relative valuation in five years - 20.7x forward earnings vs a 37.8x 5Y average and a PEG of 0.47, because earnings grew faster than the price. Verdict: own it as a core long-term AI-infrastructure position, but beta of 2.21 means 30-40% drawdowns can come. Base Case Fair Price: $361 - the stock trades ~44% below it; Buy Zone: $181-$258.
Overview
Next Earnings: Aug 26th, 2026, after-market (confirmed)
Sector: Information Technology
Industry: Semiconductors and Semiconductor Equipment
Beta (5Y Monthly): 2.21
Short Interest: 1.20%
Nvidia is the leading designer of graphics processing units (GPUs) and the dominant supplier of AI computing infrastructure. GPUs process data in parallel across thousands of cores, which turned out to be exactly what training and running large AI models requires - and Nvidia owns that market.
Data Center: The core of the company today. AI accelerators (Hopper, Blackwell, and now the Vera Rubin rack-scale production systems are getting ready for full operation), plus networking (InfiniBand, NVLink, Ethernet for AI clusters) that ties thousands of GPUs together. Customers are hyperscalers, AI labs, enterprises, and increasingly sovereign AI projects.
CUDA software platform: The proprietary layer on which virtually all AI development is built. Millions of developers and 15+ years of libraries create enormous switching costs; this is the moat as much as the chips themselves.
Gaming: GeForce RTX graphics cards, long considered the best in class for PC.
Newer bets: The RTX Spark “superchip” (Blackwell GPU + N1X/N1 CPU) announced at Computex 2026, taking Nvidia into the PC processor market against Intel and AMD in ~30 laptops and 10 desktops later this year; automotive (DRIVE platform); Jetson edge-AI modules; Omniverse simulation; and professional visualization.
Nvidia has a wide economic moat built on intangible assets in GPU design and switching costs around CUDA.
Main competitors: AMD, AVGO (custom AI ASICs), INTC, plus the hyperscalers’ in-house chips; MSFT and MU are adjacent players in the ecosystem.
Financial Position
Market Cap: $5.15T
Total Debt: $12.81B
Cash & Investments: $53.17B
Enterprise Value: $5.11T
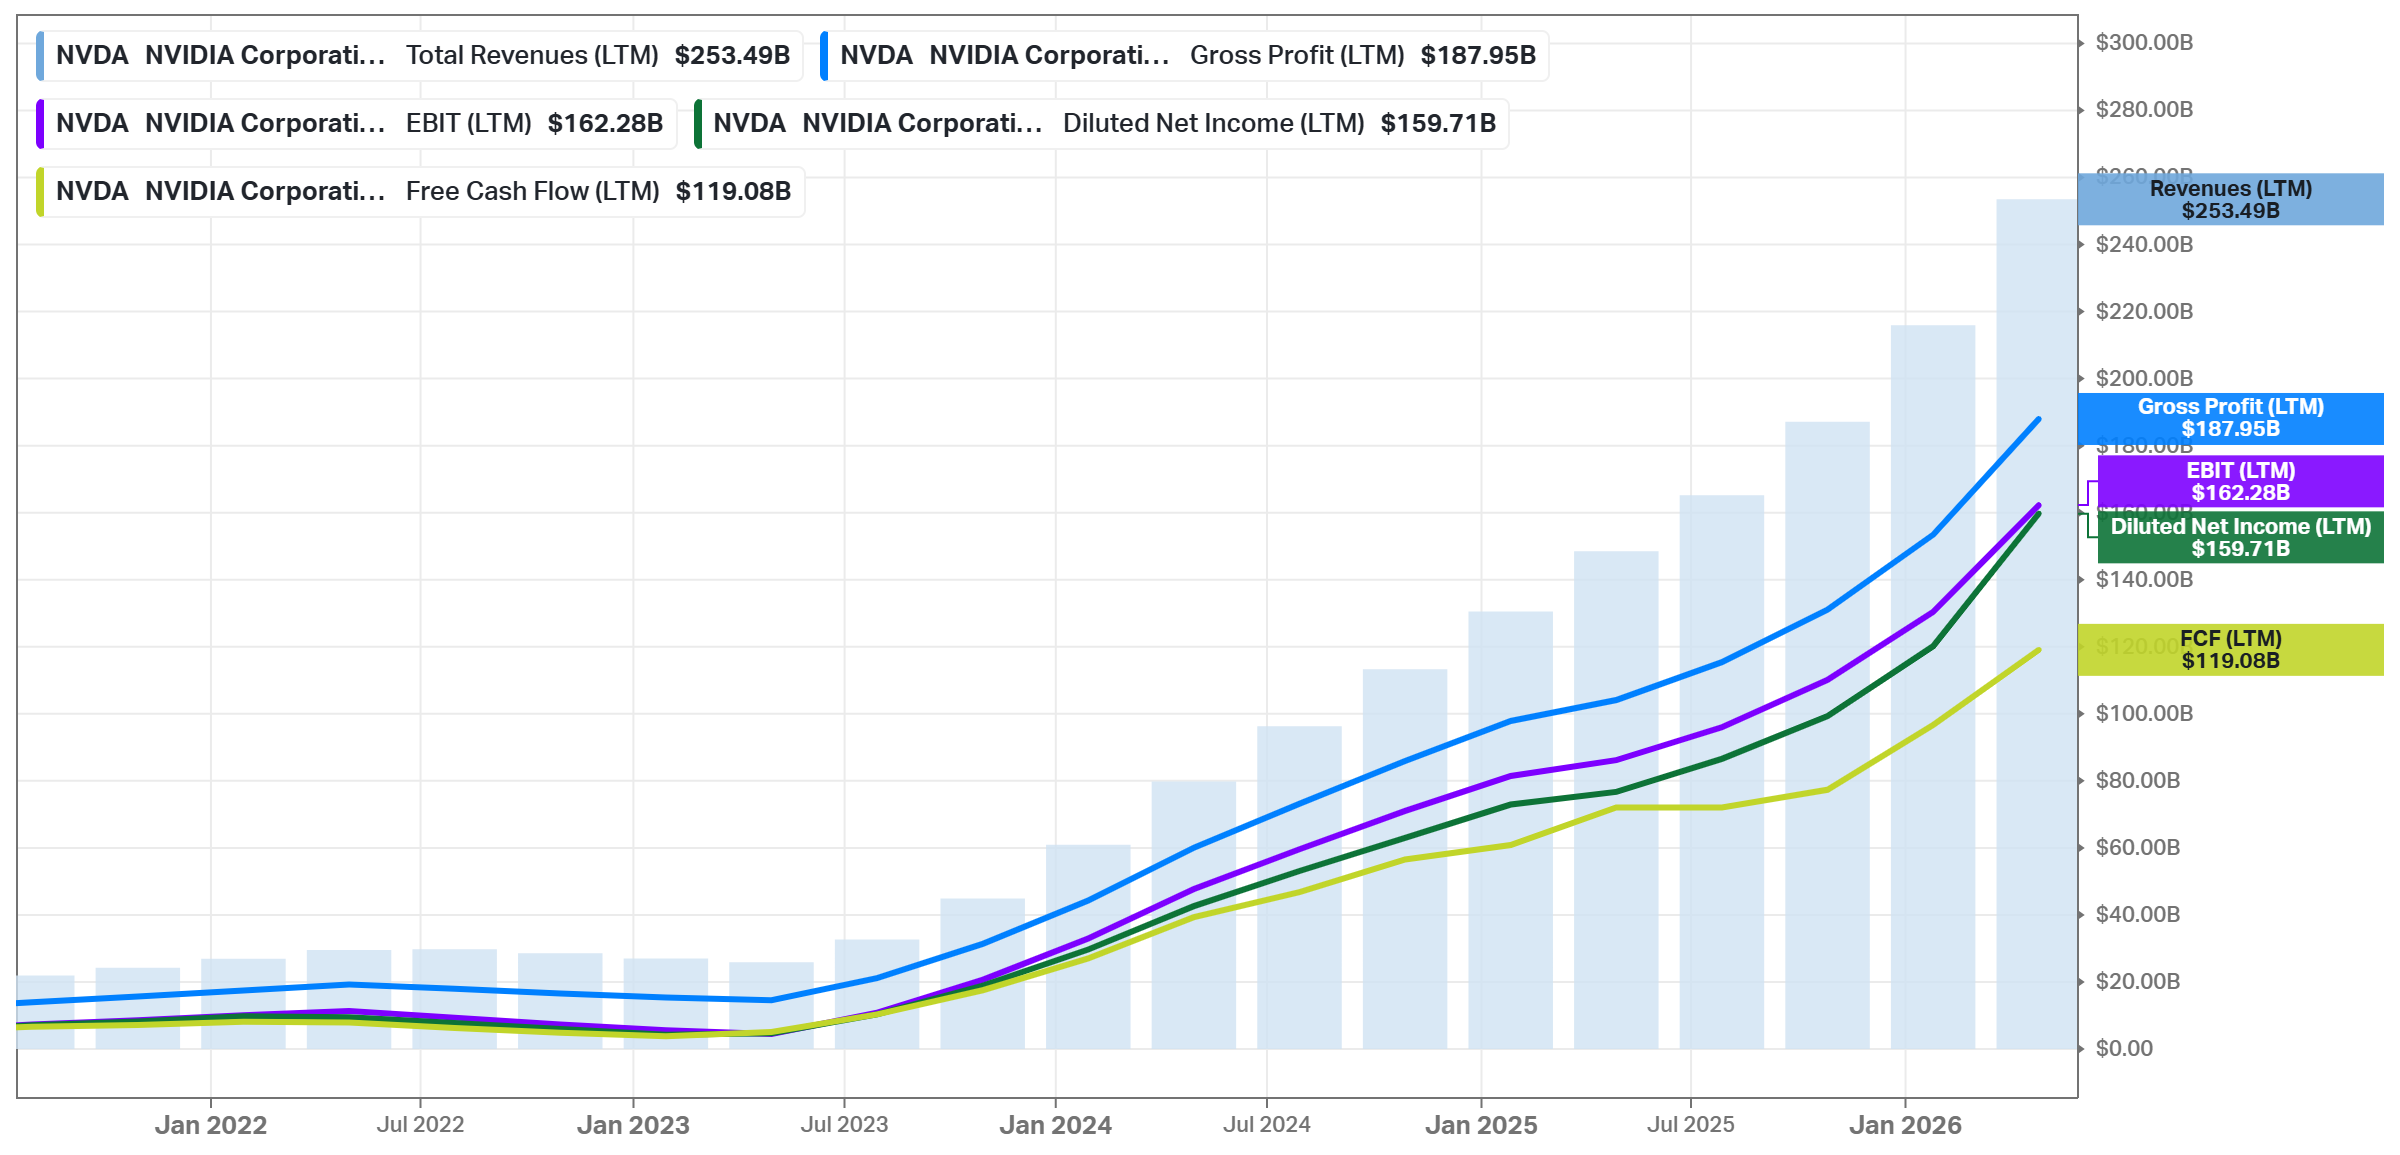
FCF (LTM): ~$119B
~$40B of net cash and ~$119B of annual free cash flow. Nvidia funds its entire R&D and buyback program from operations and still piles up cash. Unlike its hyperscaler customers, it carries essentially no capex burden - it designs chips, TSMC builds them.
Valuation (Current vs 5Y)
Price/Fwd Earnings: 20.7x vs 37.8x
Price/Fwd Sales: 11.8x vs 17.6x
Price/FCF: 43.2x vs 81.6x
PEG: 0.47 vs 1.28
Fwd Earnings Yield: 4.69% vs 2.65%
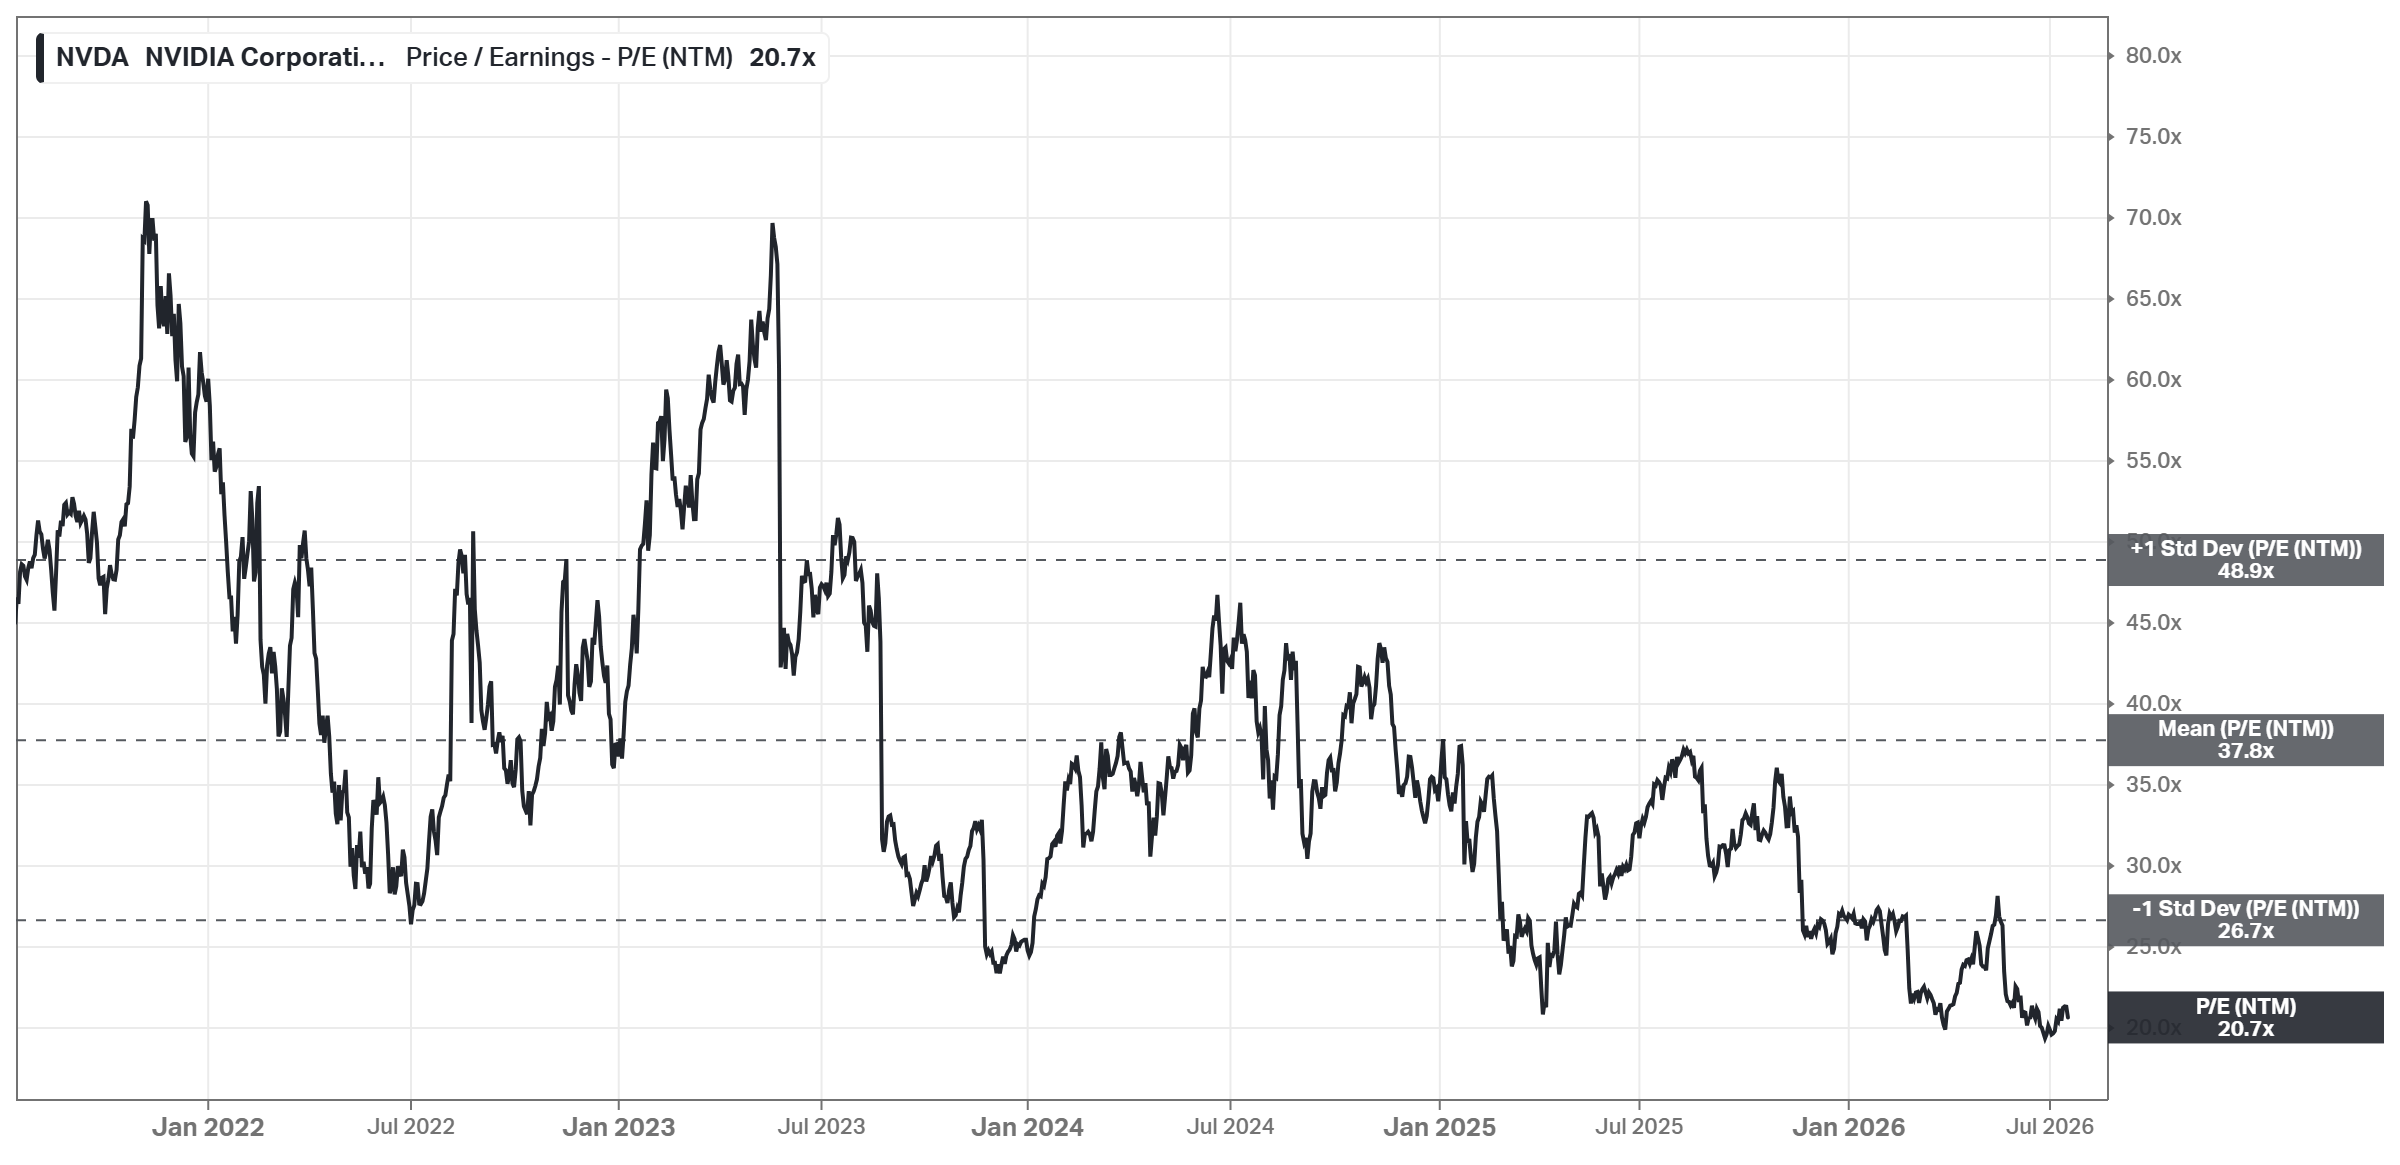
This is the paradox: the stock is up ~24% in a year, yet every multiple is far below its 5-year average - forward P/E of 20.7x is below even the -1 standard deviation band (26.7x). Earnings have simply grown much faster than the price. A PEG of 0.47 means the market pays less than half a unit of valuation per unit of expected growth; either consensus growth is badly wrong, or the stock is cheap.
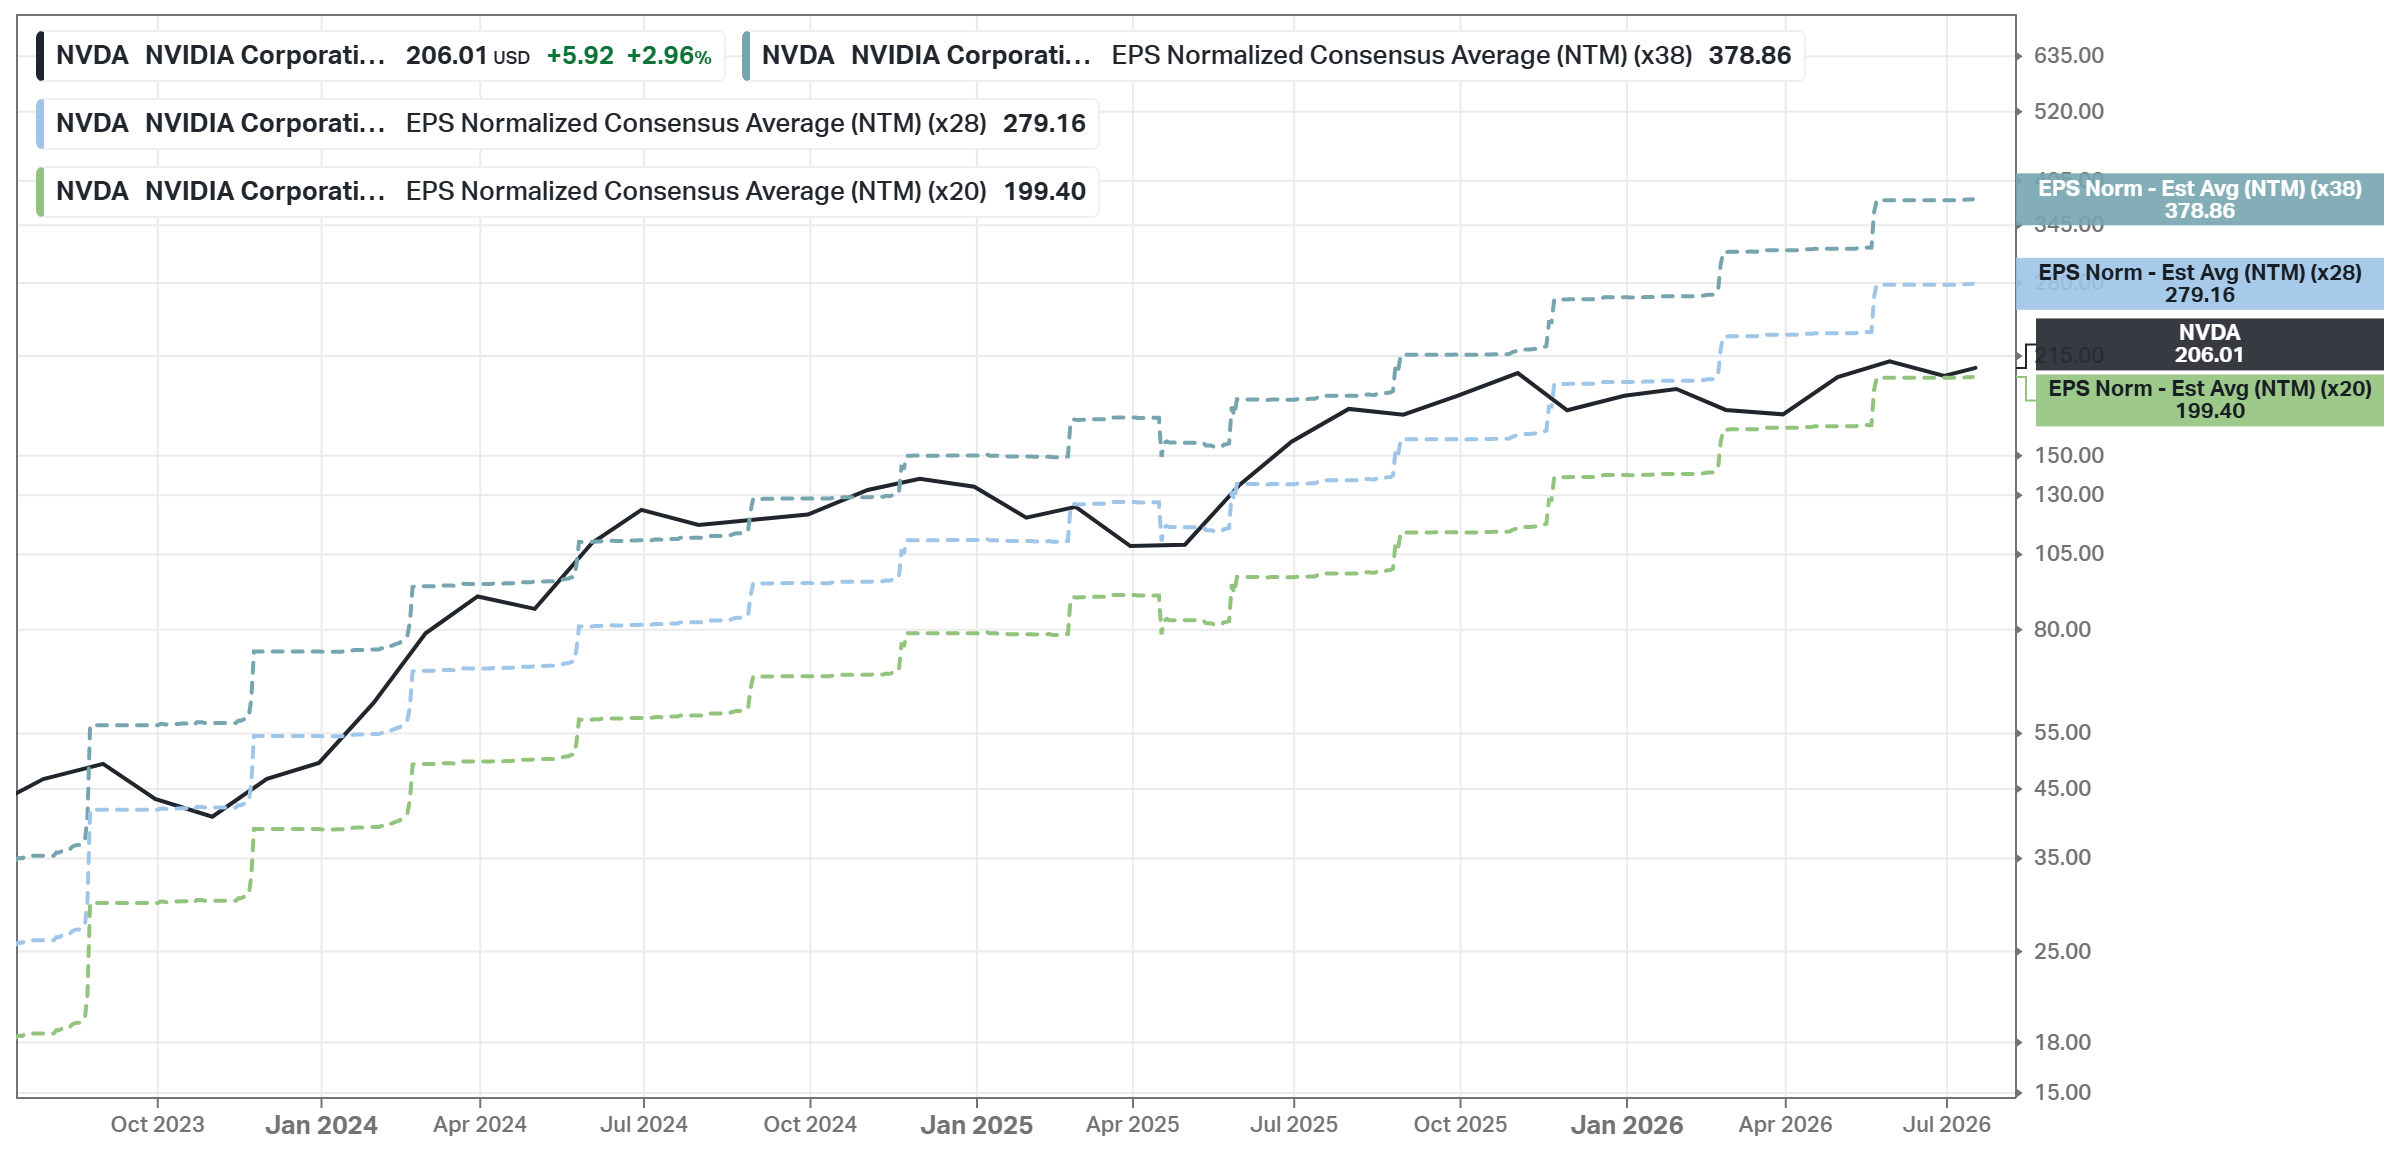
Growth
EPS Fwd 5Y CAGR: 45.11% (5Y mean: 28.84%)
Price Estimates 1Y: $301.97, +42.10% upside
Analyst Rating: Strong Buy (10 Strong Buy/48 Buy/2 Hold/1 Sell)
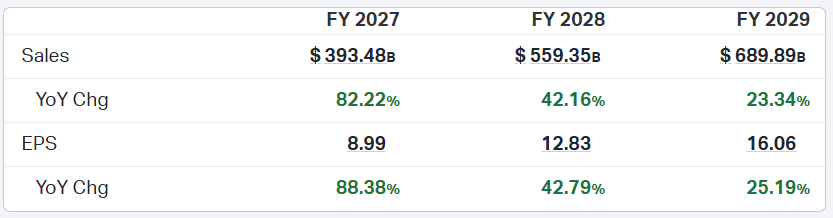
Consensus expects Nvidia to add roughly $290B of annual revenue in two years - more than the total revenue of almost any other tech company. Growth is decelerating in percentage terms (+82% → +42% → +23%), which is normal at this size. Management expects $3-4 trillion of annual AI infrastructure spending by 2030.
Management Effectiveness (Current vs 5Y)
ROIC: 70.27% vs 50.73%
ROE: 114.29% vs 75.07%
ROA: 52.73% vs 33.55%
These numbers barely look real: a 70% return on invested capital and a 114% return on equity, both far above their already-extreme 5-year averages. The asset-light model (design here, manufacture at TSMC) means nearly every incremental dollar of demand converts to profit without heavy capital investment. There is no large-cap company in the world with comparable capital efficiency.
Margins (Current vs 5Y)
Gross Profit: 74.15% vs 67.72%
EBIT: 64.02% vs 45.94%
Net Income: 62.97% vs 41.71%
FCF: 46.97% vs 36.17%
All four margins are dramatically above their 5-year averages. A 63% net margin means Nvidia keeps 63 cents of every revenue dollar as profit - software-company economics on hardware volumes, only possible while demand outpaces supply and pricing power holds. This is also the main thing to watch: any sign of margin normalization (competition from AMD/custom ASICs, supply catching up) hits EPS twice - through growth and through margin.
Dividends
Yield: 0.47% (forward NTM: 0.47%)
Payout Ratio: 0.61%
Div Per Share: $0.25 quarterly ($1.00 annualized)
Total Shrhldr Yield: 1.05% (dividend 0.13% + buybacks 1.03%)
Until this spring, the dividend was symbolic ($0.01/quarter); the May 2026 raise to $0.25 was a 25-fold jump and still consumes only 0.61% of earnings - effectively zero. This is a statement of confidence, not an income proposition. Buybacks remain the main capital-return channel, and with a sub-1% payout ratio the runway for future dividend growth is basically unlimited.
Advantages
De facto monopoly on AI compute: Nvidia’s GPUs plus CUDA form the default platform for AI training and inference; switching costs are so high that even hyperscalers designing their own chips keep buying Nvidia at scale. Networking (InfiniBand/NVLink) deepens the lock-in at cluster level, and new fronts (PCs via RTX Spark, robotics via Jetson) keep opening.
Unmatched financial profile: 74% gross margin, 63% net margin, 70% ROIC, ~$119B FCF, ~$40B net cash - all margin and return metrics are far above their own 5-year averages. Nobody else converts demand into cash this efficiently.
Hypergrowth priced as a mature company: 20.7x forward earnings (vs 37.8x average) for ~45% expected EPS growth gives a PEG of 0.47 - the cheapest the stock has been relative to its growth in five years, with a +42% average analyst target on top.
Disadvantages
Extreme customer concentration and cyclicality: A handful of hyperscalers and AI labs generate most data-center revenue, and every one of them is actively developing in-house silicon to reduce dependence on Nvidia. If AI capex ever pauses - because returns on AI investment disappoint - the same operating leverage that created 63% margins works brutally in reverse.
Geopolitics: Export controls have largely cut Nvidia off from the Chinese AI market, Taiwan (TSMC) concentration is a single point of manufacturing failure, and the AI supply chain is in the middle of US-China tensions. These risks are real, binary, and outside management’s control.
Peak-margin risk: Consensus extrapolates 74% gross margins and continued dominance years forward. AMD’s accelerators, Broadcom’s custom ASICs, and customers’ own chips all target exactly this profit pool; even modest share or pricing erosion would compound with decelerating growth (+82% → +23% by FY2029) to make today’s “cheap” multiples look less cheap.
Fair Price
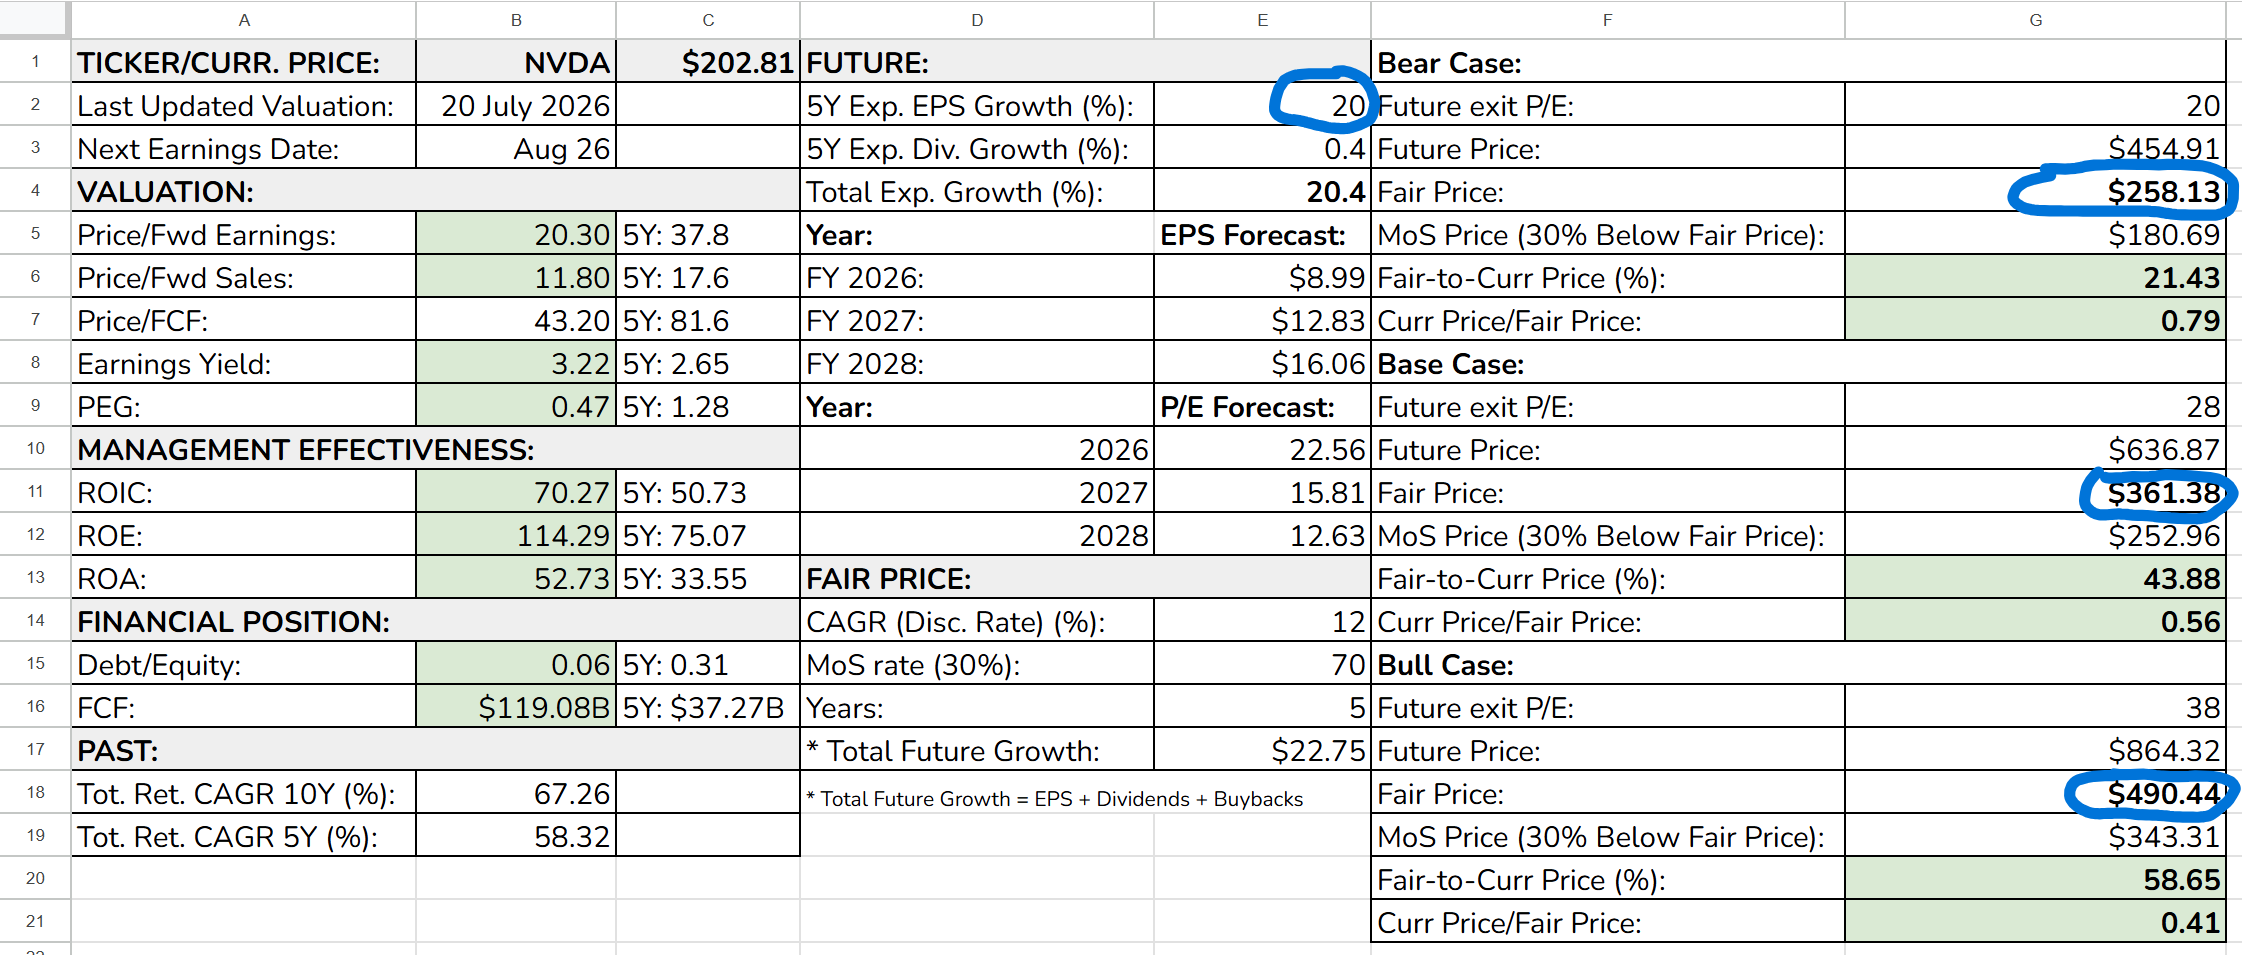
For Nvidia, I use 20% annual EPS growth - and that is not a forecast; it is a rule: 20% is the maximum growth rate I ever plug into this model, no matter what the estimates say. Consensus expects a 45% forward 5Y CAGR, and the FY2026-2028 estimates imply ~34% a year, but Nvidia’s estimates are also the most fragile on this page, so the model should not need them to be right. With ~0.4% from dividends, total expected growth is 20.4% a year, turning FY2026 EPS of $8.99 into ~$22.75 by 2031.
The exit multiples are the same 20x/28x/38x as the Fair Value Corridor chart, so the two methods line up: 20x is roughly today’s forward multiple (the market never re-rates), 28x is still below the -1 standard deviation band of recent years, and the bull case at 38x is simply Nvidia’s own 5-year average.
Bear case (exit P/E 20x): fair price $258 - MoS price $181
Base case (exit P/E 28x): fair price $361 - MoS price $253
Bull case (exit P/E 38x): fair price $490 - MoS price $343
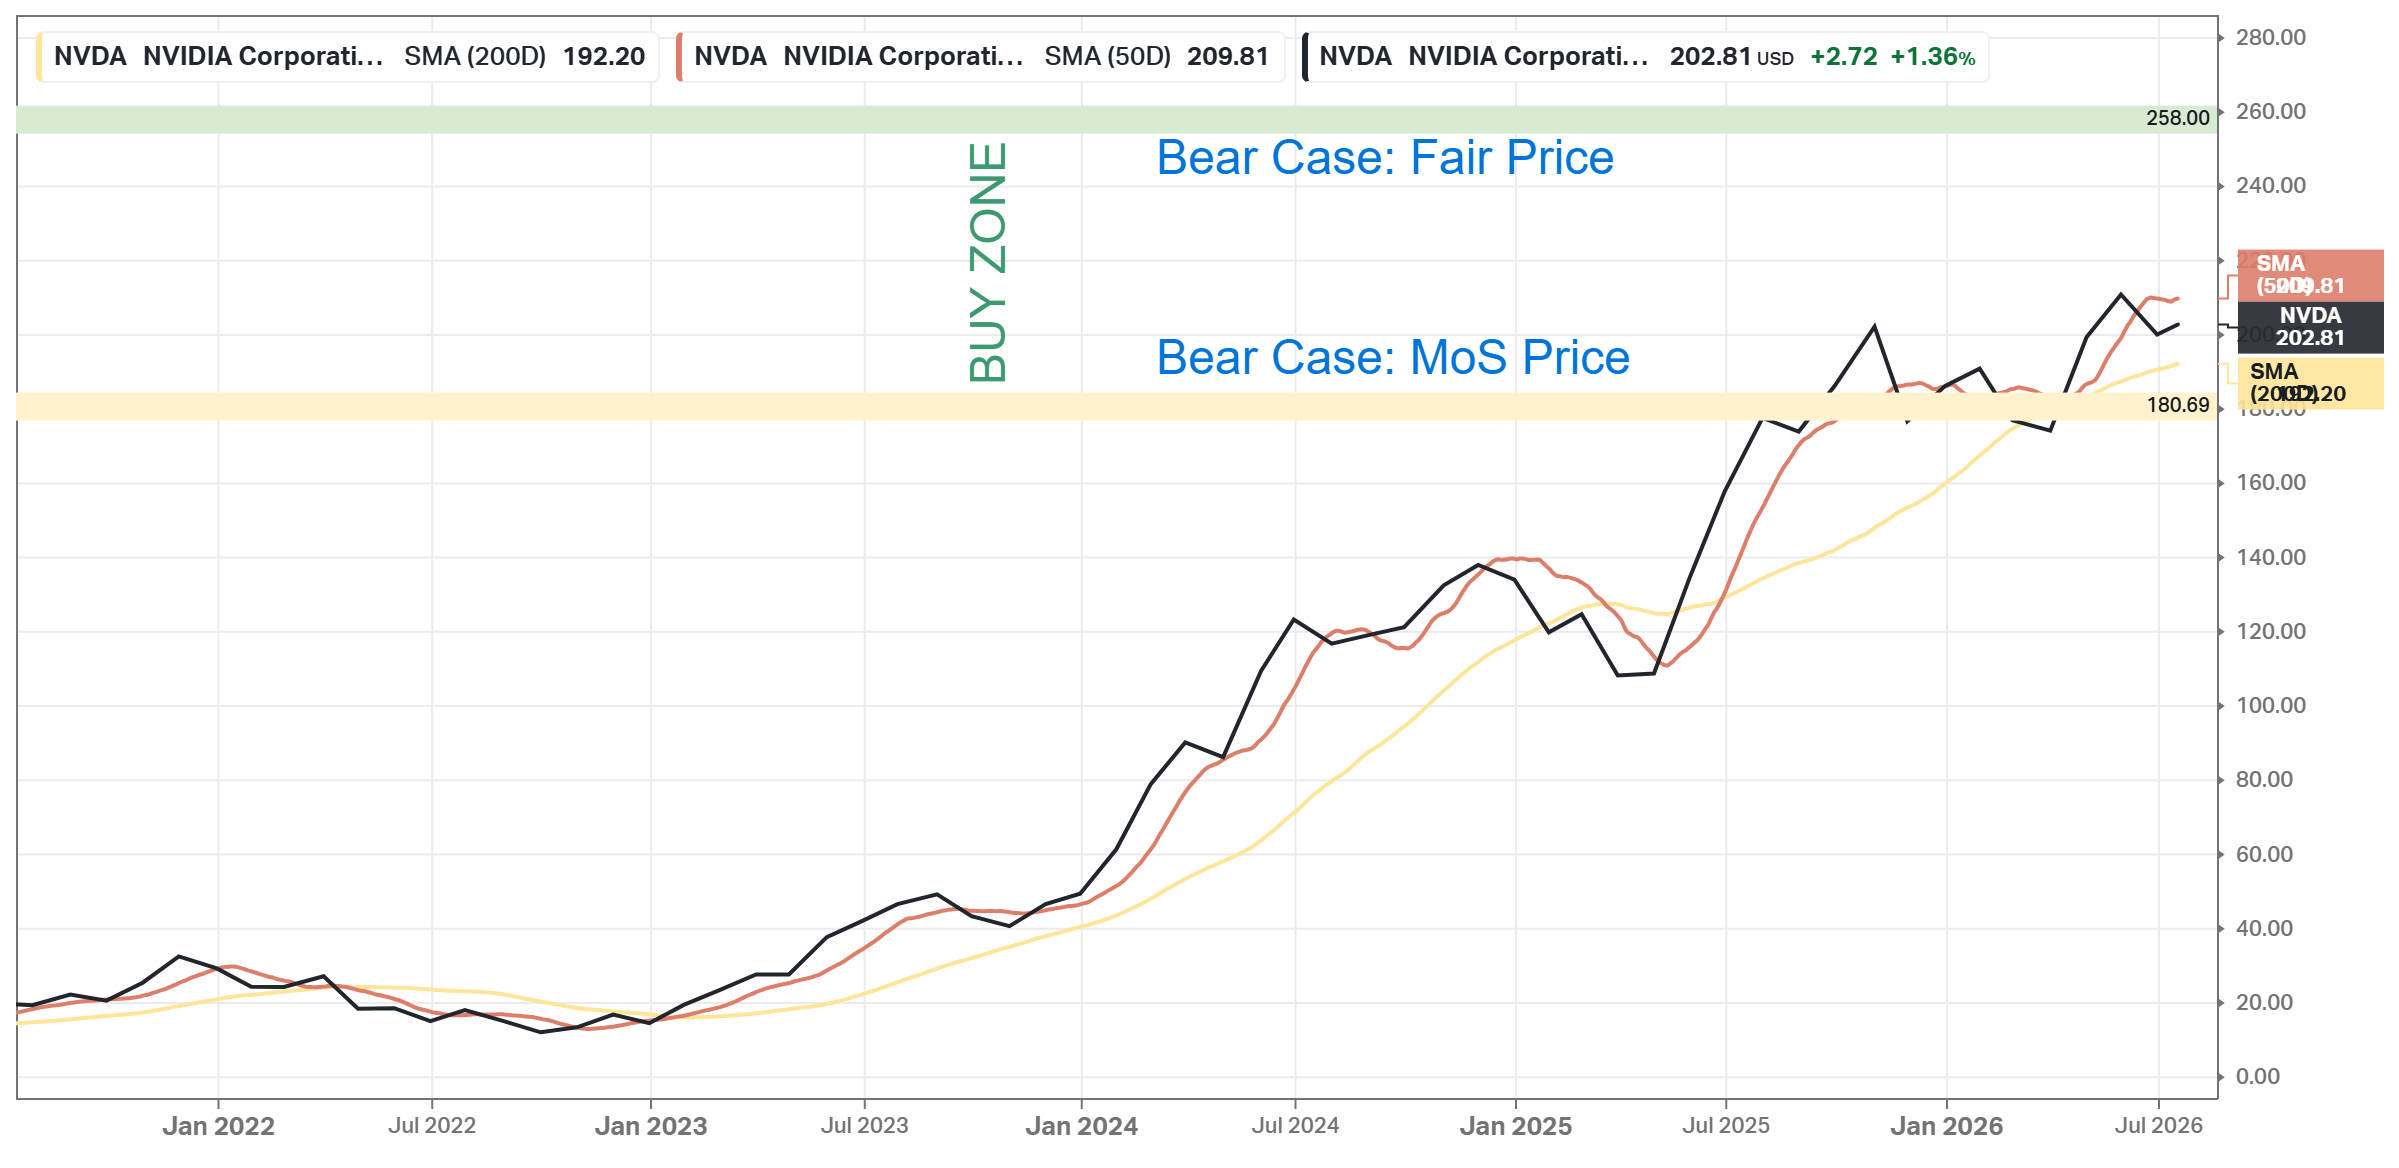
Note: At $203, the stock trades below the base case MoS price of $253 - the full 30% margin of safety is already in the price even though the model cuts consensus growth by more than half. Even in the bear case, the stock trades ~21% below a $258 fair price, and the bear case MoS price of $181 is almost exactly on the lowest analyst target ($181).
The bear case MoS price ($181) and the bear case fair price ($258) form the accumulation zone.
Investment Thesis
Mid-2026 Nvidia is the fastest-growing mega-cap at its lowest relative valuation in five years. The stock rose 24% in a year, yet the forward P/E compressed to 20.7x versus a 37.8x average - earnings grew faster than the price. With ~45% consensus EPS growth, the PEG is at 0.47, versus 1.32 for MSFT and 1.01 for META at far lower growth.
Quality is not the question: 74% gross margin, 63% net margin, 70% ROIC, 114% ROE, ~$119B free cash flow, $40B net cash, and a CUDA moat that trillion-dollar customers have failed to break for a decade. Vera Rubin is ramping on track, RTX Spark opens a PC front against Intel and AMD, and management projects $3-4T of annual AI infrastructure spend by 2030.
Revenue concentrated in a few customers all seeking alternatives, margins that invite competition, China closed off, Taiwan risk, and a possible AI capex pause before the next wave (inference, agents, robotics, sovereign AI) arrives.
The risk/reward at 21x forward earnings for 45% growth favors owning it. NVDA belongs in a long-term portfolio as a core AI-infrastructure position - sized for its volatility, not its quality. The realistic bear case (capex digestion, margin normalization) hits the multiple and the estimates at once, so drawdowns of 30-40% are a feature, not a broken thesis.
Buy with a multi-year horizon, and judge the thesis on hyperscaler capex guidance and the Vera Rubin ramp, not the share price.
UBER
TL;DR: Uber is the world’s largest ride-hailing and delivery marketplace, serving 202 million monthly users. After a 21% one-year drawdown on AV fears and the ~$15B Delivery Hero deal, it trades at 20.4x forward earnings for ~28% expected EPS growth, a PEG of 0.73, with 25% ROIC and an 18% FCF margin. Verdict: an attractive growth-at-a-reasonable-price position - watch the Delivery Hero terms and Mobility gross-bookings growth as Waymo expands. Base Case Fair Price: $132 - the stock trades ~45% below it; Buy Zone: $66-$94.
Overview
Next Earnings: Aug 5th, 2026, during-market (confirmed)
Sector: Industrials
Industry: Ground Transportation
Beta (5Y Monthly): 1.11
Short Interest: 2.70%
Uber is the world’s largest on-demand ridehailing and delivery platform, with 202 million people using it at least once a month (as of December 2025).
Mobility: the core ridehailing marketplace matching riders with drivers across the globe. Uber is the clear network leader; Lyft competes mainly in the US. The segment’s biggest long-term question is autonomous vehicles: Waymo and Tesla could either bypass Uber’s network or plug into it as fleet partners.
Analyst’s Note:
I pretty often use Uber as the main taxi app in my life 🚕
Delivery: Uber Eats, the #2 player in US food delivery behind DoorDash, plus grocery and convenience delivery. Big news right now: Uber has reached a roughly $15B takeover agreement for Delivery Hero (after an initial EUR 33/share offer was rejected), which would add massive international scale, consolidate over 20 overlapping markets, and open Middle East/North Africa optionality.
Freight & new bets: logistics brokerage, advertising (a fast-growing high-margin layer on top of both marketplaces), and Uber One memberships that tie the ecosystem together.
The model: Uber takes a cut of every transaction on its network. Its advantage is the two-sided network effect - more riders attract more drivers and couriers, and data from billions of trips continuously improves matching and dynamic pricing. Uber has a narrow economic moat built on those network effects.
Main competitors: LYFT, DASH, DIDI, Tencent-backed platforms, and potentially AV players (Waymo, Tesla).
Financial Position
Market Cap: $147.93B
Total Debt: $12.42B
Cash & Investments: $6.09B
Enterprise Value: $151.44B
FCF (LTM): ~$9.8B
Net debt of ~$6.3B against ~$9.8B of annual free cash flow is comfortable - well under one year of FCF. The asset-light marketplace model needs no factories and no fleet. The nuance is forward-looking: the ~$15B Delivery Hero acquisition will consume the balance-sheet headroom and likely pause buybacks while the deal is digested and integrated.
Valuation (Current vs 5Y)
Price/Fwd Earnings: 20.4x vs 41.7x
Price/Fwd Sales: 2.5x vs 2.8x
Price/FCF: 15.1x vs 51.1x
PEG: 0.73 vs 0.72
Earnings Yield (fwd): 4.90% vs 2.40%
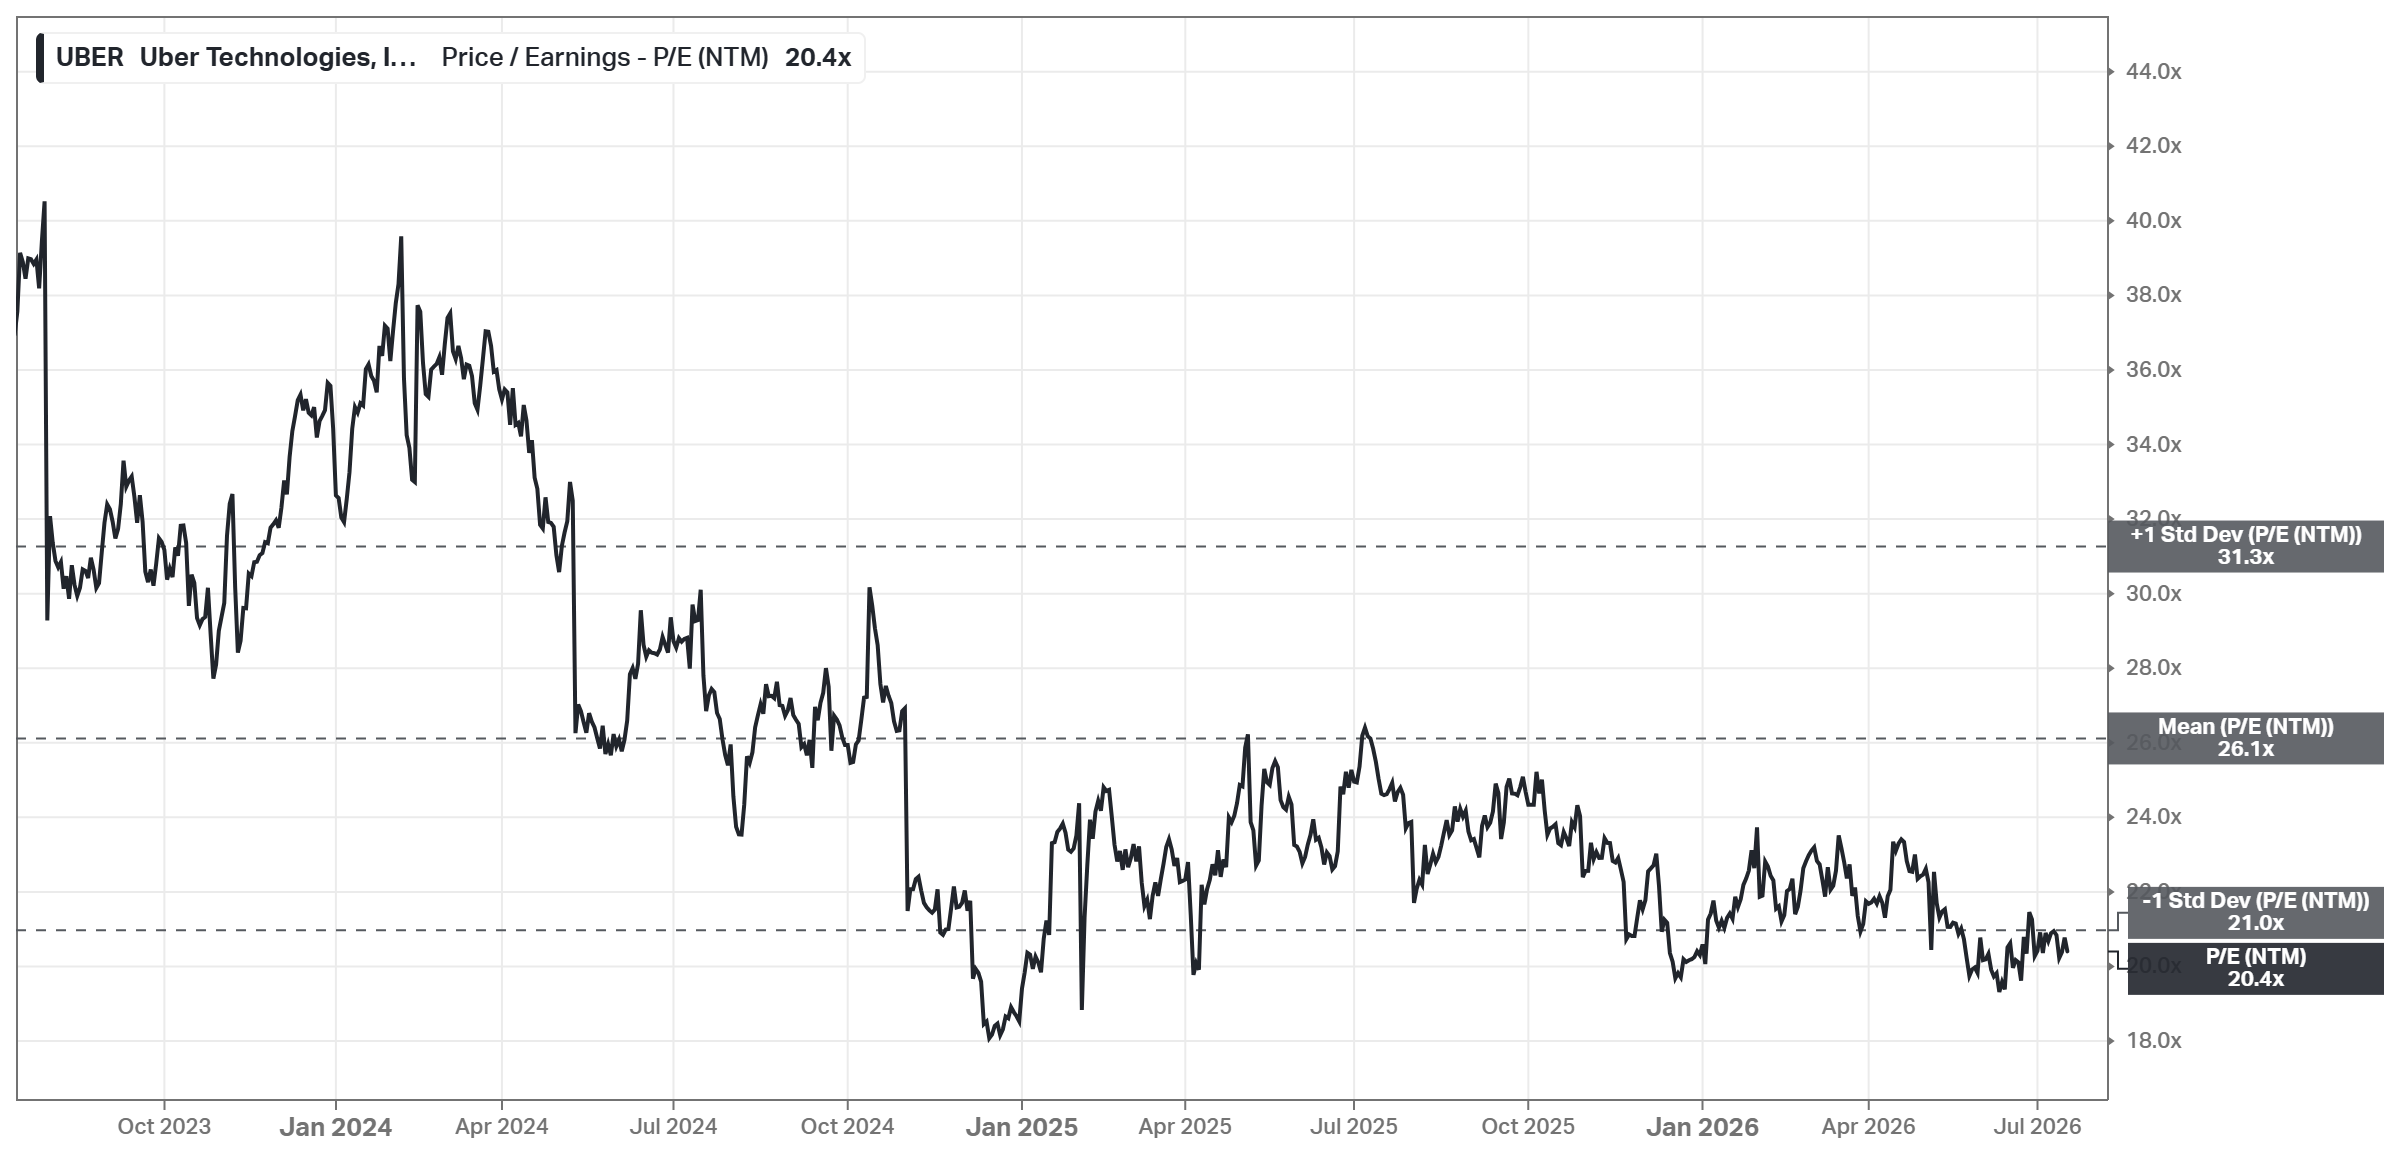
The 5-year average multiples (41.7x P/E, 51.1x P/FCF) are inflated by the barely-profitable early years, so treat them with care. The cleaner read: 20.4x forward earnings and 15.1x free cash flow for a business consensus expects to compound EPS at ~28% - that is a PEG of 0.73.
Growth
EPS Fwd 5Y CAGR: 28.03% (5Y mean: 42.53%)
Price Estimates 1Y: $104.41, +43.68% upside
Analyst Rating: Strong Buy (11 Strong Buy/35 Buy/5 Hold/1 Sell)
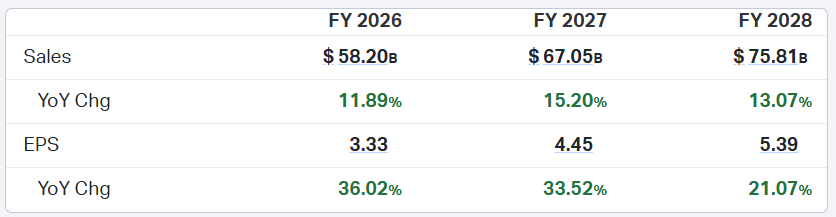
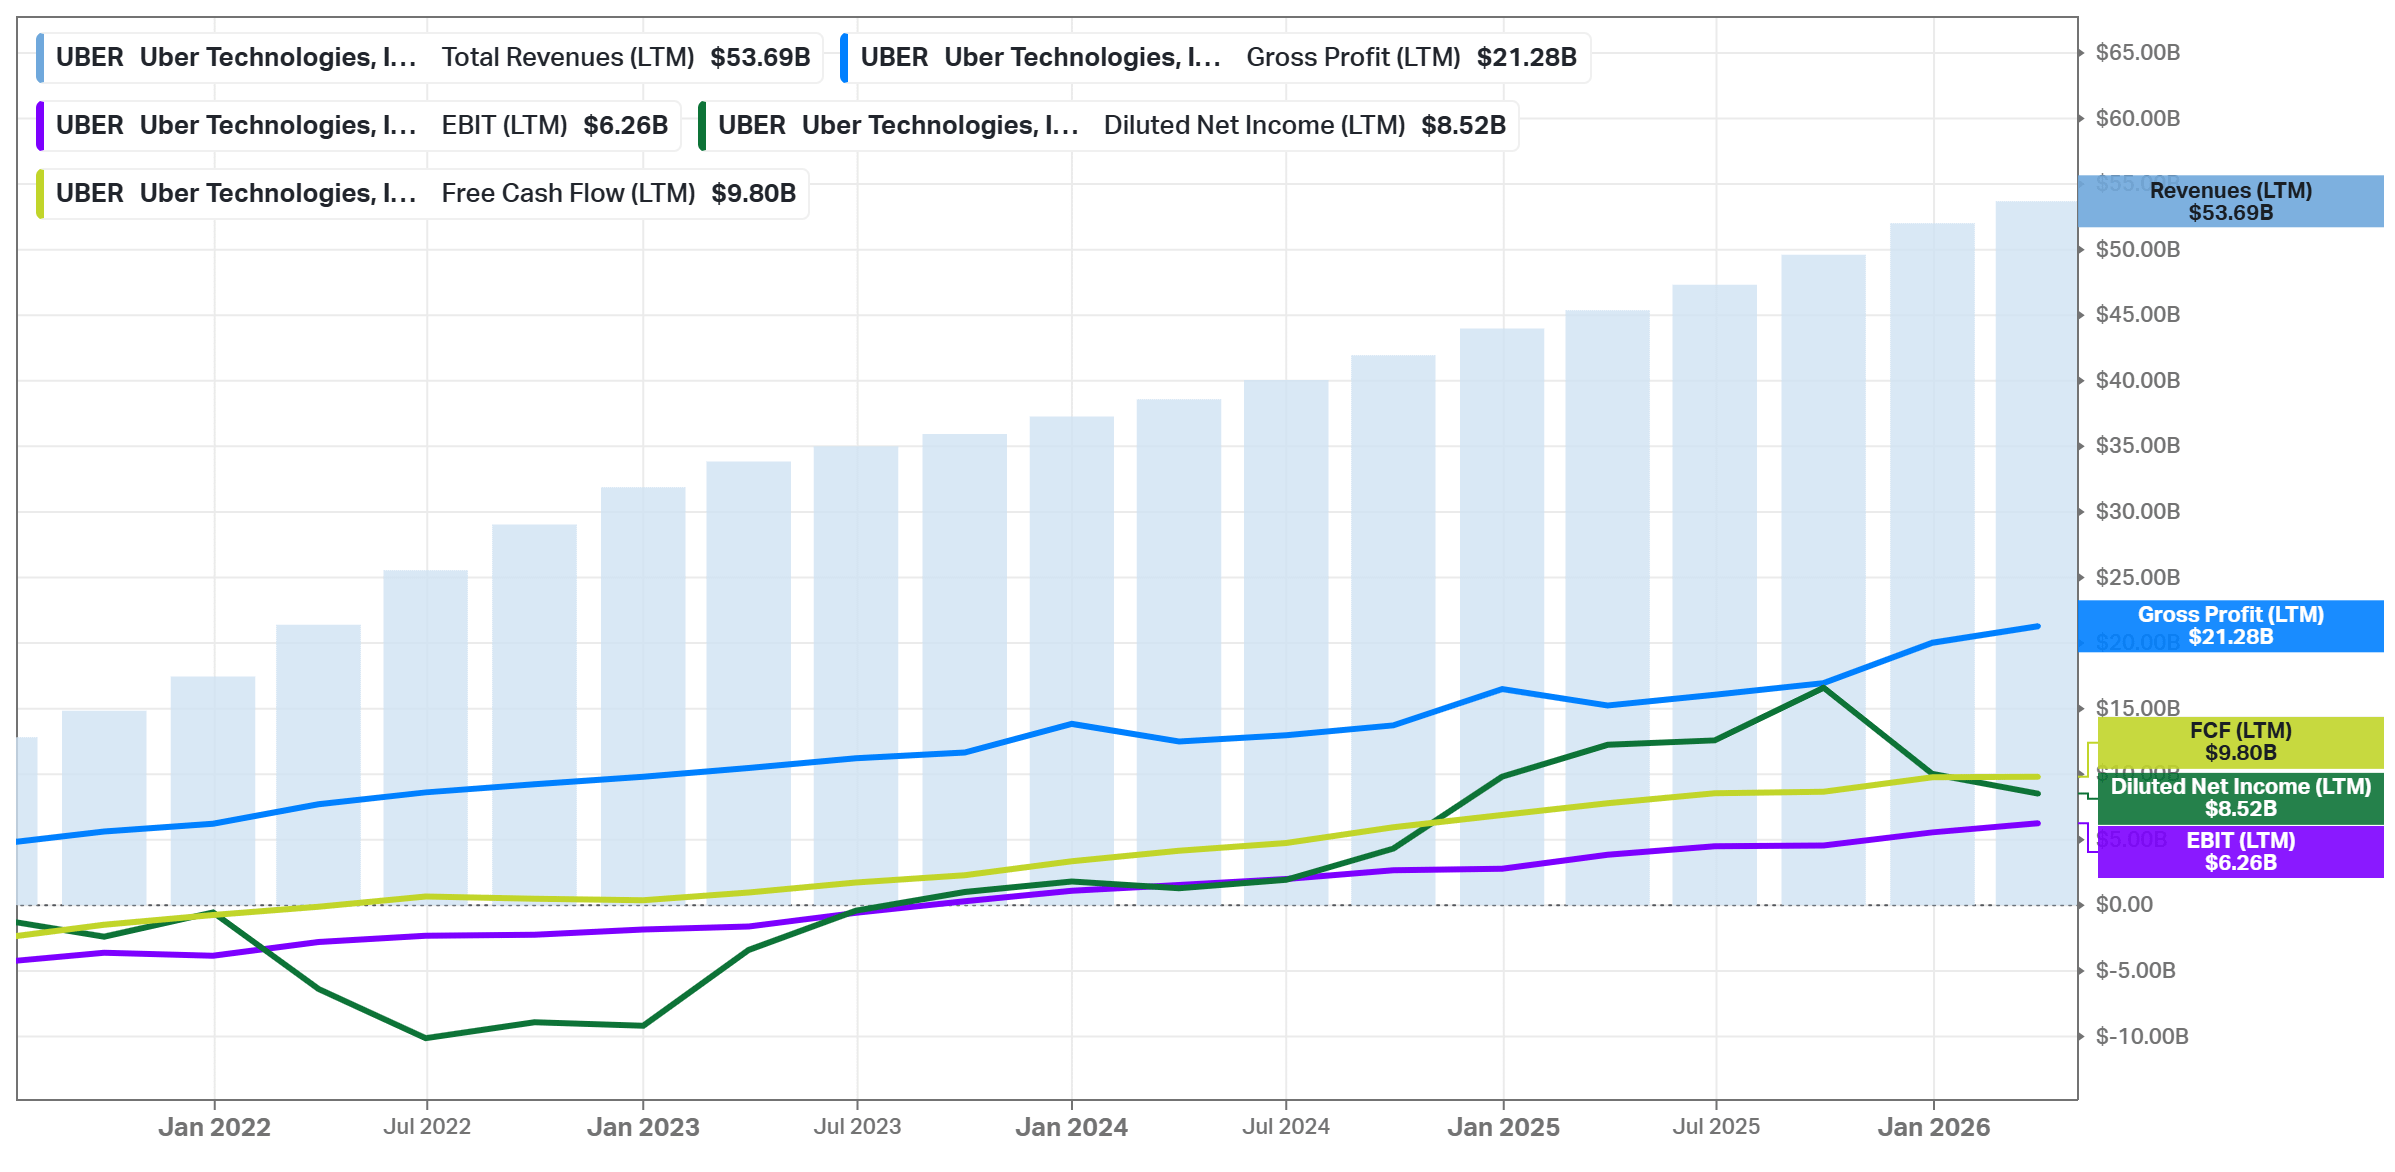
Revenue grows 12-15%, but EPS grows 21-36% - operating leverage in action. Each incremental ride or order flows through an already-built network at high incremental margin, and the fast-growing ads business is nearly pure profit. The underlying ridehail + delivery markets are expected to grow 15%+ annually until 2032, so this is leverage on top of a growing base, not a cost-cutting story.
Management Effectiveness (Current vs 5Y)
ROIC: 25.47% vs 6.68%
ROE: 35.31% vs 4.20%
ROA: 6.94% vs 0.59%
The 5-year means are near zero because Uber was structurally unprofitable until 2023 - so the comparison mostly measures the transformation itself. What matters: current returns (25.5% ROIC, 35.3% ROE) are genuinely excellent and have held above 20% for six straight quarters. The company that burned $30B+ of investor cash in its first decade now earns returns most industrials can only dream of.
Margins (Current vs 5Y)
Gross Profit: 39.64% vs 34.38%
EBIT: 11.66% vs -0.69%
Net Income: 15.91% vs 0.75%
FCF: 18.25% vs 8.23%
Same pattern as returns: every margin far above its 5-year average, and the averages themselves are distorted by loss-making years. An 11.7% EBIT margin and an 18.3% FCF margin on a marketplace business still have obvious room to expand - management’s own long-term framework points to continued margin gains as ads scale and insurance costs are tamed. This is a business early in its profitability curve, not at the peak of it (contrast with NVDA’s 63% net margin).
Dividends
Dividend: none
Buyback Yield: 5.11%
Total Shrhldr Yield: ~4.5% (buybacks 5.11% + debt paydown -0.58%)
No dividend and none expected soon - free cash flow goes to buybacks (a healthy 5.1% yield over the last year) and, going forward, to funding the Delivery Hero acquisition. Expect capital returns to slow temporarily during deal integration; the long-term capital-return story only begins after that.
Advantages
The dominant global network in two growing markets: 202M monthly users, the #1 position in ridehailing worldwide and #2 in US delivery, with network effects that compound - more users attract more drivers, and trip data continuously improves pricing and matching. Underlying markets are forecast to grow 15%+ a year through 2032, and Delivery Hero would extend the network across 20+ additional markets.
Operating leverage just getting started: Revenue +12-15% converts into EPS +21-36%; EBIT margin (11.7%) and FCF margin (18.3%) are at record highs but still low in absolute terms, with high-margin advertising and membership revenue scaling on top. ROIC went from negative to 25% in three years.
Growth at a discount: 20.4x forward earnings and 15.1x FCF for ~28% expected EPS growth (PEG 0.73), a +43.7% gap to the average analyst target, and the lowest street target only ~4% below the price. The stock already absorbed a 21% one-year drawdown on AV fears and deal concerns.
Disadvantages
Autonomous vehicles: If Waymo, Tesla, and future AV players build their own consumer apps and fleets, they bypass Uber’s network entirely - the bear case is that Uber’s role shrinks to low-margin fleet services (charging, cleaning). Uber needs many competing AV suppliers to preserve its bargaining power; a Waymo/Tesla duopoly would negotiate hard against it.
The Delivery Hero acquisition is big, expensive, and messy: ~$15B for a sprawling multi-brand European/MENA business at a premium multiple, with shareholders holding out for more, 20+ overlapping markets inviting antitrust scrutiny, and precedent integrations (DoorDash/Deliveroo/Wolt) showing high upfront costs. Uber’s own capital-allocation record is unproven at this scale.
Regulatory and labor overhang: Driver-classification rules (employee vs contractor), minimum-pay laws, and city-level fee caps continuously pressure the take rate across dozens of jurisdictions - each one small, together a permanent tax on margin expansion.
Fair Price
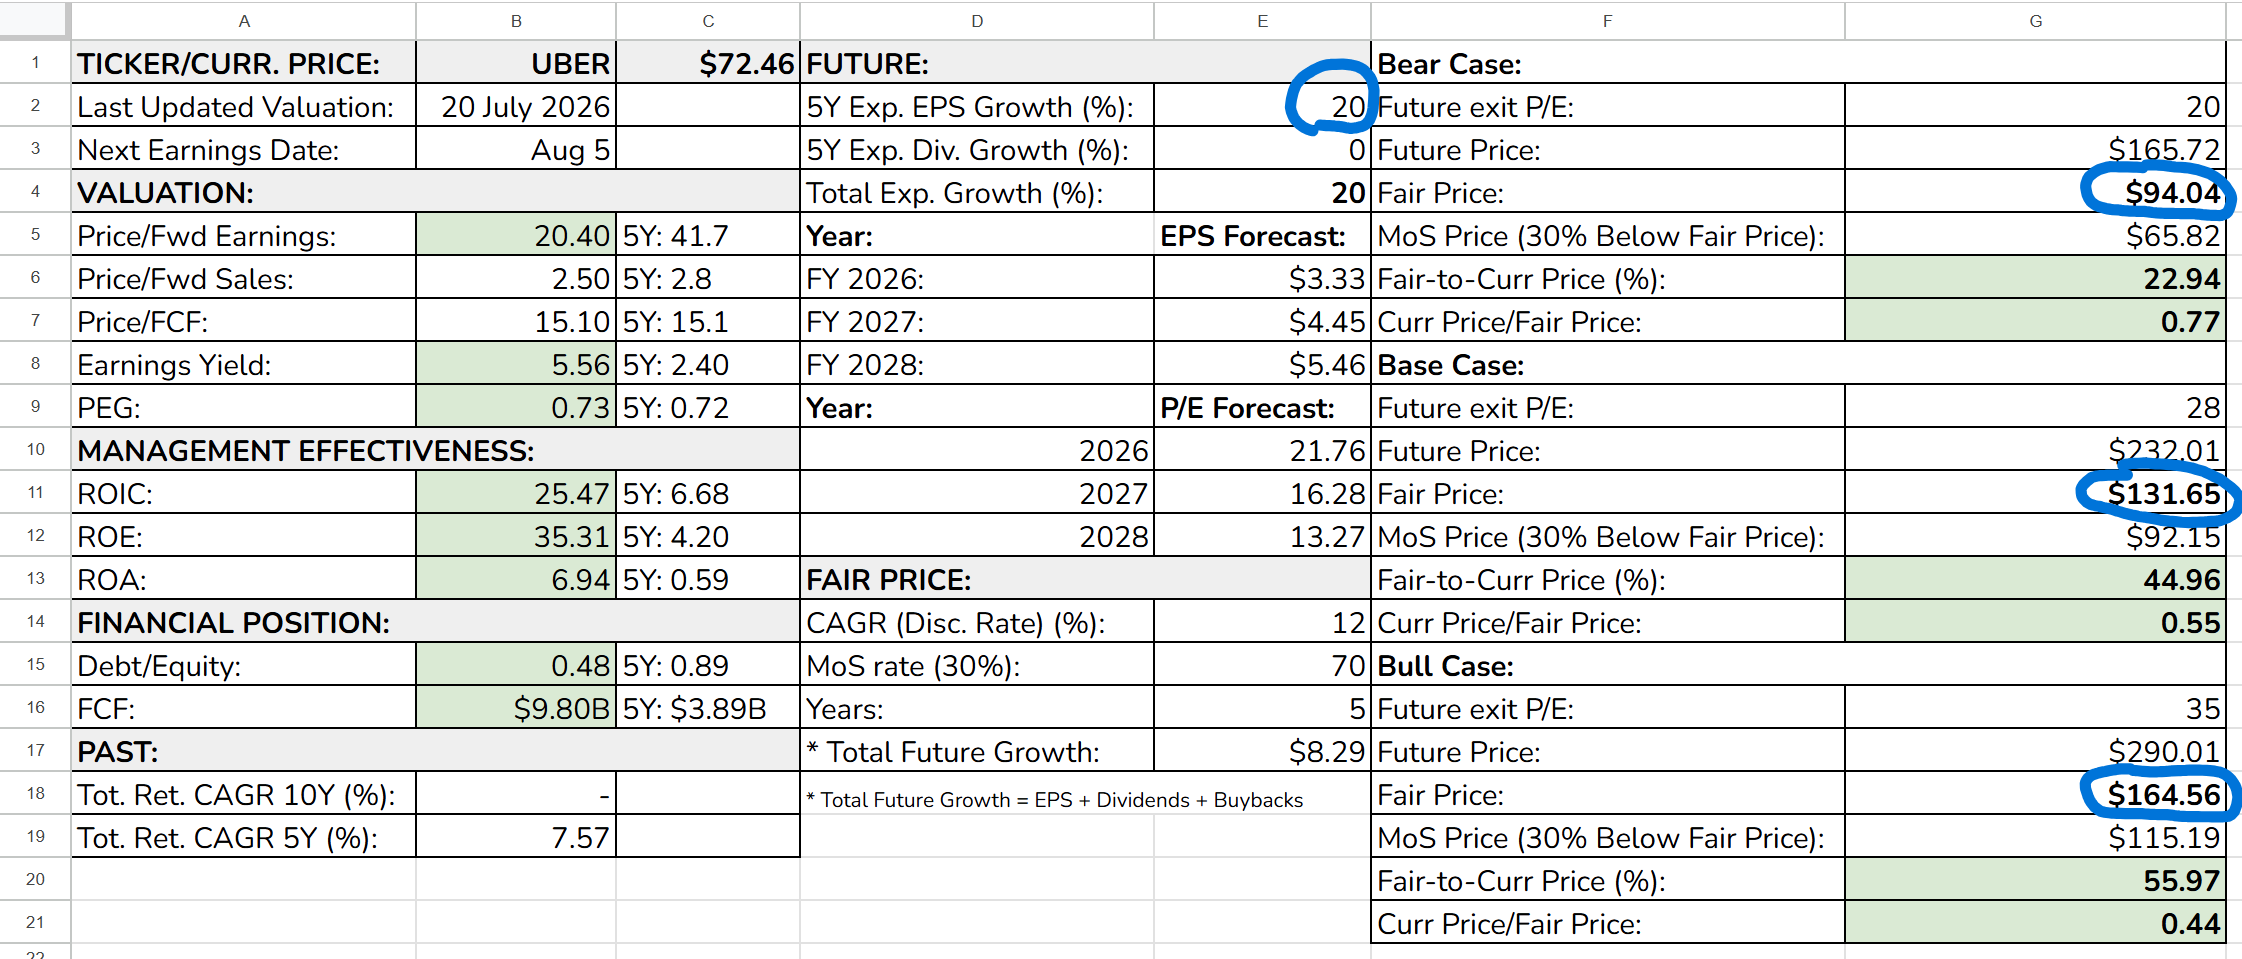
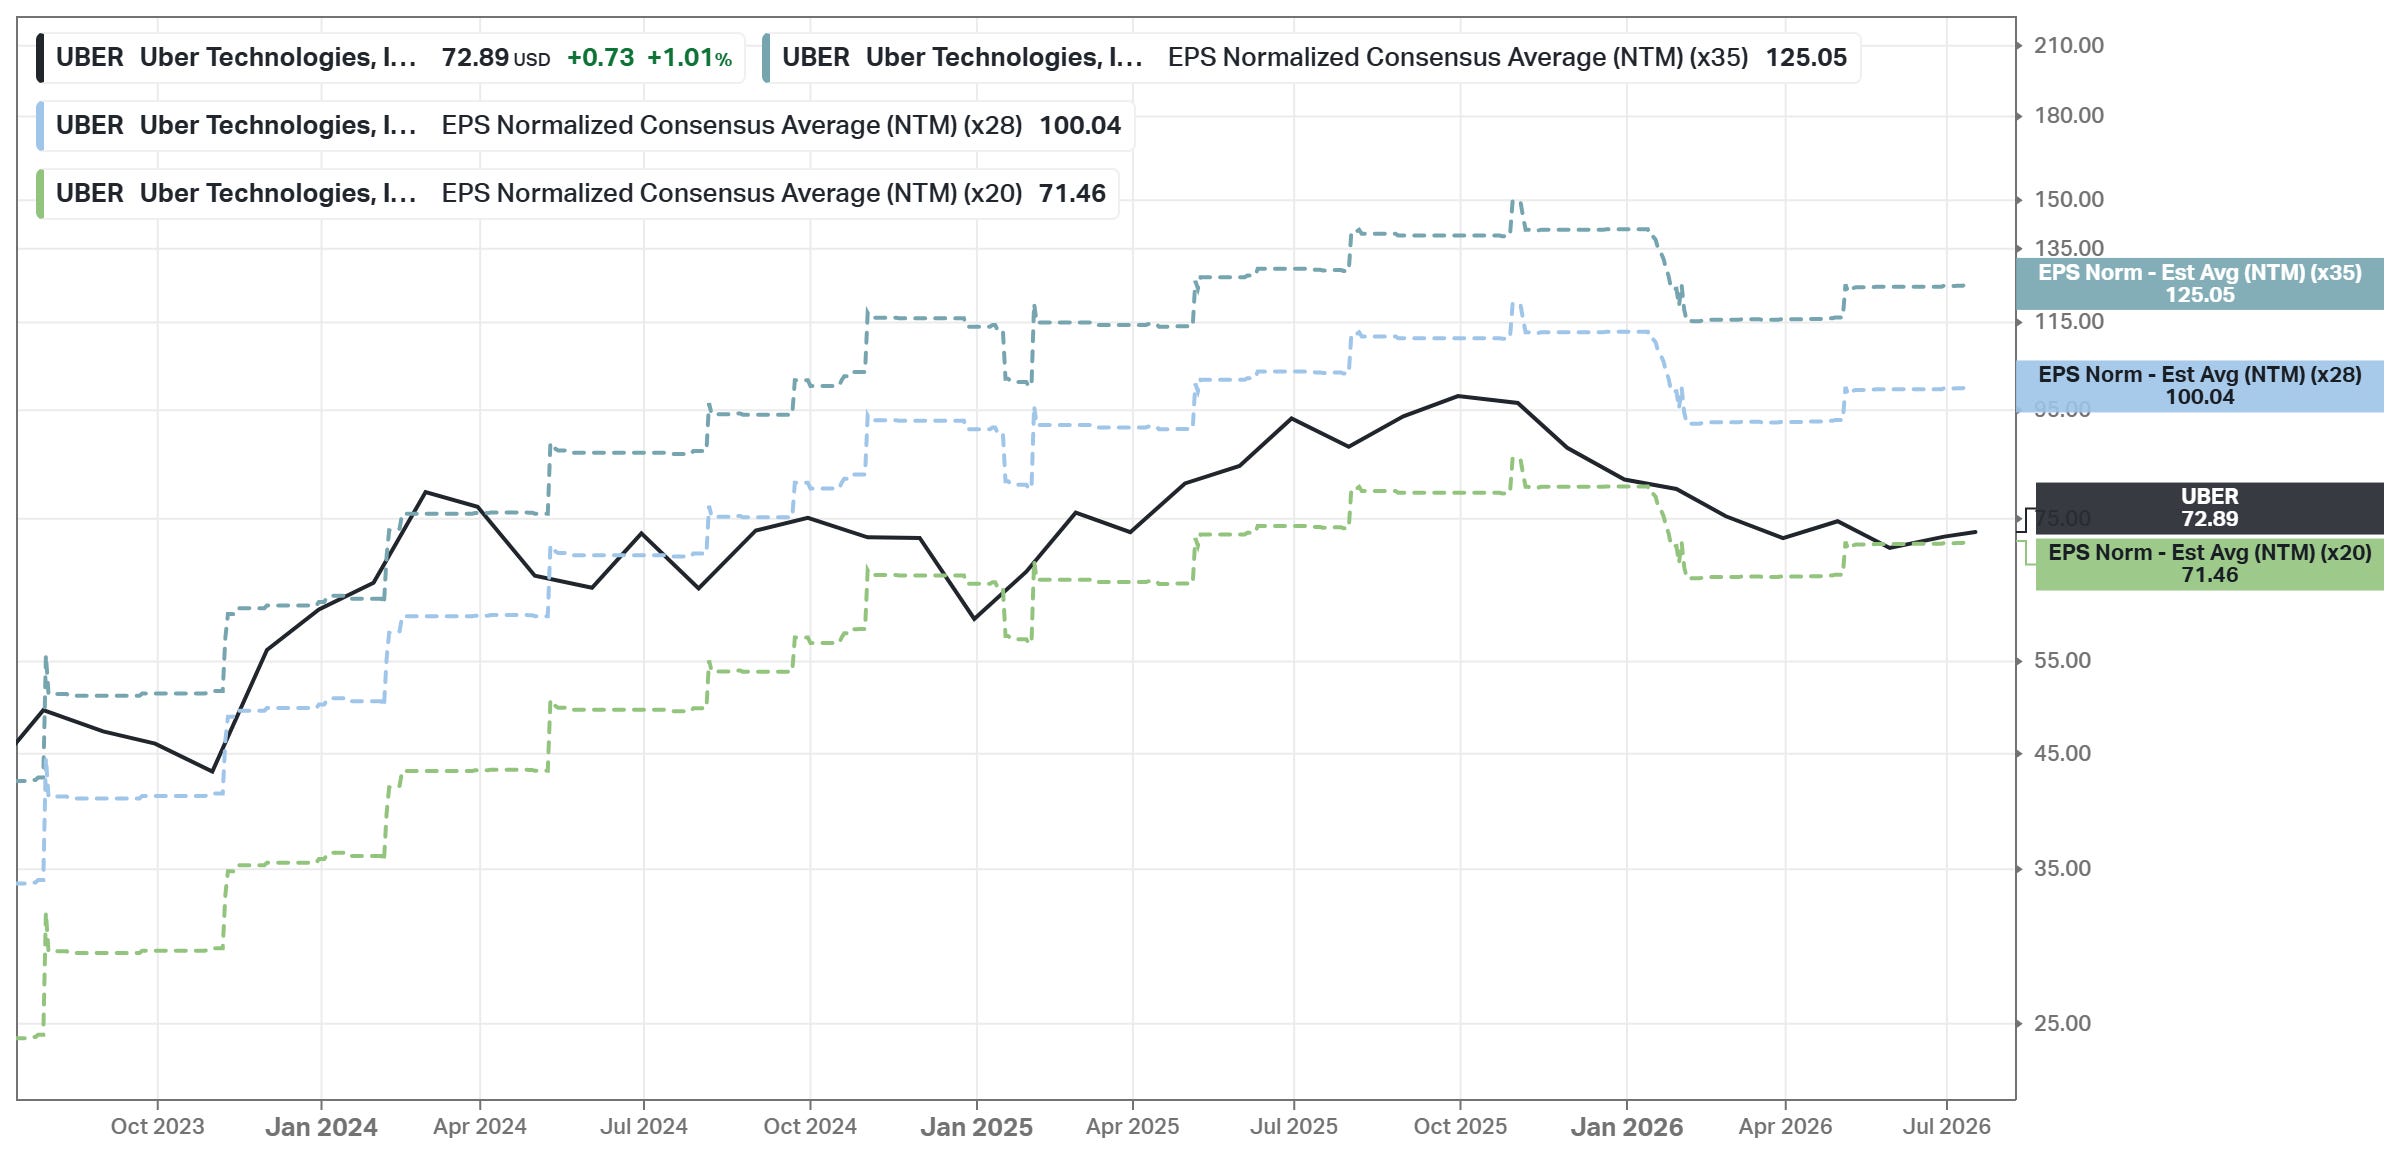
For Uber, I use 20% annual EPS growth - the maximum my model ever allows. And again, well below the ~28% forward 5Y CAGR consensus expects. No dividends here, so 20% is the whole number. That turns FY2026 EPS of $3.33 into ~$8.29 by 2031.
The exit multiples are the same 20x/28x/35x as the Fair Value Corridor chart above. One thing to know: Uber’s own 5-year average forward P/E (41.7x) is useless as an anchor - it is inflated by the early years when earnings were barely positive. So the scenarios anchor to today instead: 20x is roughly the current multiple (the market never re-rates a 28%-grower priced like a value stock), 28x is a PEG of just 1.0, and 35x is what the market pays slower-growing quality compounders.
Bear case (exit P/E 20x): fair price $94 - MoS price $66
Base case (exit P/E 28x): fair price $132 - MoS price $92
Bull case (exit P/E 35x): fair price $165 - MoS price $115
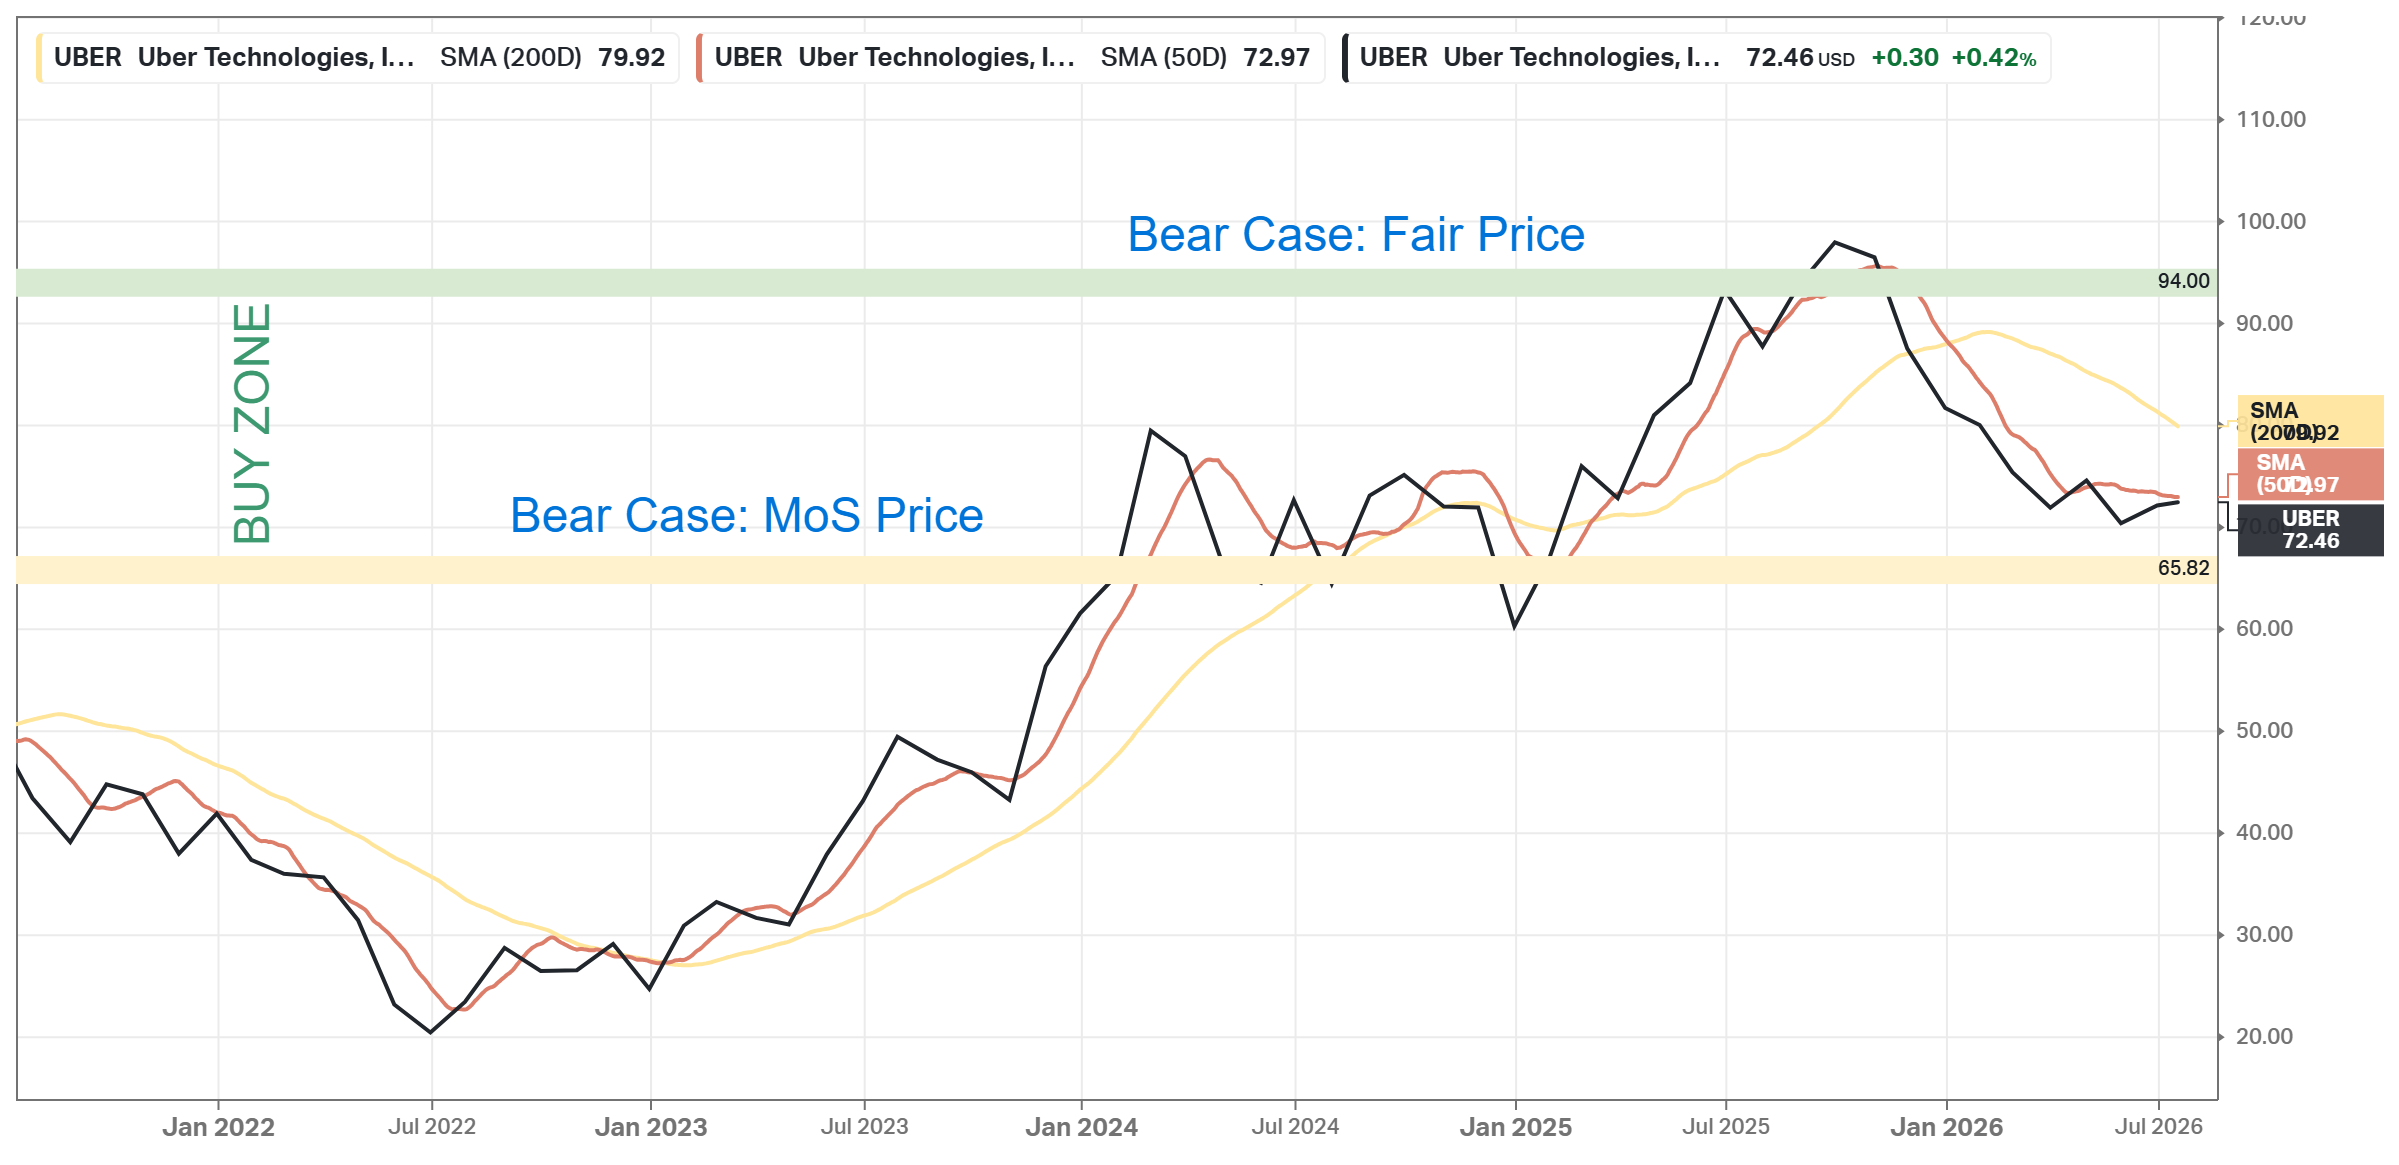
Note: At $72, the stock trades well below the base case MoS price of $92 - the full 30% margin of safety is in the price even with growth capped at 20%. In the bear case alone, the stock trades ~23% below a $94 fair price.
The bear case MoS price ($66) and the bear case fair price ($94) form the accumulation zone.
Investment Thesis
Uber has pulled off one of the decade’s great turnarounds - from burning billions to 25% ROIC and an 18% FCF margin; yet the stock is 21% below a year ago and 28% below its 52-week high ($102). Two fears did that: autonomous vehicles and a ~$15B acquisition. The result is 20.4x forward earnings for ~28% expected EPS growth, a PEG of 0.73, and 15.1x free cash flow - value-stock pricing on a business compounding revenue at 12-15% with expanding margins.
The AV risk is real, but the timeline and economics favor Uber for years yet. AV fleets need what Uber owns - demand aggregation, utilization, and dynamic pricing across 202M users, and a rival consumer app with global liquidity is harder to build than a car. Near term, AVs on partnered fleets cut Uber’s cost per ride and expand margins; a single dominant AV player going direct is a late-decade risk, not a 2026-2027 one.
Delivery Hero deserves skepticism: the price is full (~15-16x forward EBITDA versus 12.5-13.5x in precedent deals) and antitrust review spans 20+ overlapping markets. But the strategic logic - scale, removing a competitor, MENA growth. And Uber keeps a strong standalone business if the deal breaks.
An attractive growth-at-a-reasonable-price position for a long-term portfolio. More speculative than MSFT or META, less binary than NVDA or ADBE. At a PEG of 0.73, the AV risk looks more than priced in. Watch two checkpoints: the Delivery Hero deal terms and antitrust path (walking away or price discipline would be a positive signal). Also, watch Mobility gross-bookings growth as Waymo expands - deceleration below ~10% would signal the AV bear case arriving early.
Below $94, the risk/reward becomes outright compelling.
MU
Micron beats everything above: 6x forward earnings, a PEG of 0.04, +650% in a year, record margins, and an average analyst target 65% above the price. Every value screen in the world is flashing green on it - and I think buying MU today is the most expensive mistake. Memory stocks look cheapest at precisely the moment they are most dangerous, and this is a textbook case: analyst targets range from $361 to $2,200 - the street cannot agree whether it should halve or double.
In the full breakdown for paid subscribers: why the 6x P/E is lying and which two metrics tell the truth, the signals that will mark the top - and the price where I’d buy Micron aggressively with both hands.
Coming in Part 2: five stocks the market hates even more than these five - the SaaS leader at 12x earnings (a decade low), the creative-software giant at 8.7x that everyone says AI will kill, a de facto monopoly at half its usual multiple, and a $167B-debt lottery ticket with 90% upside to target. Subscribe so you don’t miss it 👇
This is not a financial or investing recommendation. It is solely for educational purposes.
thank you so much for this article - i really appreciate all the work put in here!