

TL;DR: First Solar (FSLR) is the largest thin-film solar module manufacturer in the Western Hemisphere, and its Q2 2026 report was built on margin, not sales: earnings beat estimates by 43%, even as revenue fell 3.7% YoY to $1.06B. Gross margin reached 44.0% LTM, helped by Section 45X manufacturing tax credits and a growing mix of US-made modules. The stock trades at 10.8x forward earnings and a PEG ratio of 0.51, with $1.5B of LTM free cash flow and roughly $1.5B of net cash on the balance sheet. Strong backlog through 2030. Even so, the stock is down 14% YTD on tariff uncertainty, global module oversupply, and its dependence on US clean-energy policy. Verdict: the earnings power is improving faster than the price. My full fair price math and the accumulation zone are at the end of this post.
Investment Thesis
First Solar reported second-quarter 2026 results with earnings 43% above consensus and a fourth straight quarter of margin expansion, even as revenue fell 3.7% YoY. The stock is still down 14% YTD. Below are my main points of view.
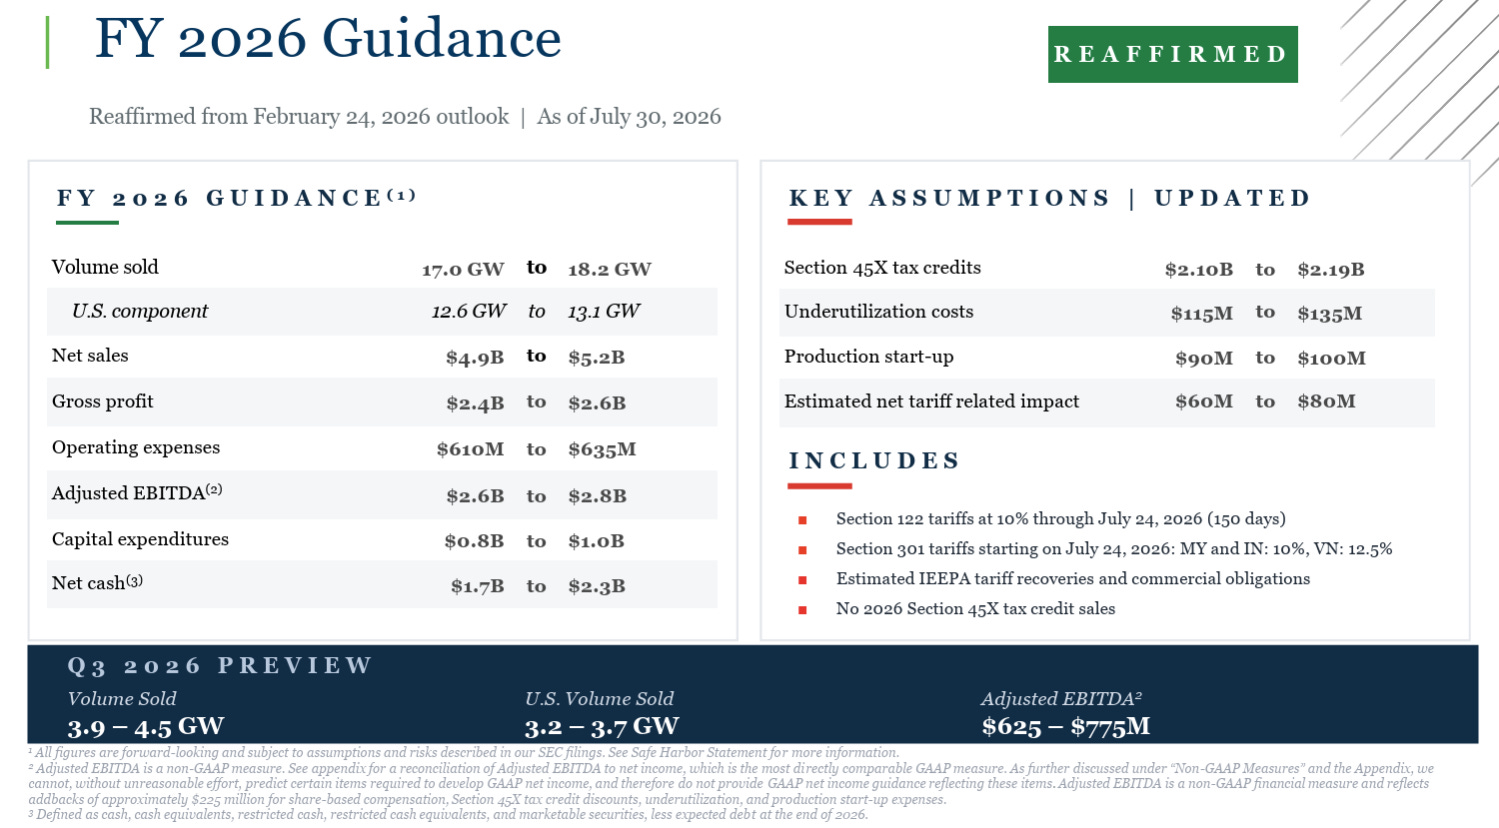
The growth is in earnings and backlog, not yet in revenue. The contracted backlog stands at 45.1 gigawatts, worth $13.6B through 2030, and consensus expects EPS to grow from $17.60 in FY2026 to $23.09 in FY2027 and $29.19 in FY2028, even as reported revenue guidance for 2026 is roughly flat at $4.9-5.2B.
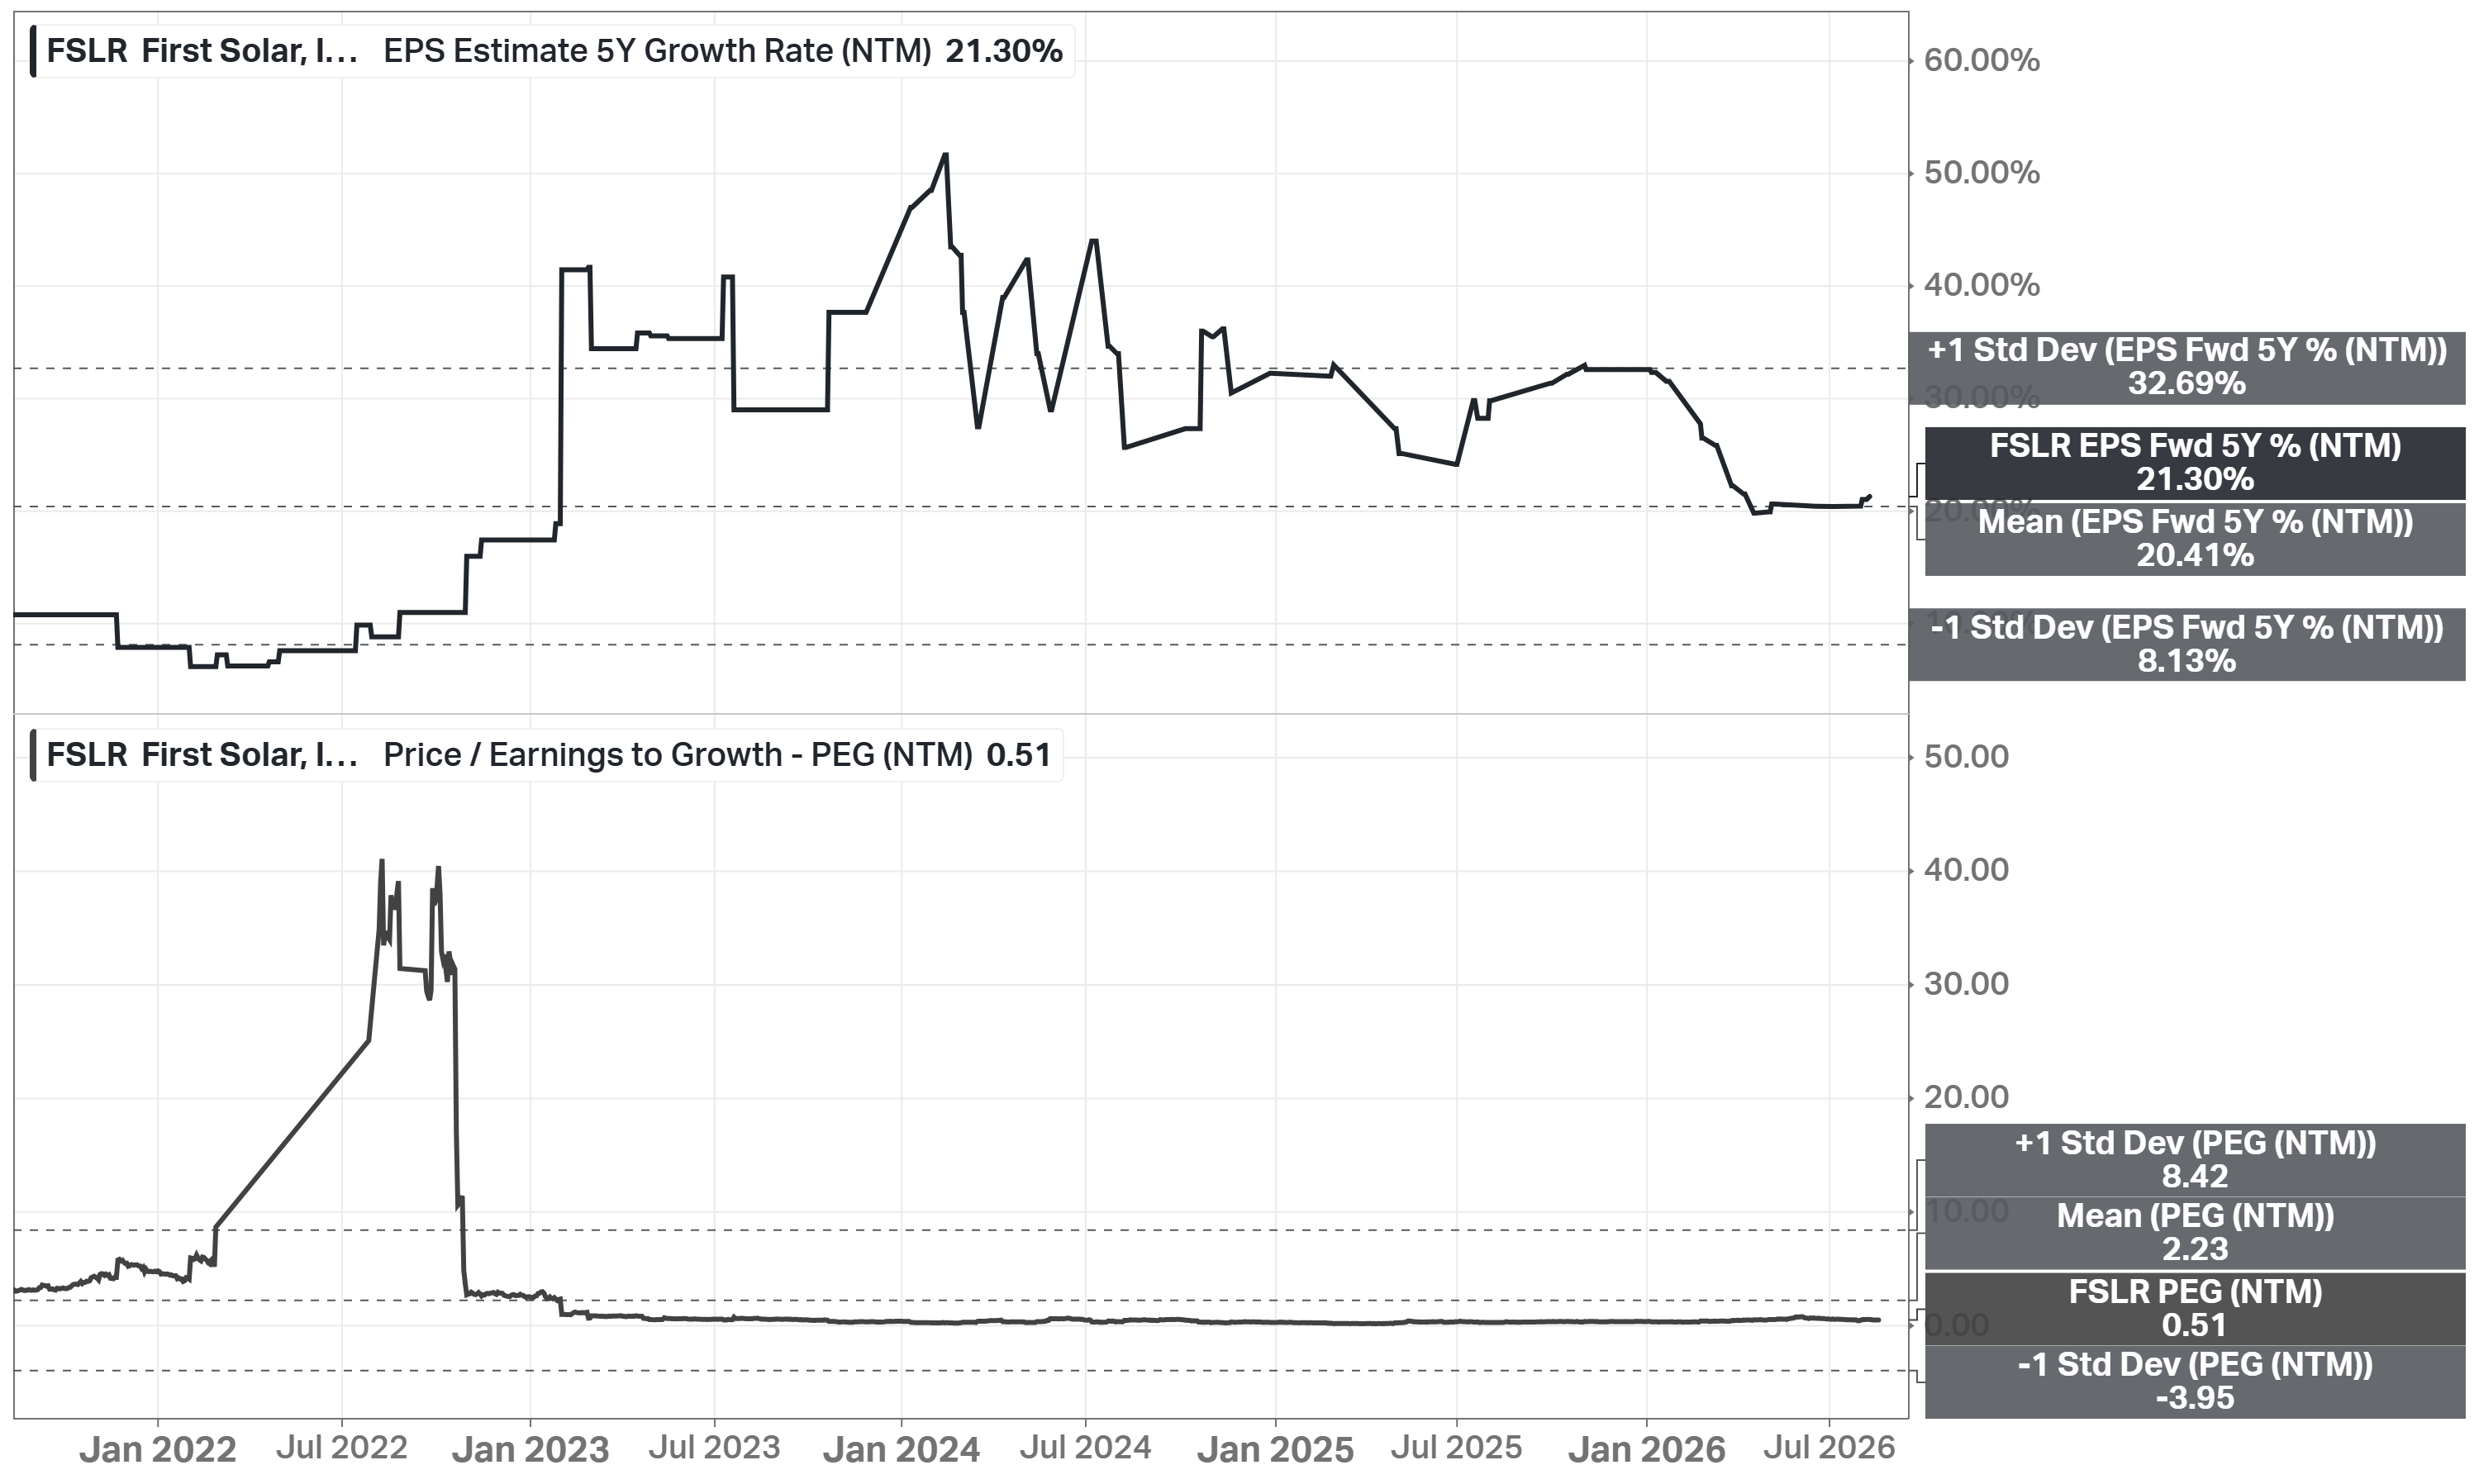
The market is not paying for that growth. Consensus expects a 21.3% EPS growth rate over the next 5 years, and the PEG ratio is now 0.51 - the cheapest of its solar-equipment competitors that are still growing at all.
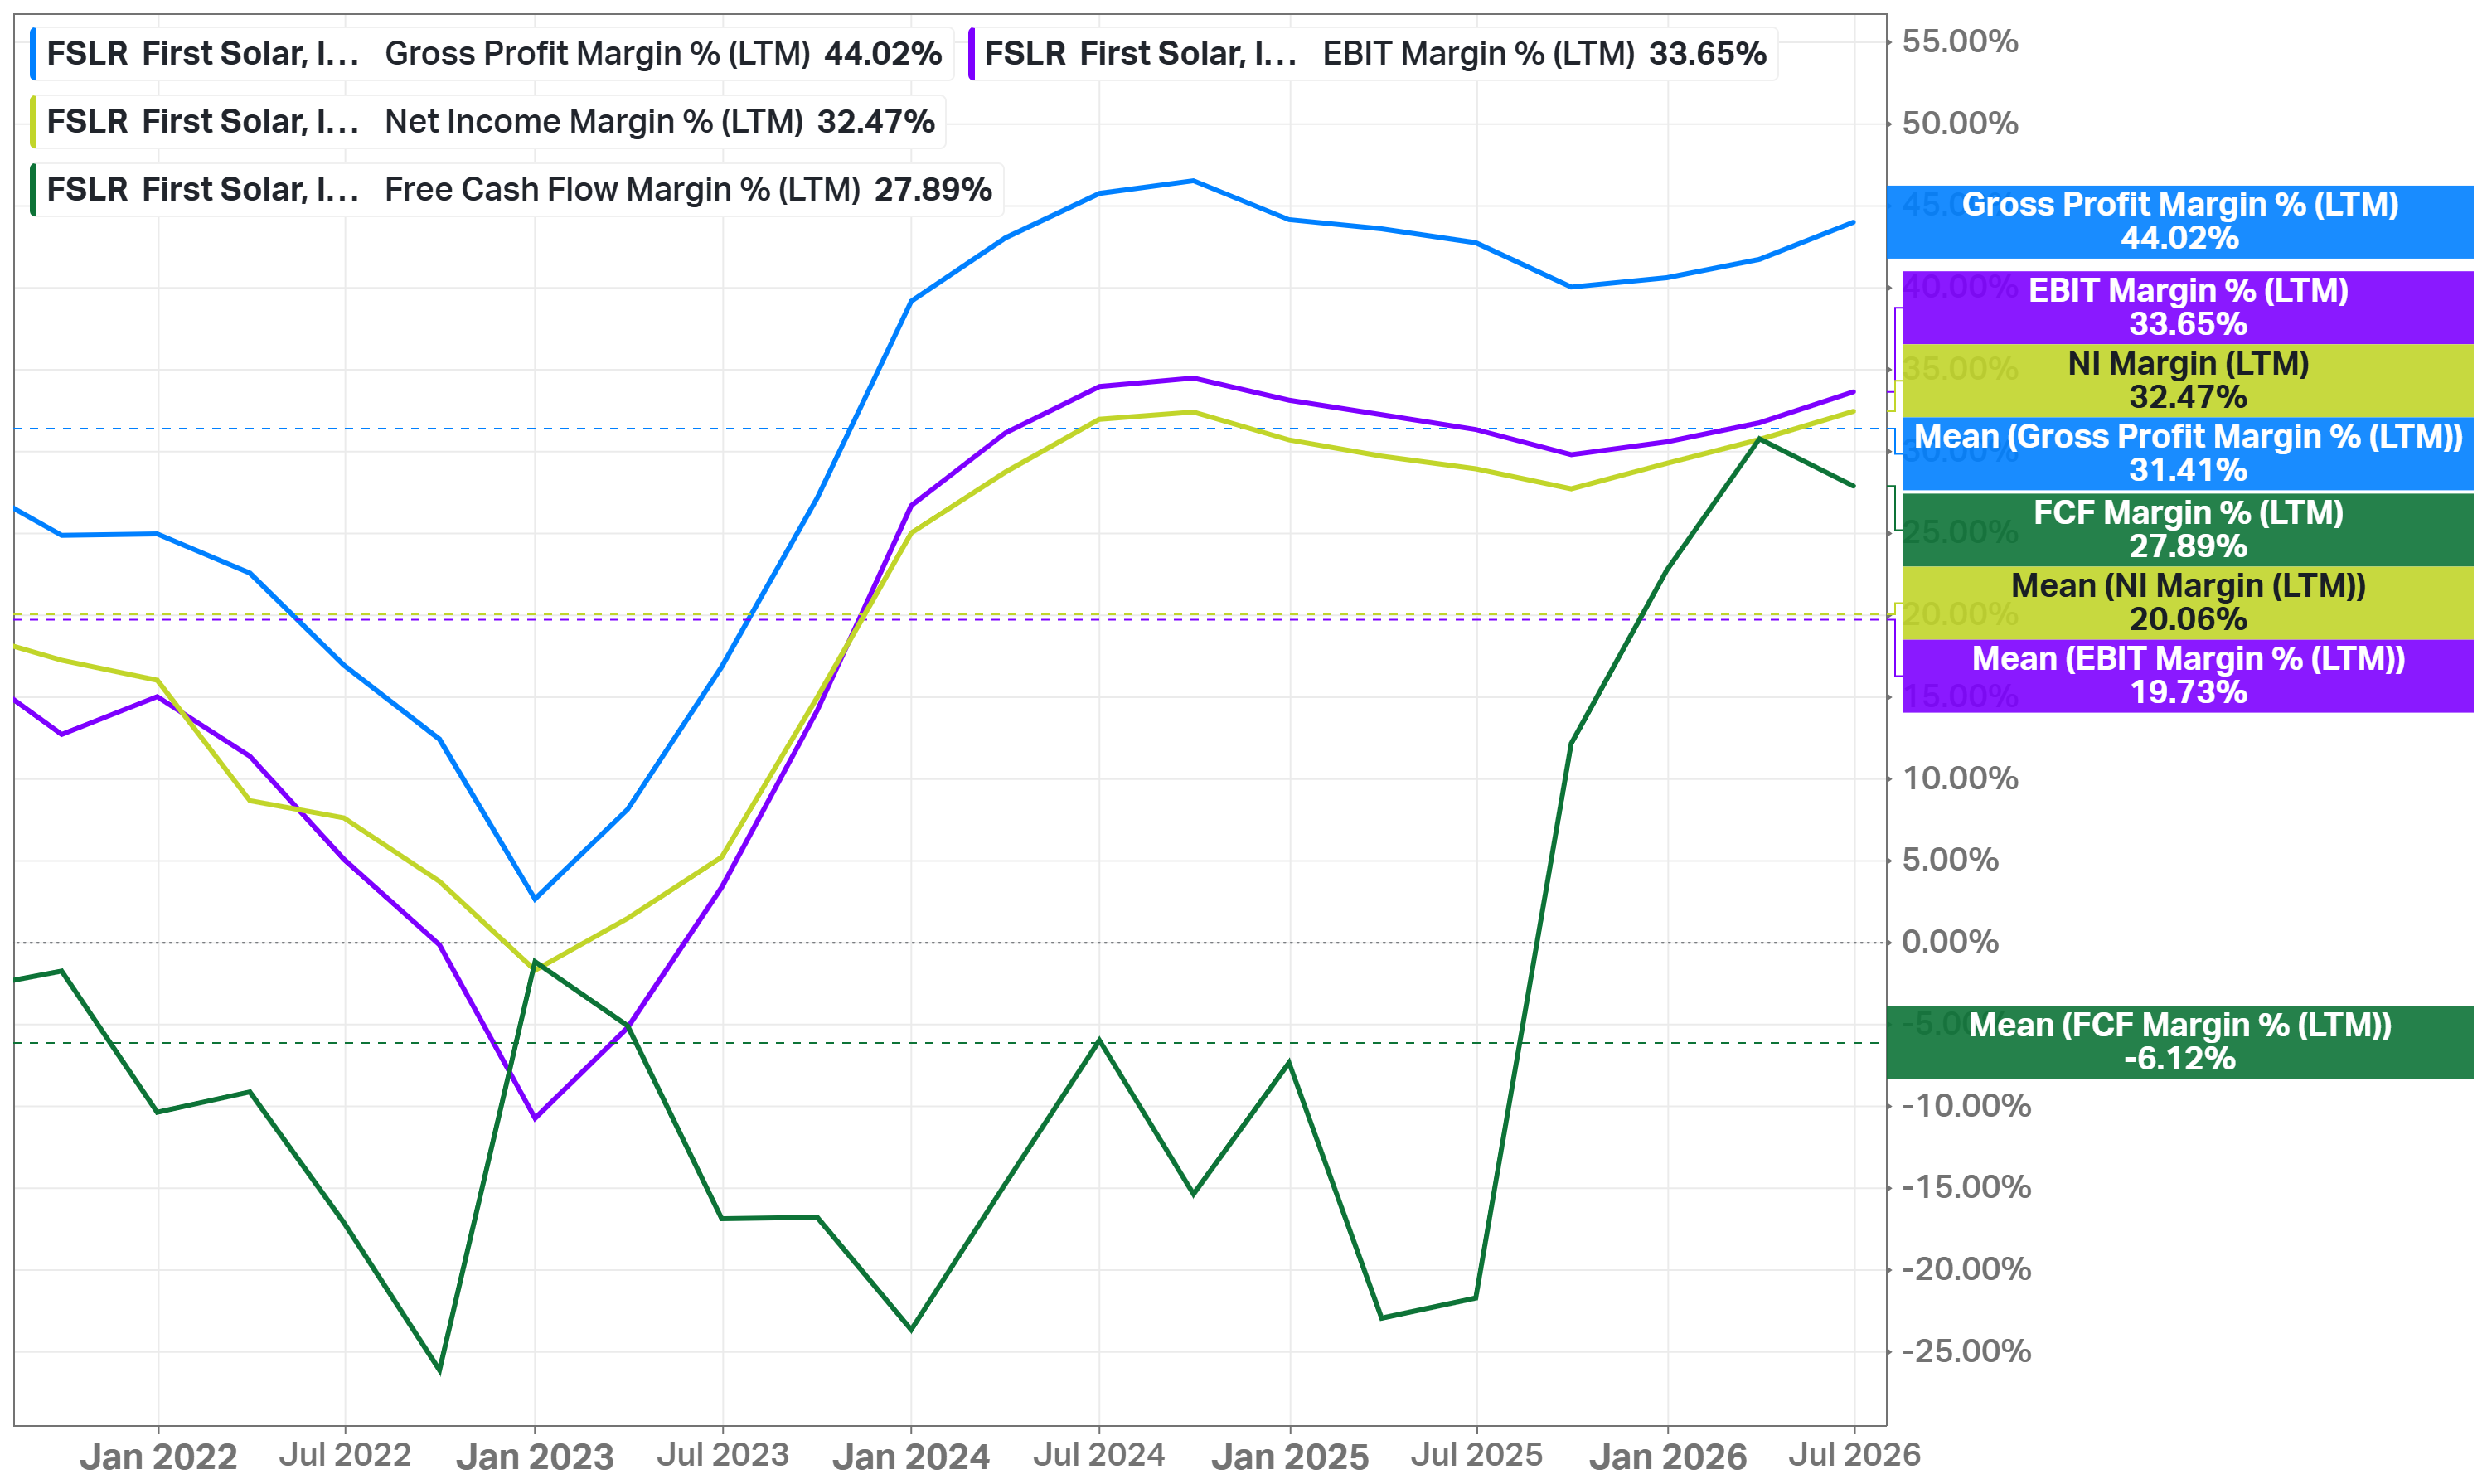
The margin profile keeps improving. 44.0% gross margin LTM, 32.5% net margin, 16.5% ROIC, $1.5B of FCF, and roughly $1.5B of net cash - both margins are the highest among its competitors.
The multiple has compressed. The forward P/E is 10.8x against a 30.4x 5Y mean (inflated by 2022-23’s near-zero earnings), even as EPS estimates for 2026 through 2028 keep increasing.
The bear case: a $60-80M net tariff headwind assumed for 2026, a pending Section 232 investigation that could affect close to 1.8 gigawatts of finished Southeast Asia capacity, intense competition from Chinese crystalline-silicon manufacturers, and a 2026 guidance built on $2.10-2.19B of Section 45X tax credits. My model takes this into account. Even then, the stock trades below my Bear Case fair price.
Company Overview
Next Earnings: 27 Oct 2026 (estimated)
Market Cap: $24.24B
Sector: Information Technology
Industry: Semiconductors and Semi-Equipment
Type: Mid Core
Employees: ~7,900
Short Interest: 9.20%
First Solar, Inc. is headquartered in Tempe, Arizona, and is the world's largest thin-film photovoltaic (PV) solar module manufacturer and the largest PV solar module manufacturer in the Western Hemisphere. It was founded in 1999 and incorporated in 2006. Unlike most of the solar industry, which relies on crystalline silicon, First Solar uses a proprietary cadmium telluride (CdTe) thin-film technology - a process that represents only about 5% of the global solar module market. Worth noting that this is also why the stock is filed under Semiconductors and Semiconductor Equipment rather than a solar-specific industry: a CdTe module is, technically, a semiconductor product.
The company designs, manufactures, and sells solar modules that convert sunlight into electricity, and it provides operations and maintenance (O&M) services to system owners after installation. Modules are its only reportable segment.
Production runs across 4 countries: the United States, India, Malaysia, and Vietnam. The international lines are being scaled back as manufacturing shifts toward the US. Domestic capacity is expected to reach about 14 gigawatts once current expansions are complete, and the company sells almost entirely to project developers, system integrators, and utility-scale renewable energy operators, with an estimated 30% historical share of the US utility-scale solar market.
Market Overview
Global solar module manufacturing is a scaled, commoditized industry. Production is heavily concentrated in Asia, with China alone responsible for roughly two-thirds of global capacity, and crystalline silicon is the dominant technology at about 95% of the market. Falling module prices have made solar economically competitive against traditional generation almost everywhere, but the module makers themselves have historically captured little of that value - the segment has a long history of thin and volatile returns on invested capital.
First Solar is outside that commodity race in two ways. First, its cadmium telluride technology is a genuinely different manufacturing process, with a simpler supply chain and no dependence on polysilicon pricing. Second, and more important, it is the largest domestic solar manufacturer in a market that US trade and tax policy has increasingly closed to low-cost imports. The Section 45X manufacturing credit pays roughly $0.17 per watt for US-made modules, and FSLR domestic factories ran at 98% utilization in Q2 2026.
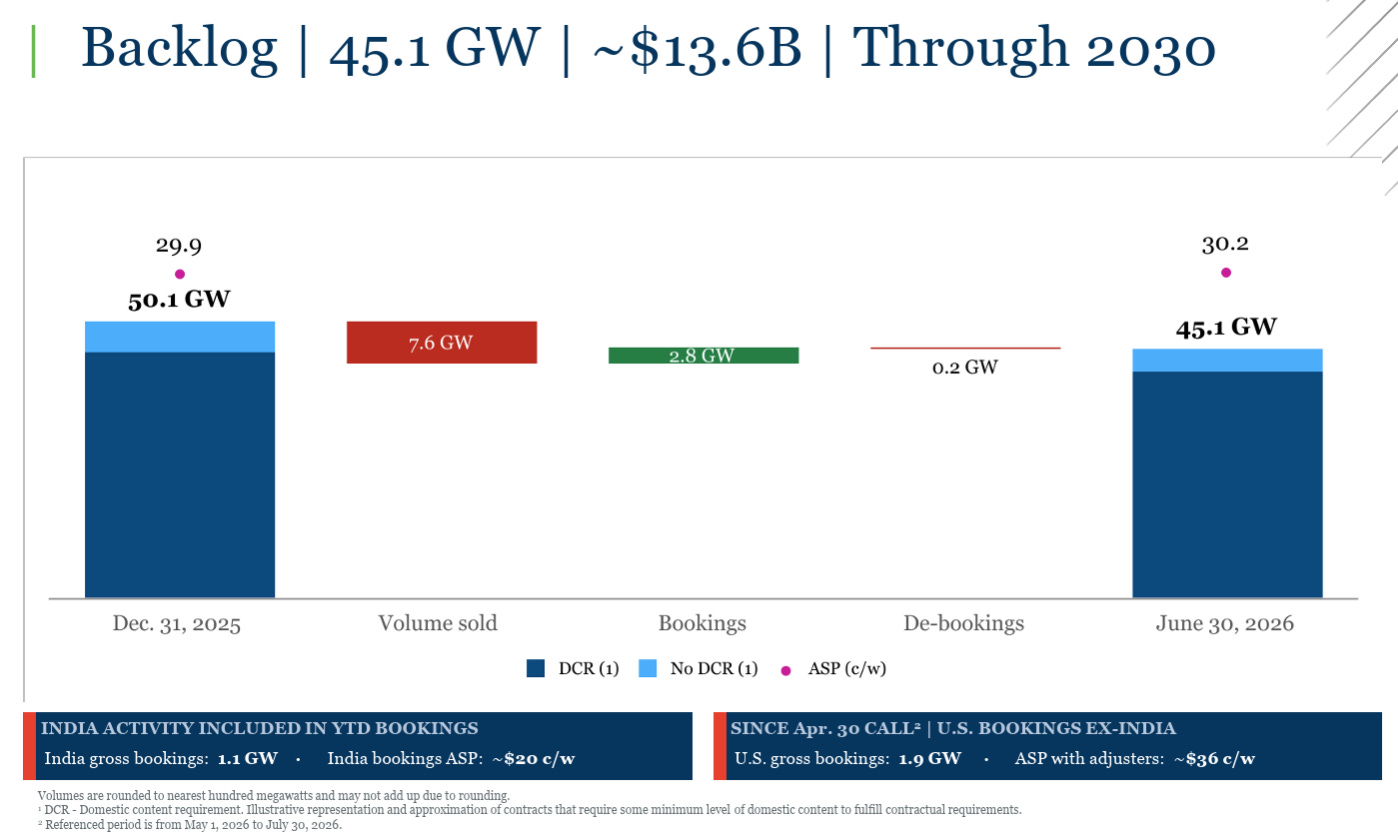
The bear case says this is a policy-dependent position that disappears once incentives fade, or global oversupply pushes prices down again. The contracted backlog is the counterargument: 45.1 gigawatts worth $13.6B through 2030, with US production substantially booked through 2028. That is more revenue visibility than most cyclical manufacturers get, even if the multiple the market pays for it should stay modest.
Economic Moat
As I see it, First Solar does not have a structural moat in the traditional sense. Solar modules are a commoditized product, and crystalline-silicon competitors can copy a price cut quickly. What protects the business today is policy, not technology: trade barriers and the Section 45X credit have fenced off the domestic market from the low-cost Chinese supply that dominates the rest of the world.
What still separates First Solar from its competitors is that its cadmium telluride process is a genuinely different technology - simpler, with a shorter supply chain, and no dependence on polysilicon pricing. That gives it a lower carbon footprint and stronger yields in hot, humid climates, but it does not give it a durable cost advantage. On a pre-credit basis, FSLR cost per watt runs modestly above its crystalline-silicon competitors. Without the 45X credit, the moat argument would be much weaker.
Analyst’s note:
I am calling this a no-moat business on purpose, even though the balance sheet and the backlog are genuinely strong. A moat has to survive a change in policy, and First Solar’s current advantage mostly does not.
Contracted demand is the more durable protection. The backlog runs 45.1 gigawatts and $13.6B through 2030, and US production is substantially booked through 2028. Developers pay a premium for that certainty: the average selling price on new US bookings was $0.36 per watt in Q2 2026, with room to charge more through so-called technology adjusters as CuRe and perovskite improvements roll out.
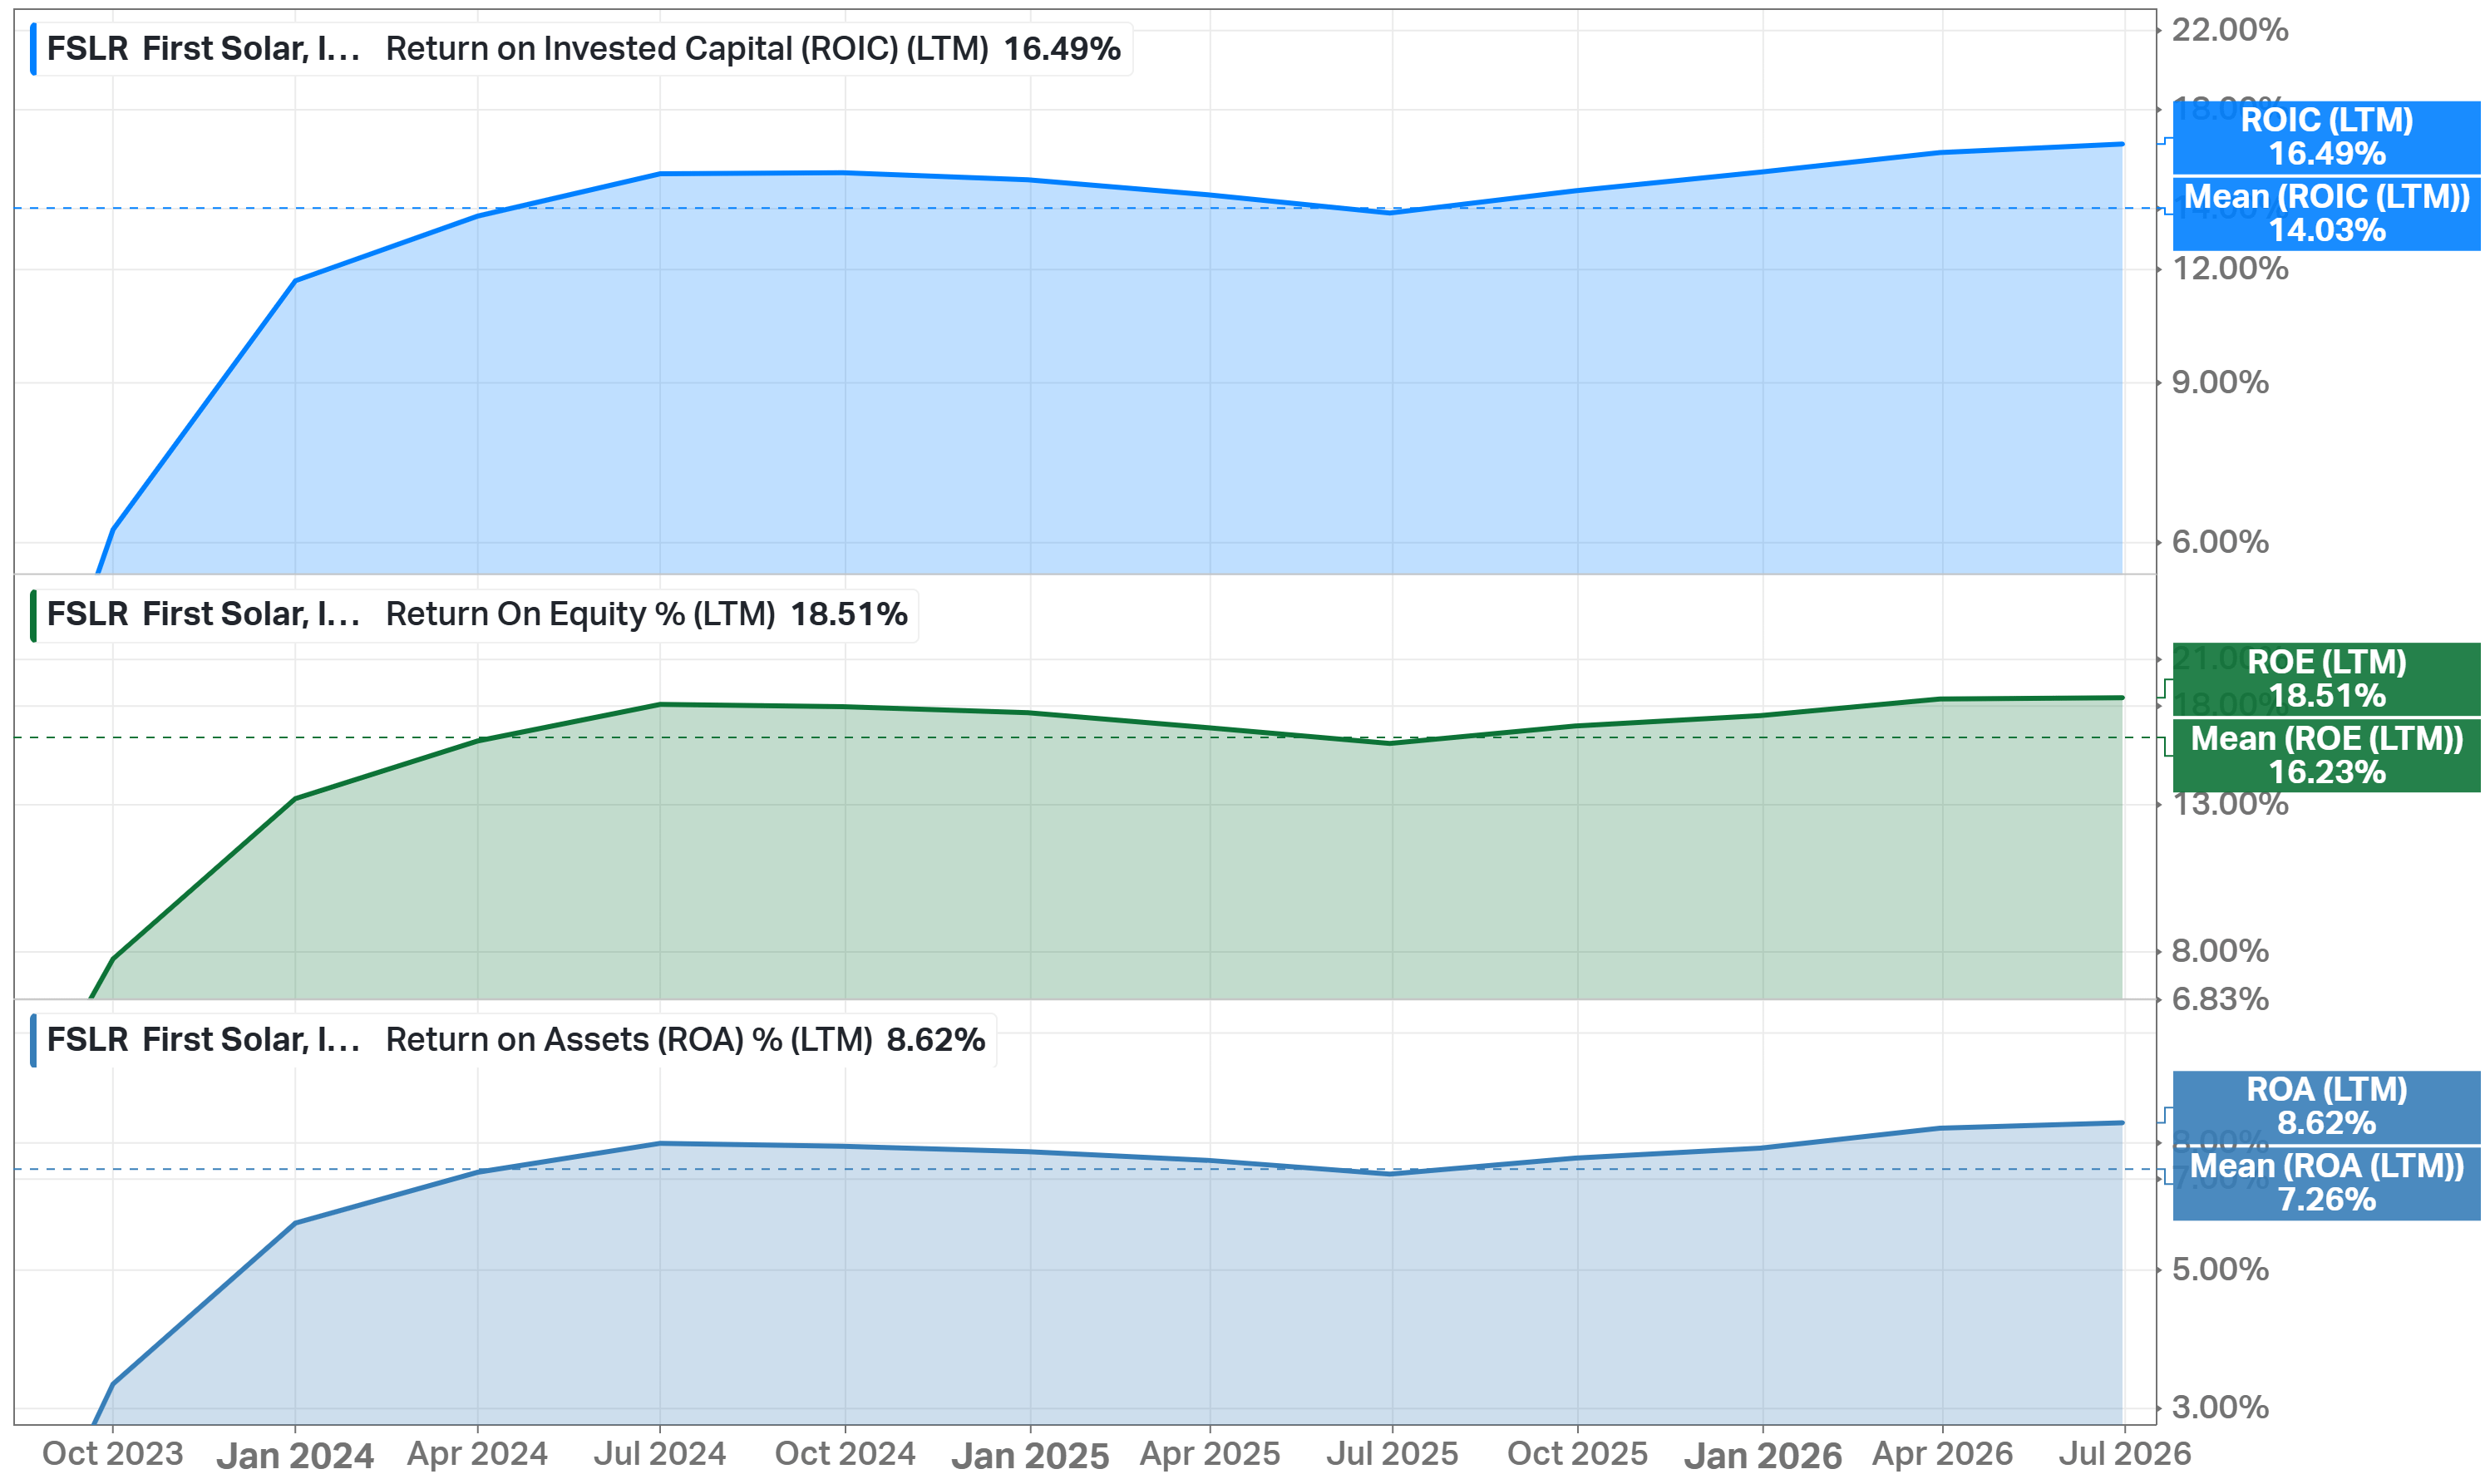
The returns on capital confirm the improvement, even without a classic moat. ROIC is 16.5% against a 14.0% 5Y mean, ROE is 18.5% against 16.2%, and ROA is 8.6% against 7.3%. All three increased sharply from below 6% in 2023 to today's levels, as the tax-credit-driven margin expansion flowed straight to the bottom line. Among its solar-equipment competitors, only Nextpower (NXT) does better on this measure, at 23.6% ROIC; Enphase (ENPH), Sunrun (RUN), and SolarEdge (SEDG) are all in the mid-single digits or negative.
Business Strategy
Here, I would like to define four choices that create the strategy. First, US-first manufacturing. Domestic capacity is on track to reach about 14 gigawatts once current expansions are complete, and a new finishing facility in South Carolina will let the company complete modules started at its international plants inside the United States. Management gives priority to integrated US factories when allocating production, which reduces dependence on short-cycle international demand.
Second, contract discipline over volume. Management continues to focus on pricing, contract quality, and balanced risk terms rather than booking volume for its own sake. The result is the backlog of 45.1 gigawatts - demand from large corporate energy users and data-center customers adds to that pipeline.
Third, a technology roadmap built around CuRe and perovskites. FSLR has started customer notifications tied to CuRe contract adjusters, the first step in converting performance improvements into future revenue. Management says factory and field results have exceeded expectations across several climates. The company is also advancing a perovskite program, with a Series 6 pilot line expected in the first half of 2027 - the next differentiation wave once crystalline silicon closes the current efficiency gap.
Fourth, capacity as the only real margin lever. Roughly 80% of operating expenses are fixed, and long-term pricing power on the panels themselves is limited, so further capacity growth (not price increases) is what expands operating margins from here. Every gigawatt added toward the 14-gigawatt US target flows mostly to the bottom line once it is running.
Capital Allocation
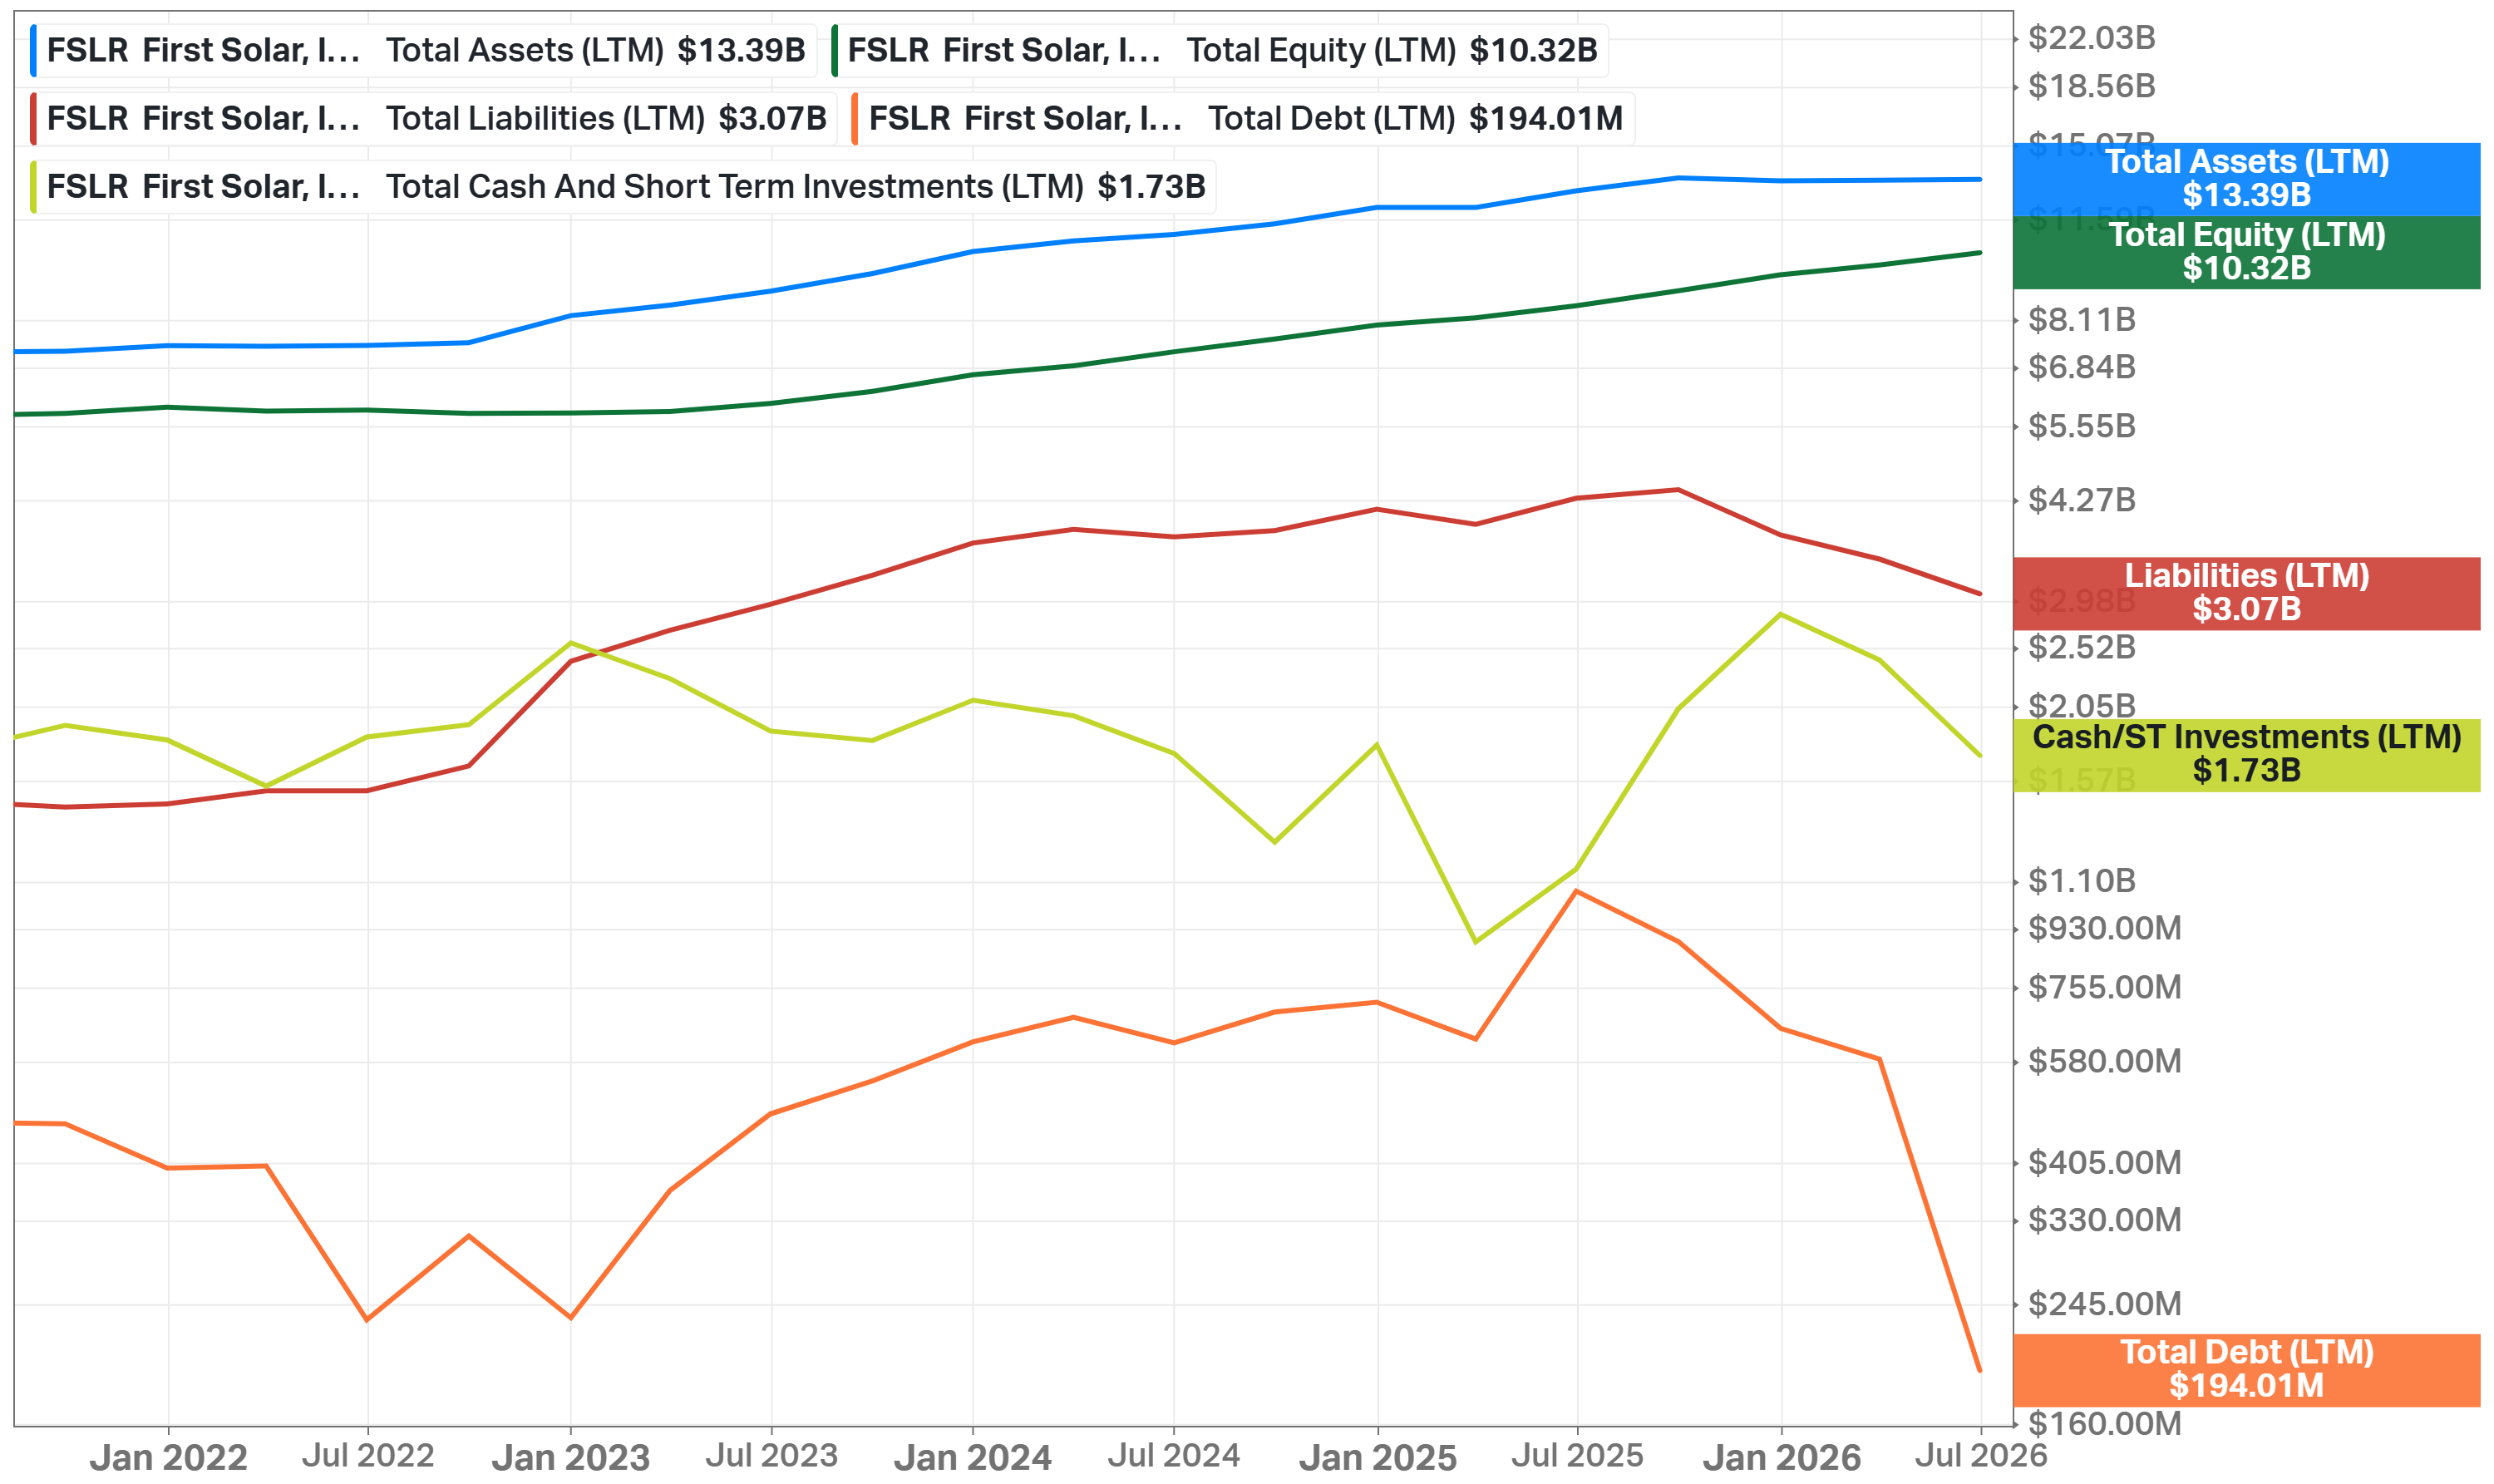
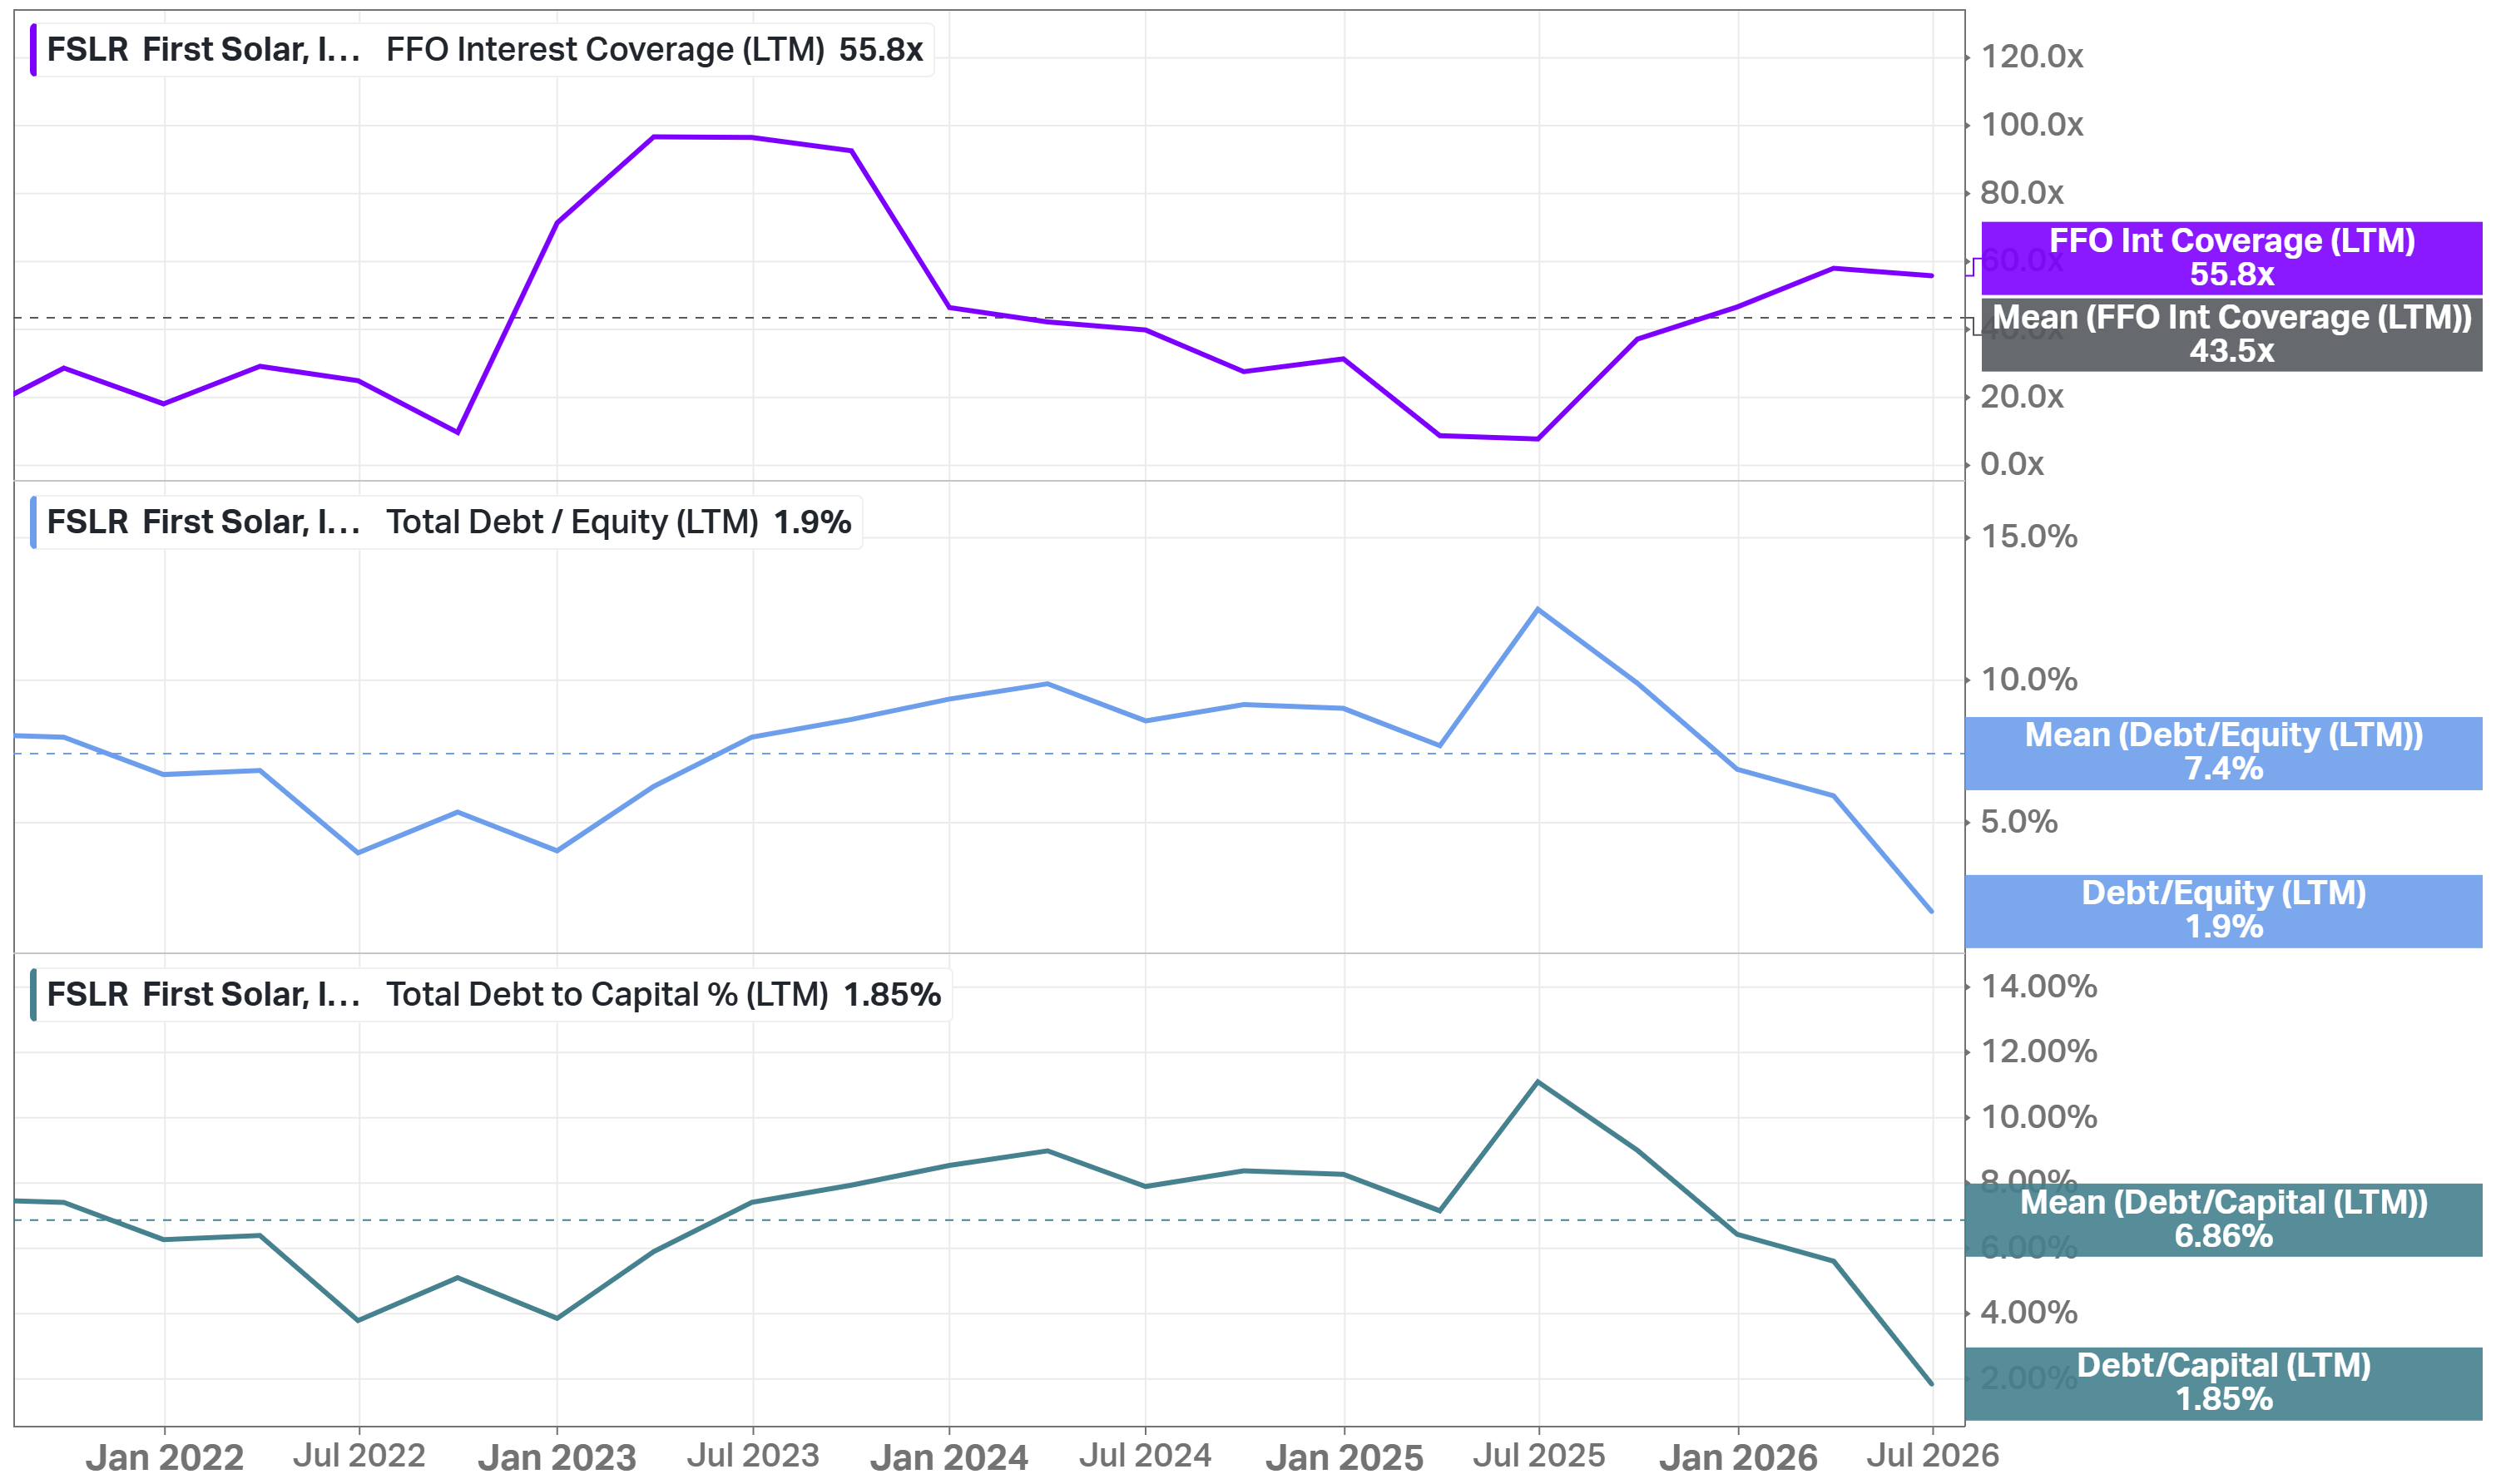
The balance sheet is very conservative. Total assets are $13.4B against $10.3B of equity and just $3.1B of liabilities. Cash and short-term investments are $1.7B against only $194M of total debt - net cash of roughly $1.5B. FFO interest coverage is 55.8x against a 43.5x 5Y mean. Debt/Equity is just 1.9%, next to 51.9% for Enphase, 98.9% for SolarEdge, and 292.5% for Sunrun. Whatever tariffs or module pricing do next, First Solar is not a solvency risk.
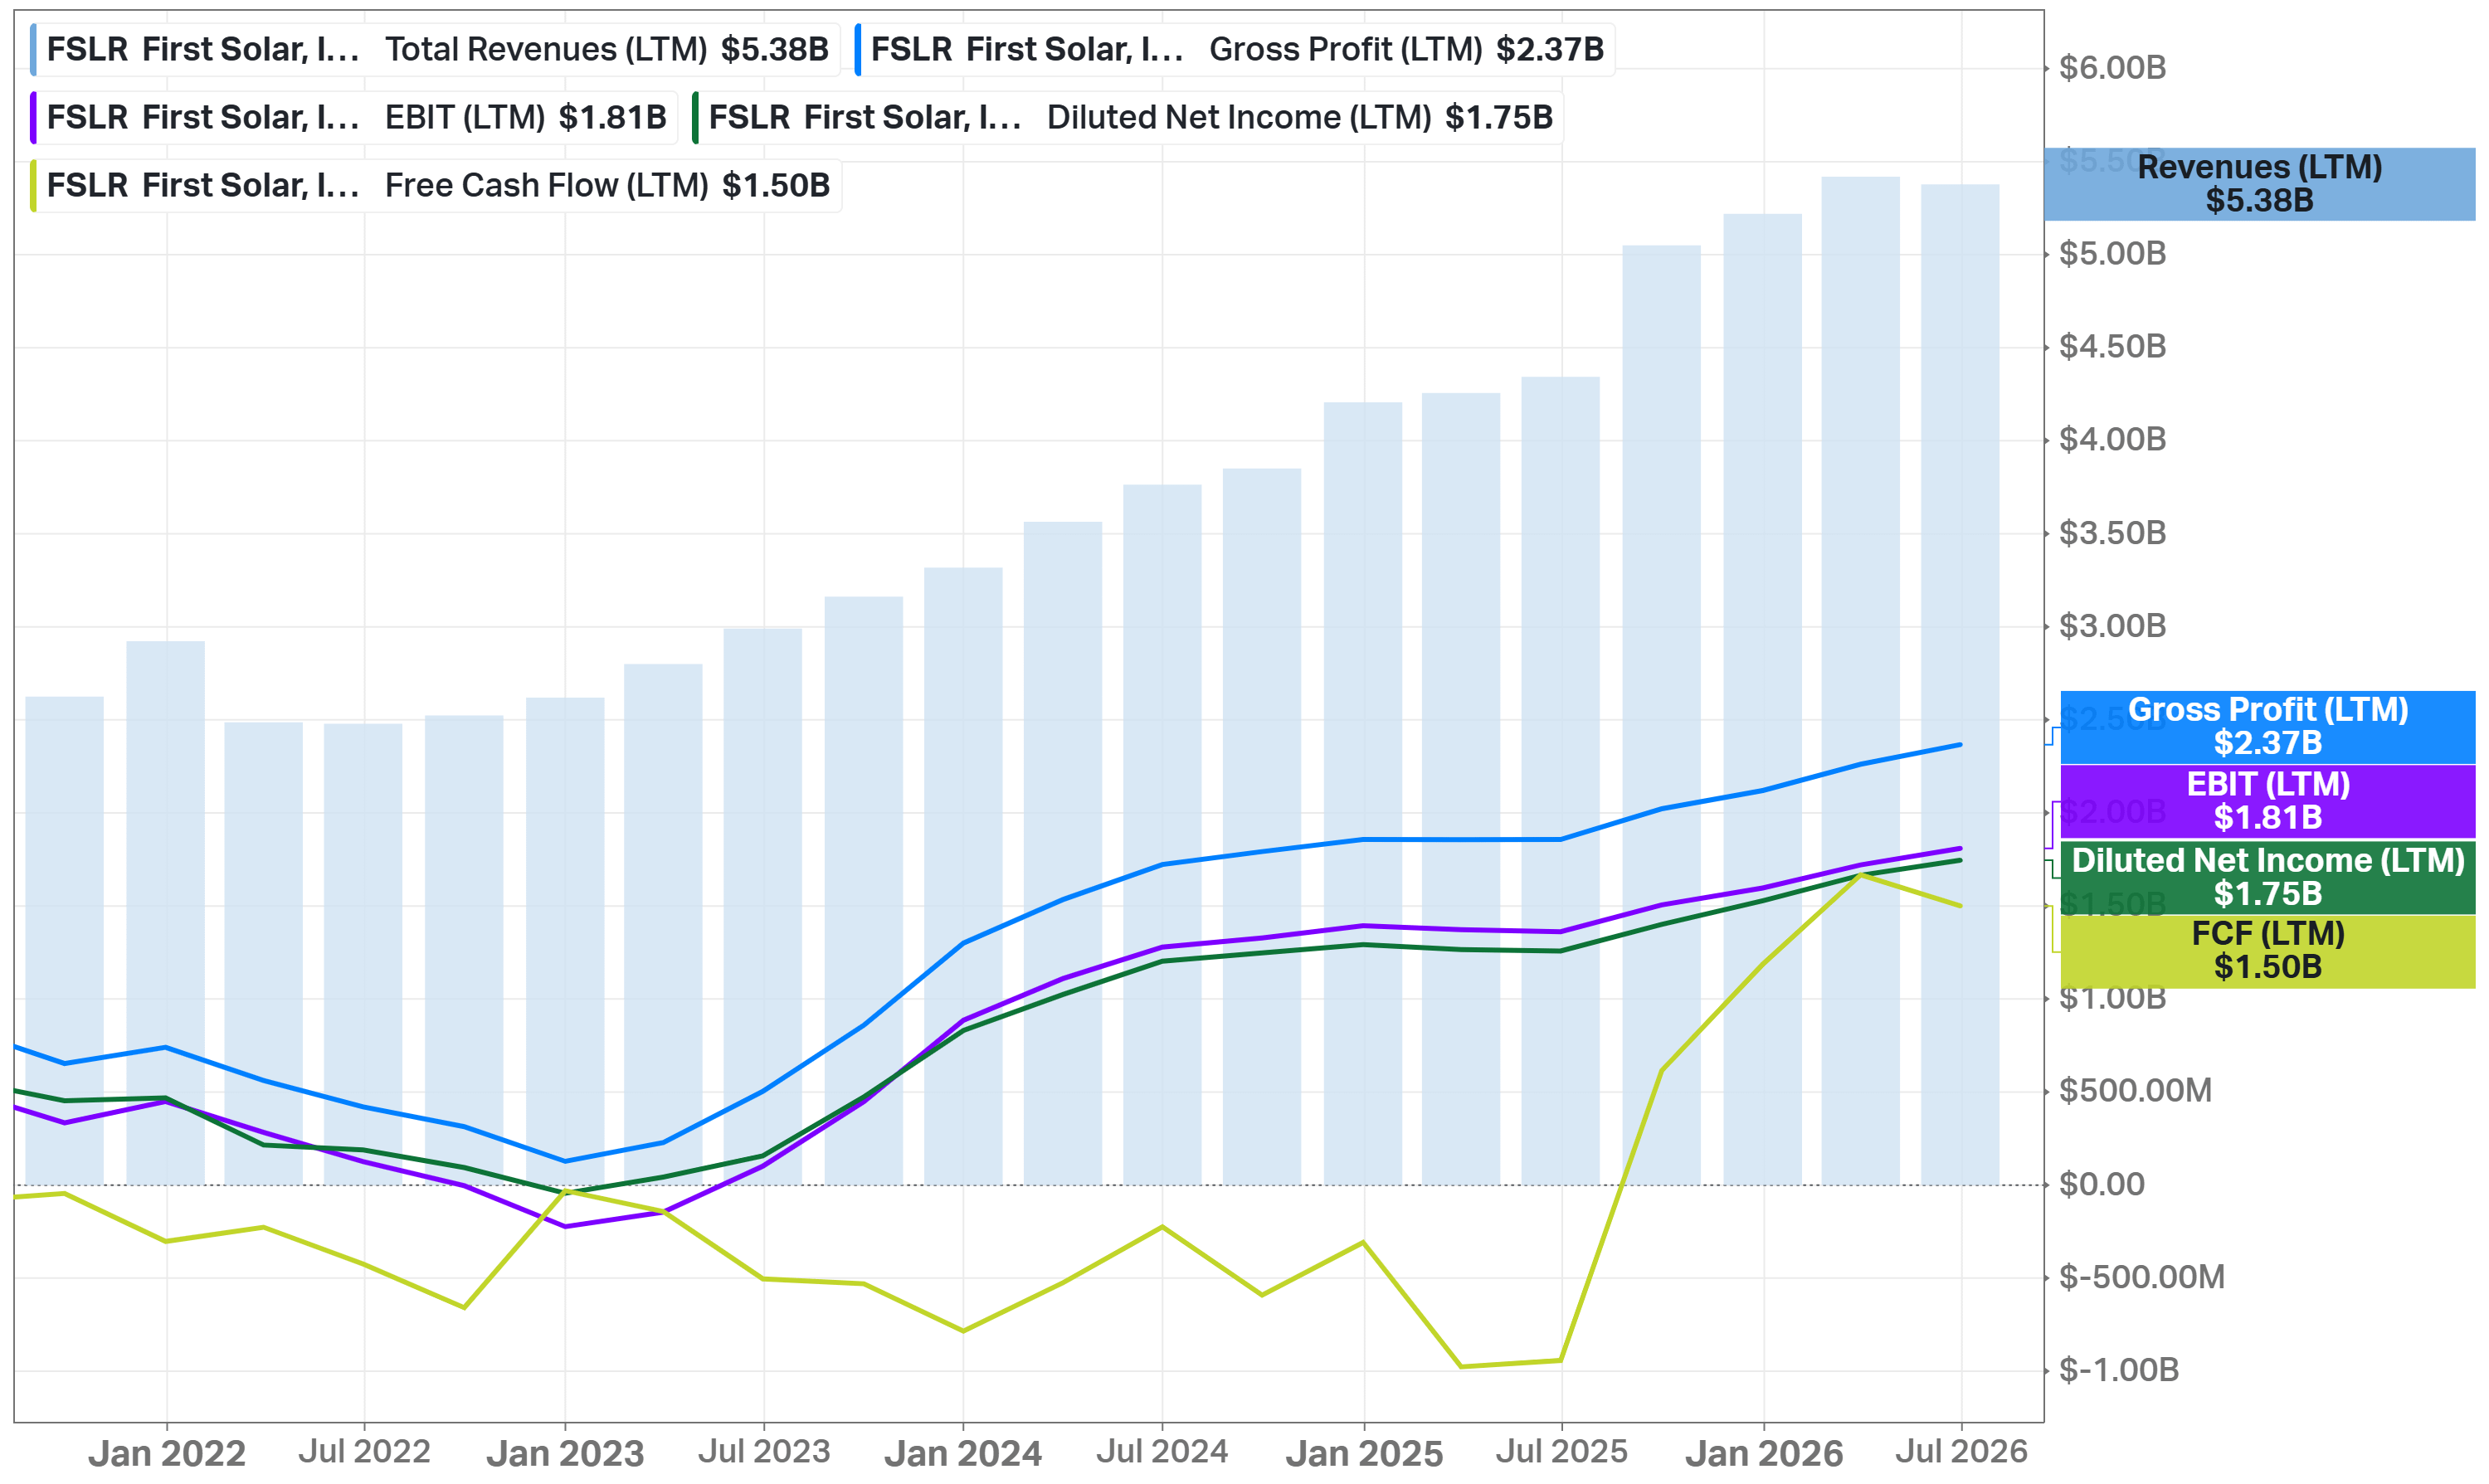
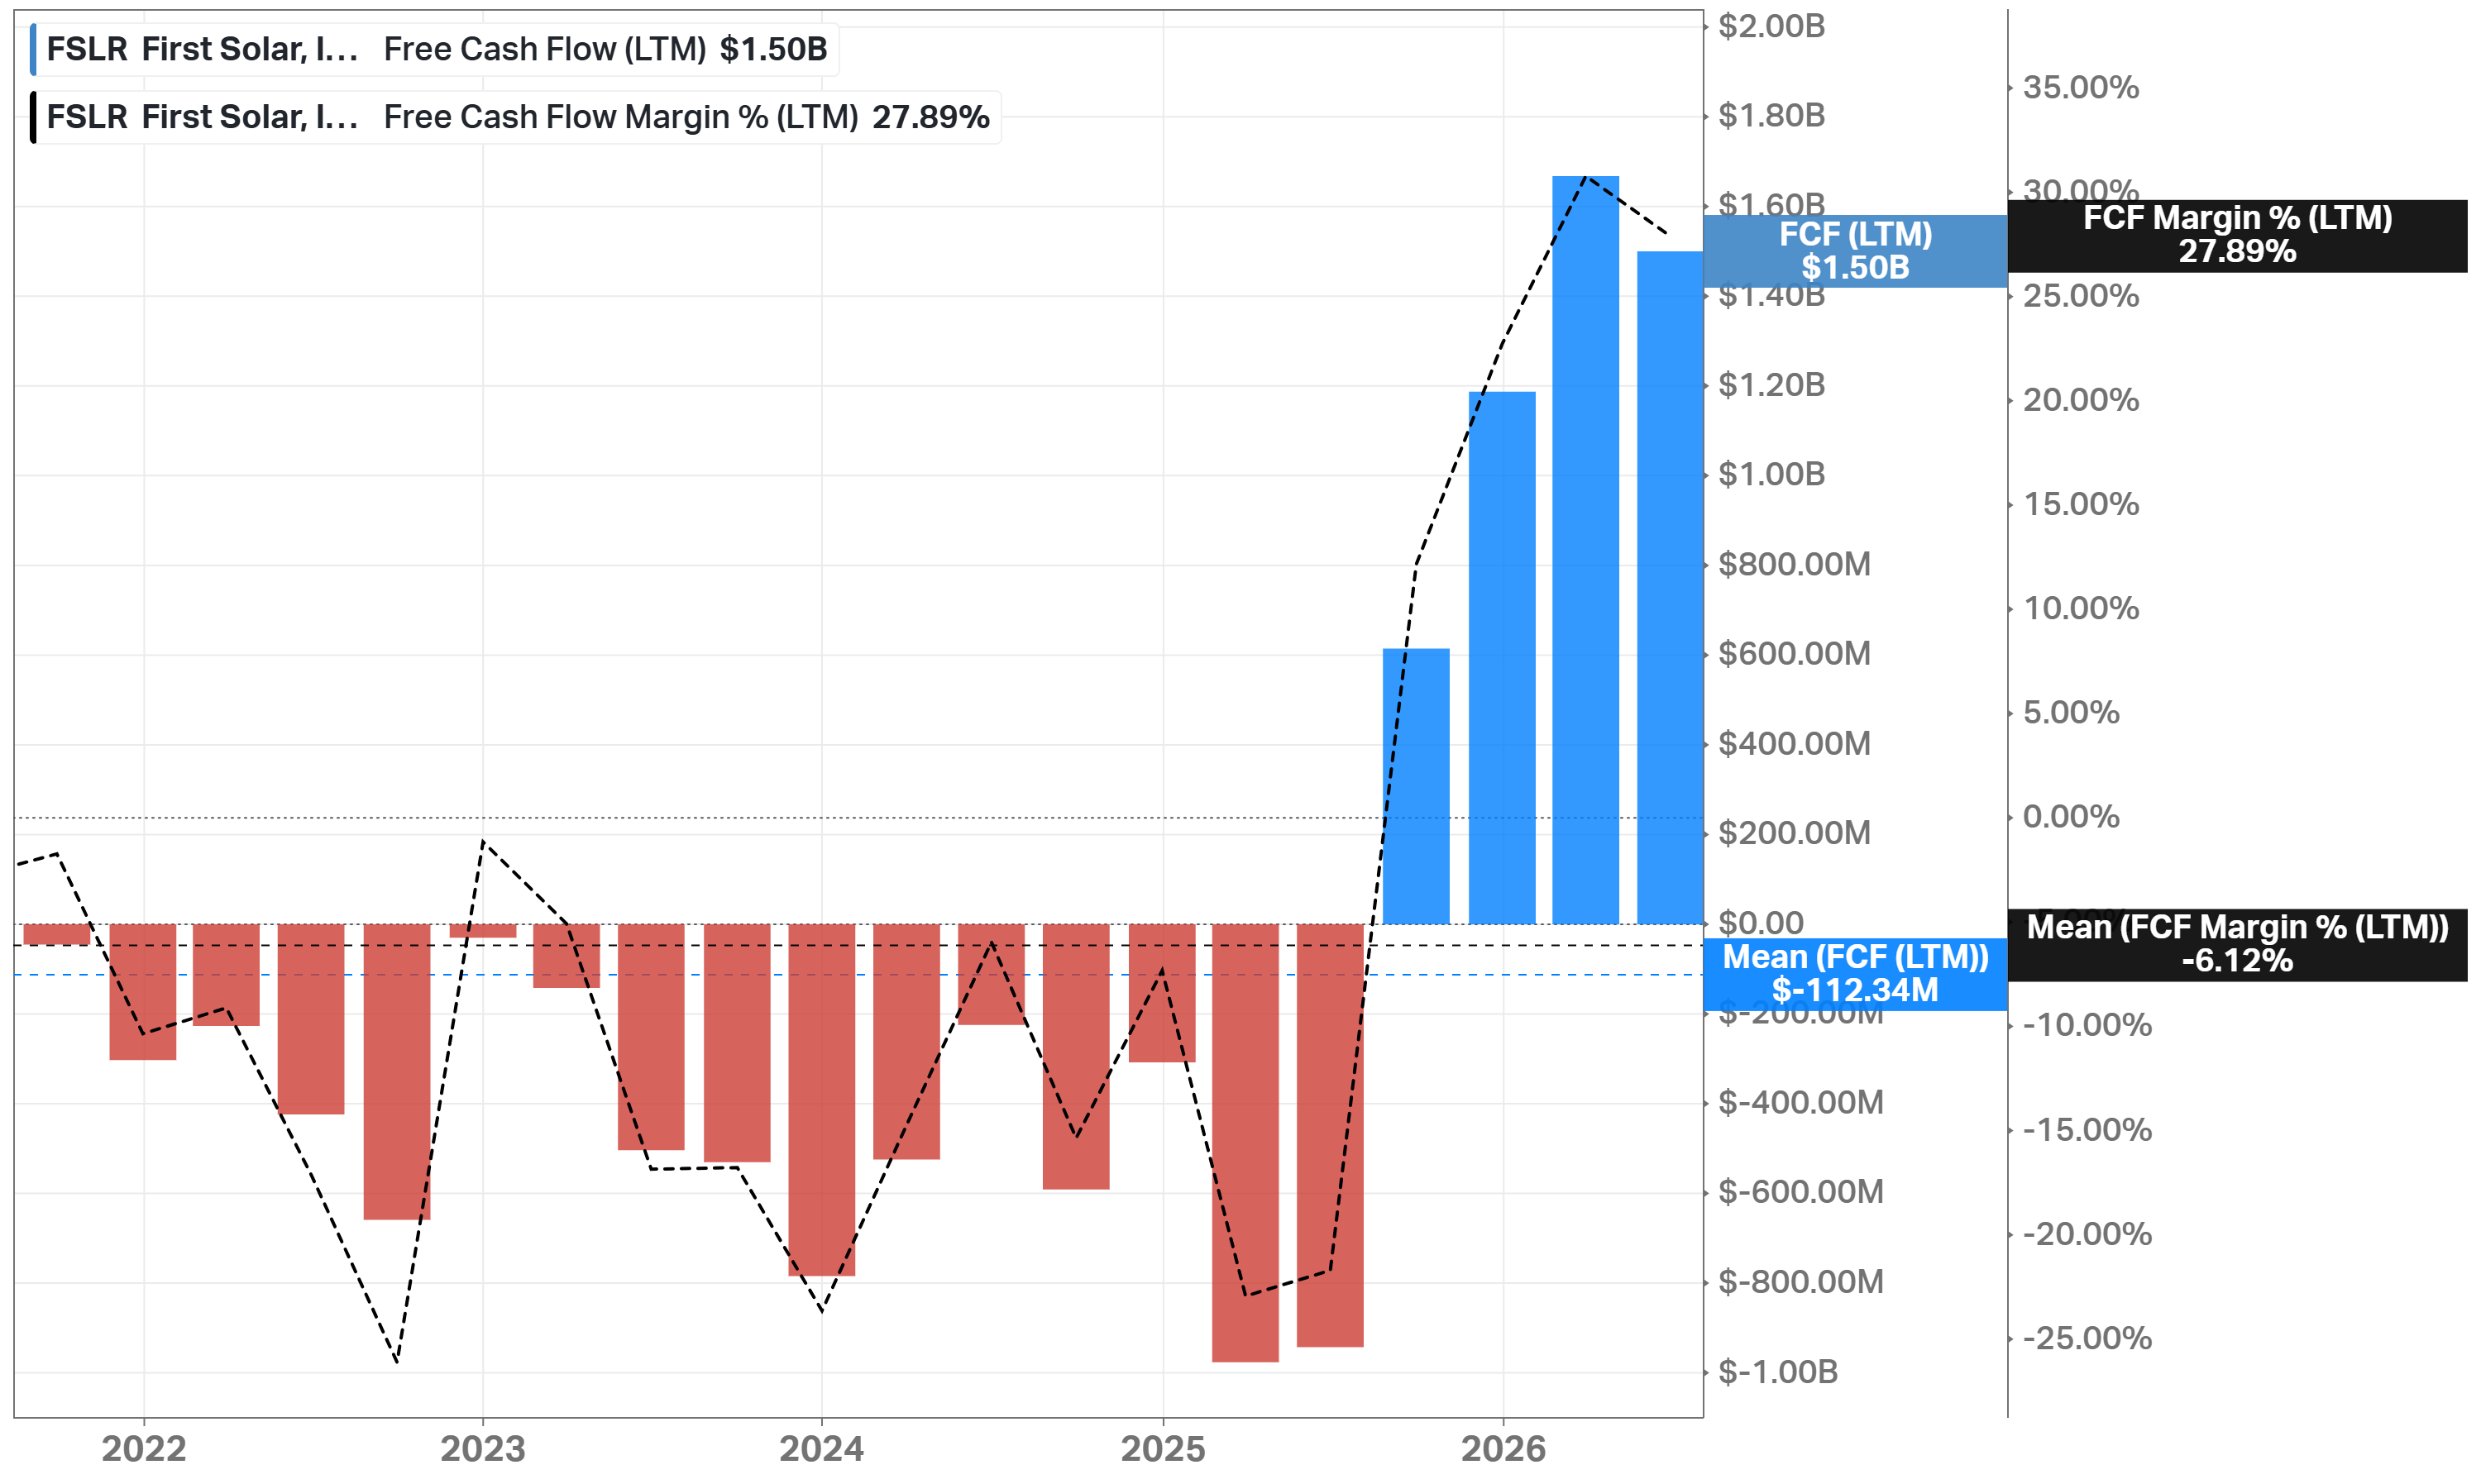
FCF only turned reliably positive in 2025, after years of funding capacity expansion from the balance sheet. LTM FCF is $1.5B, a 27.9% margin, against a 5Y mean of -6.1%. The company was still burning cash as recently as 2023 and 2024 while it built out its US and India capacity. There is no dividend and effectively no buyback.
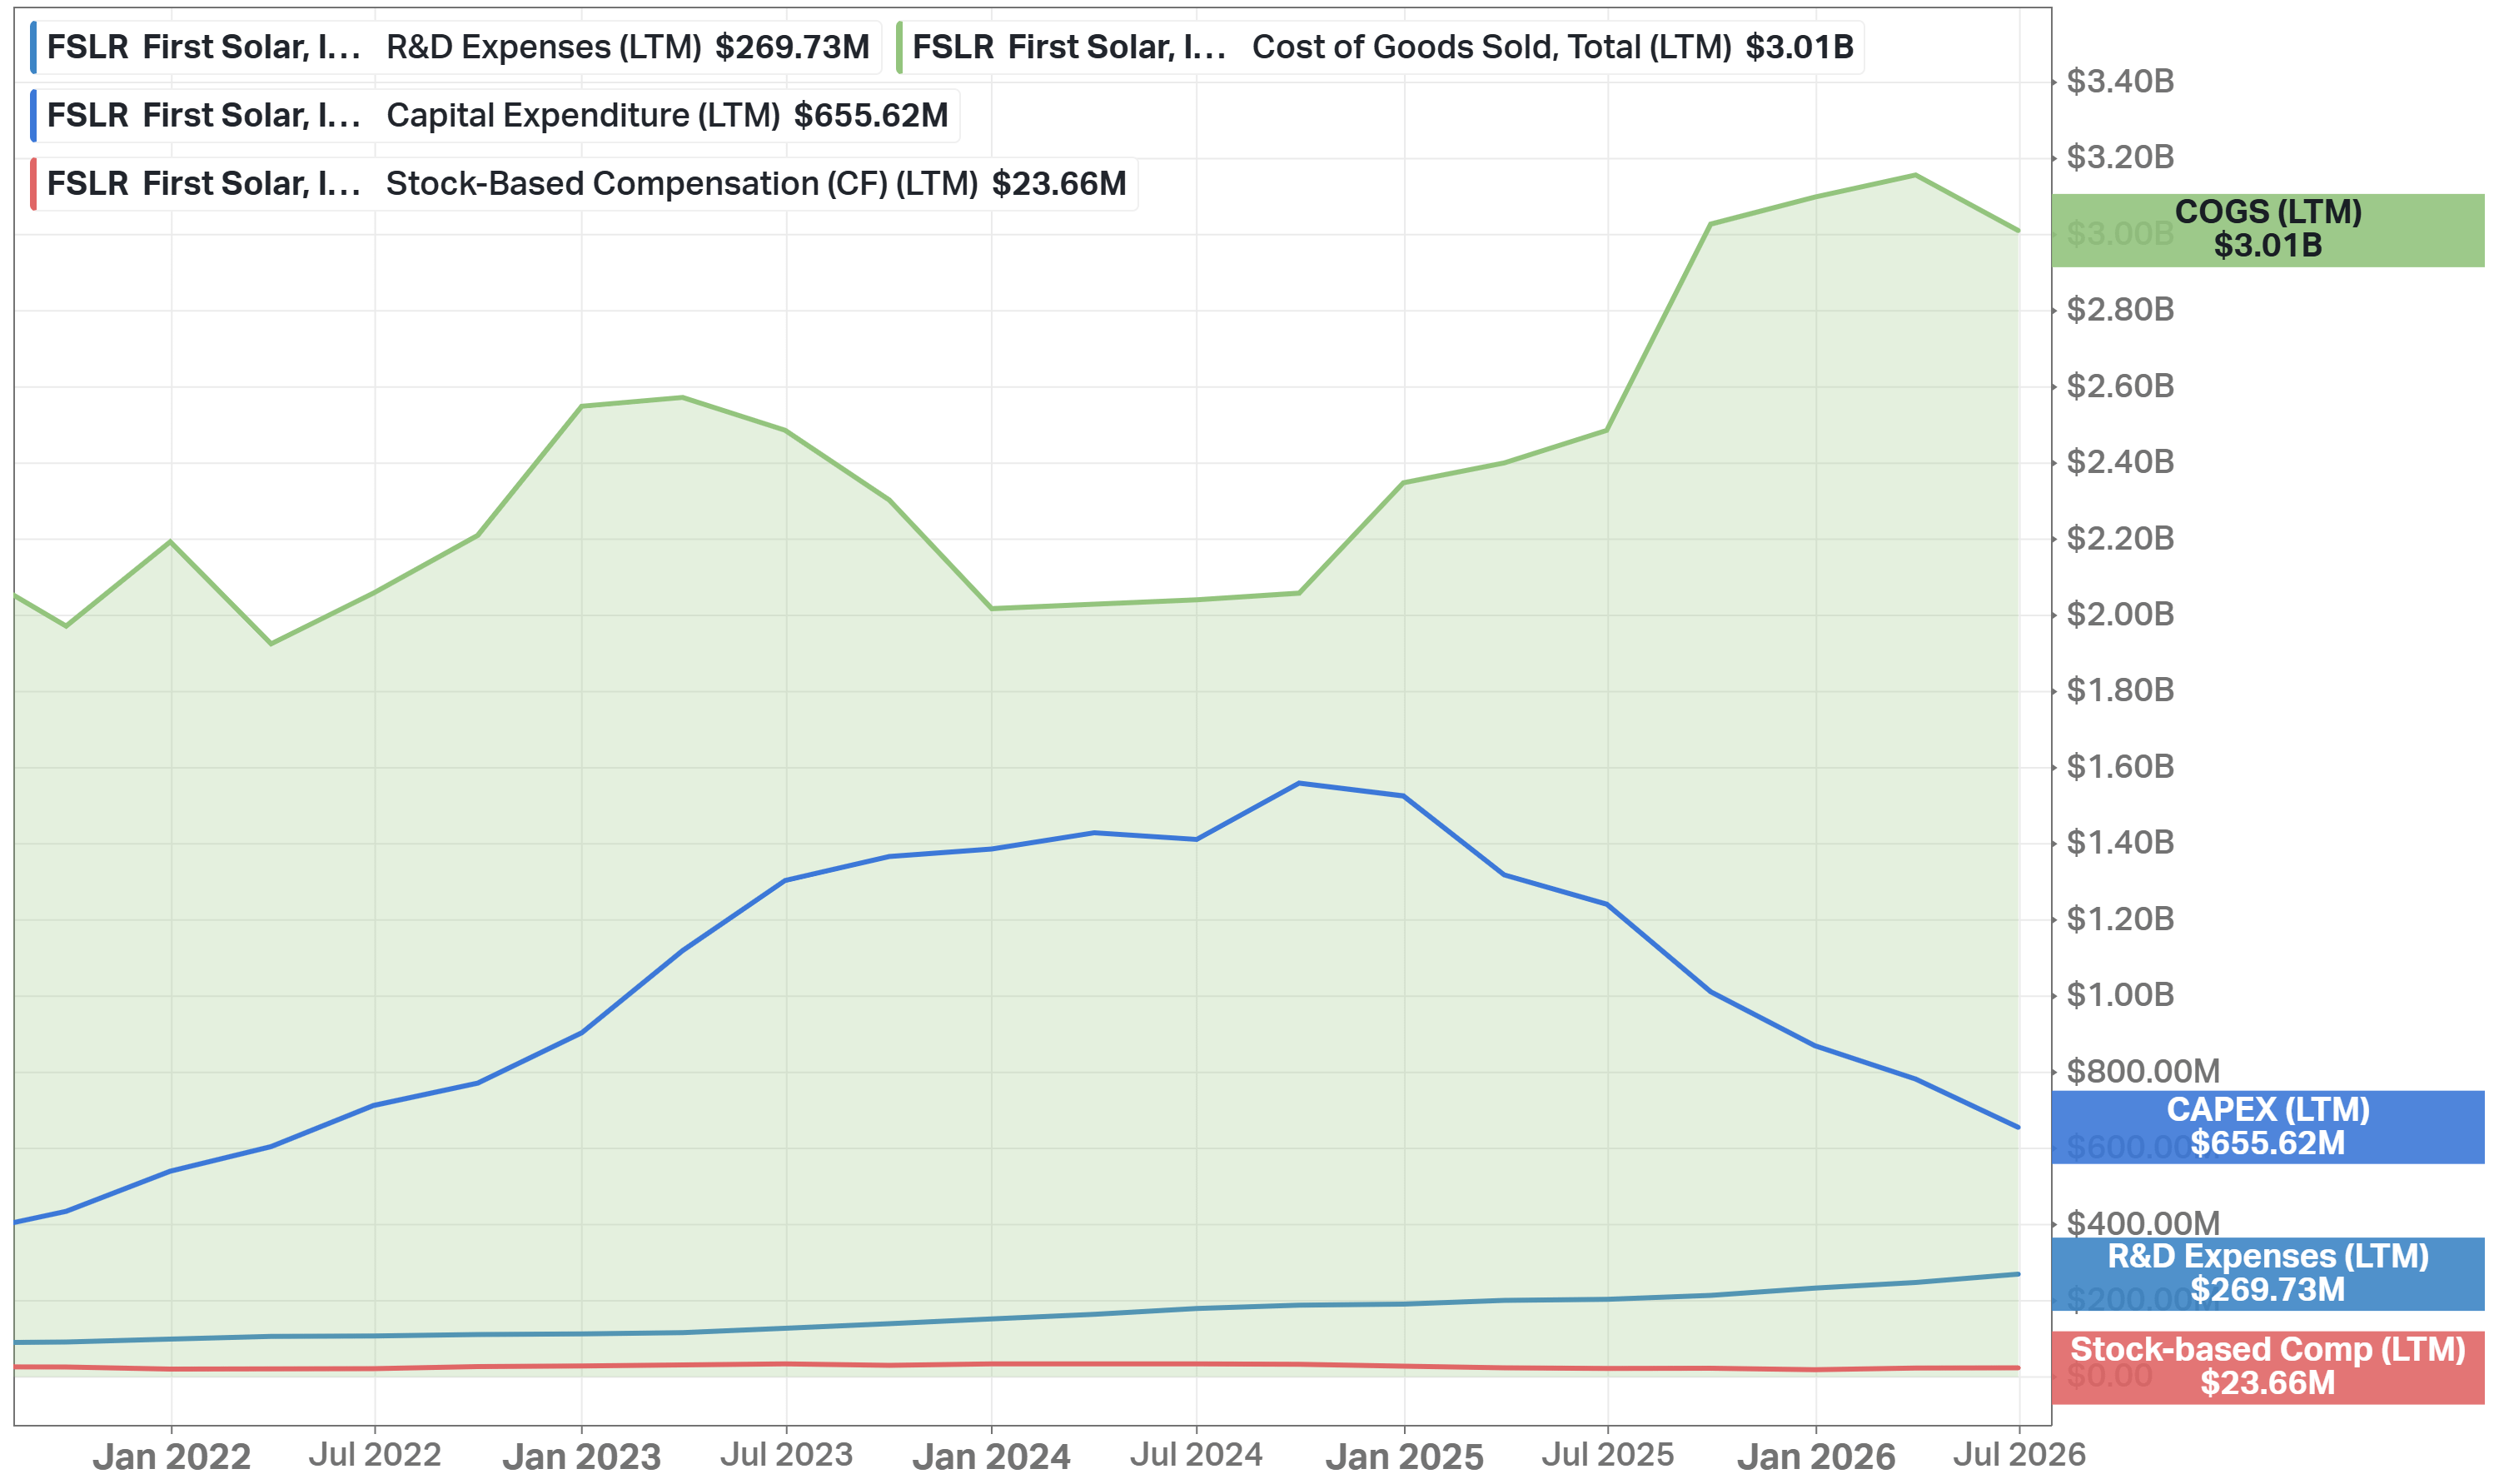
Capex is funding the US and India build-out: $655.6M LTM, down from a peak above $1.5B in early 2025 as the domestic expansion phase matures. R&D spending is comparatively small at $269.7M LTM - this is a manufacturing-scale business, not an R&D-intensive one. Stock-based compensation is only 0.44% of revenue LTM, low even by the standards of a capital-intensive industry.
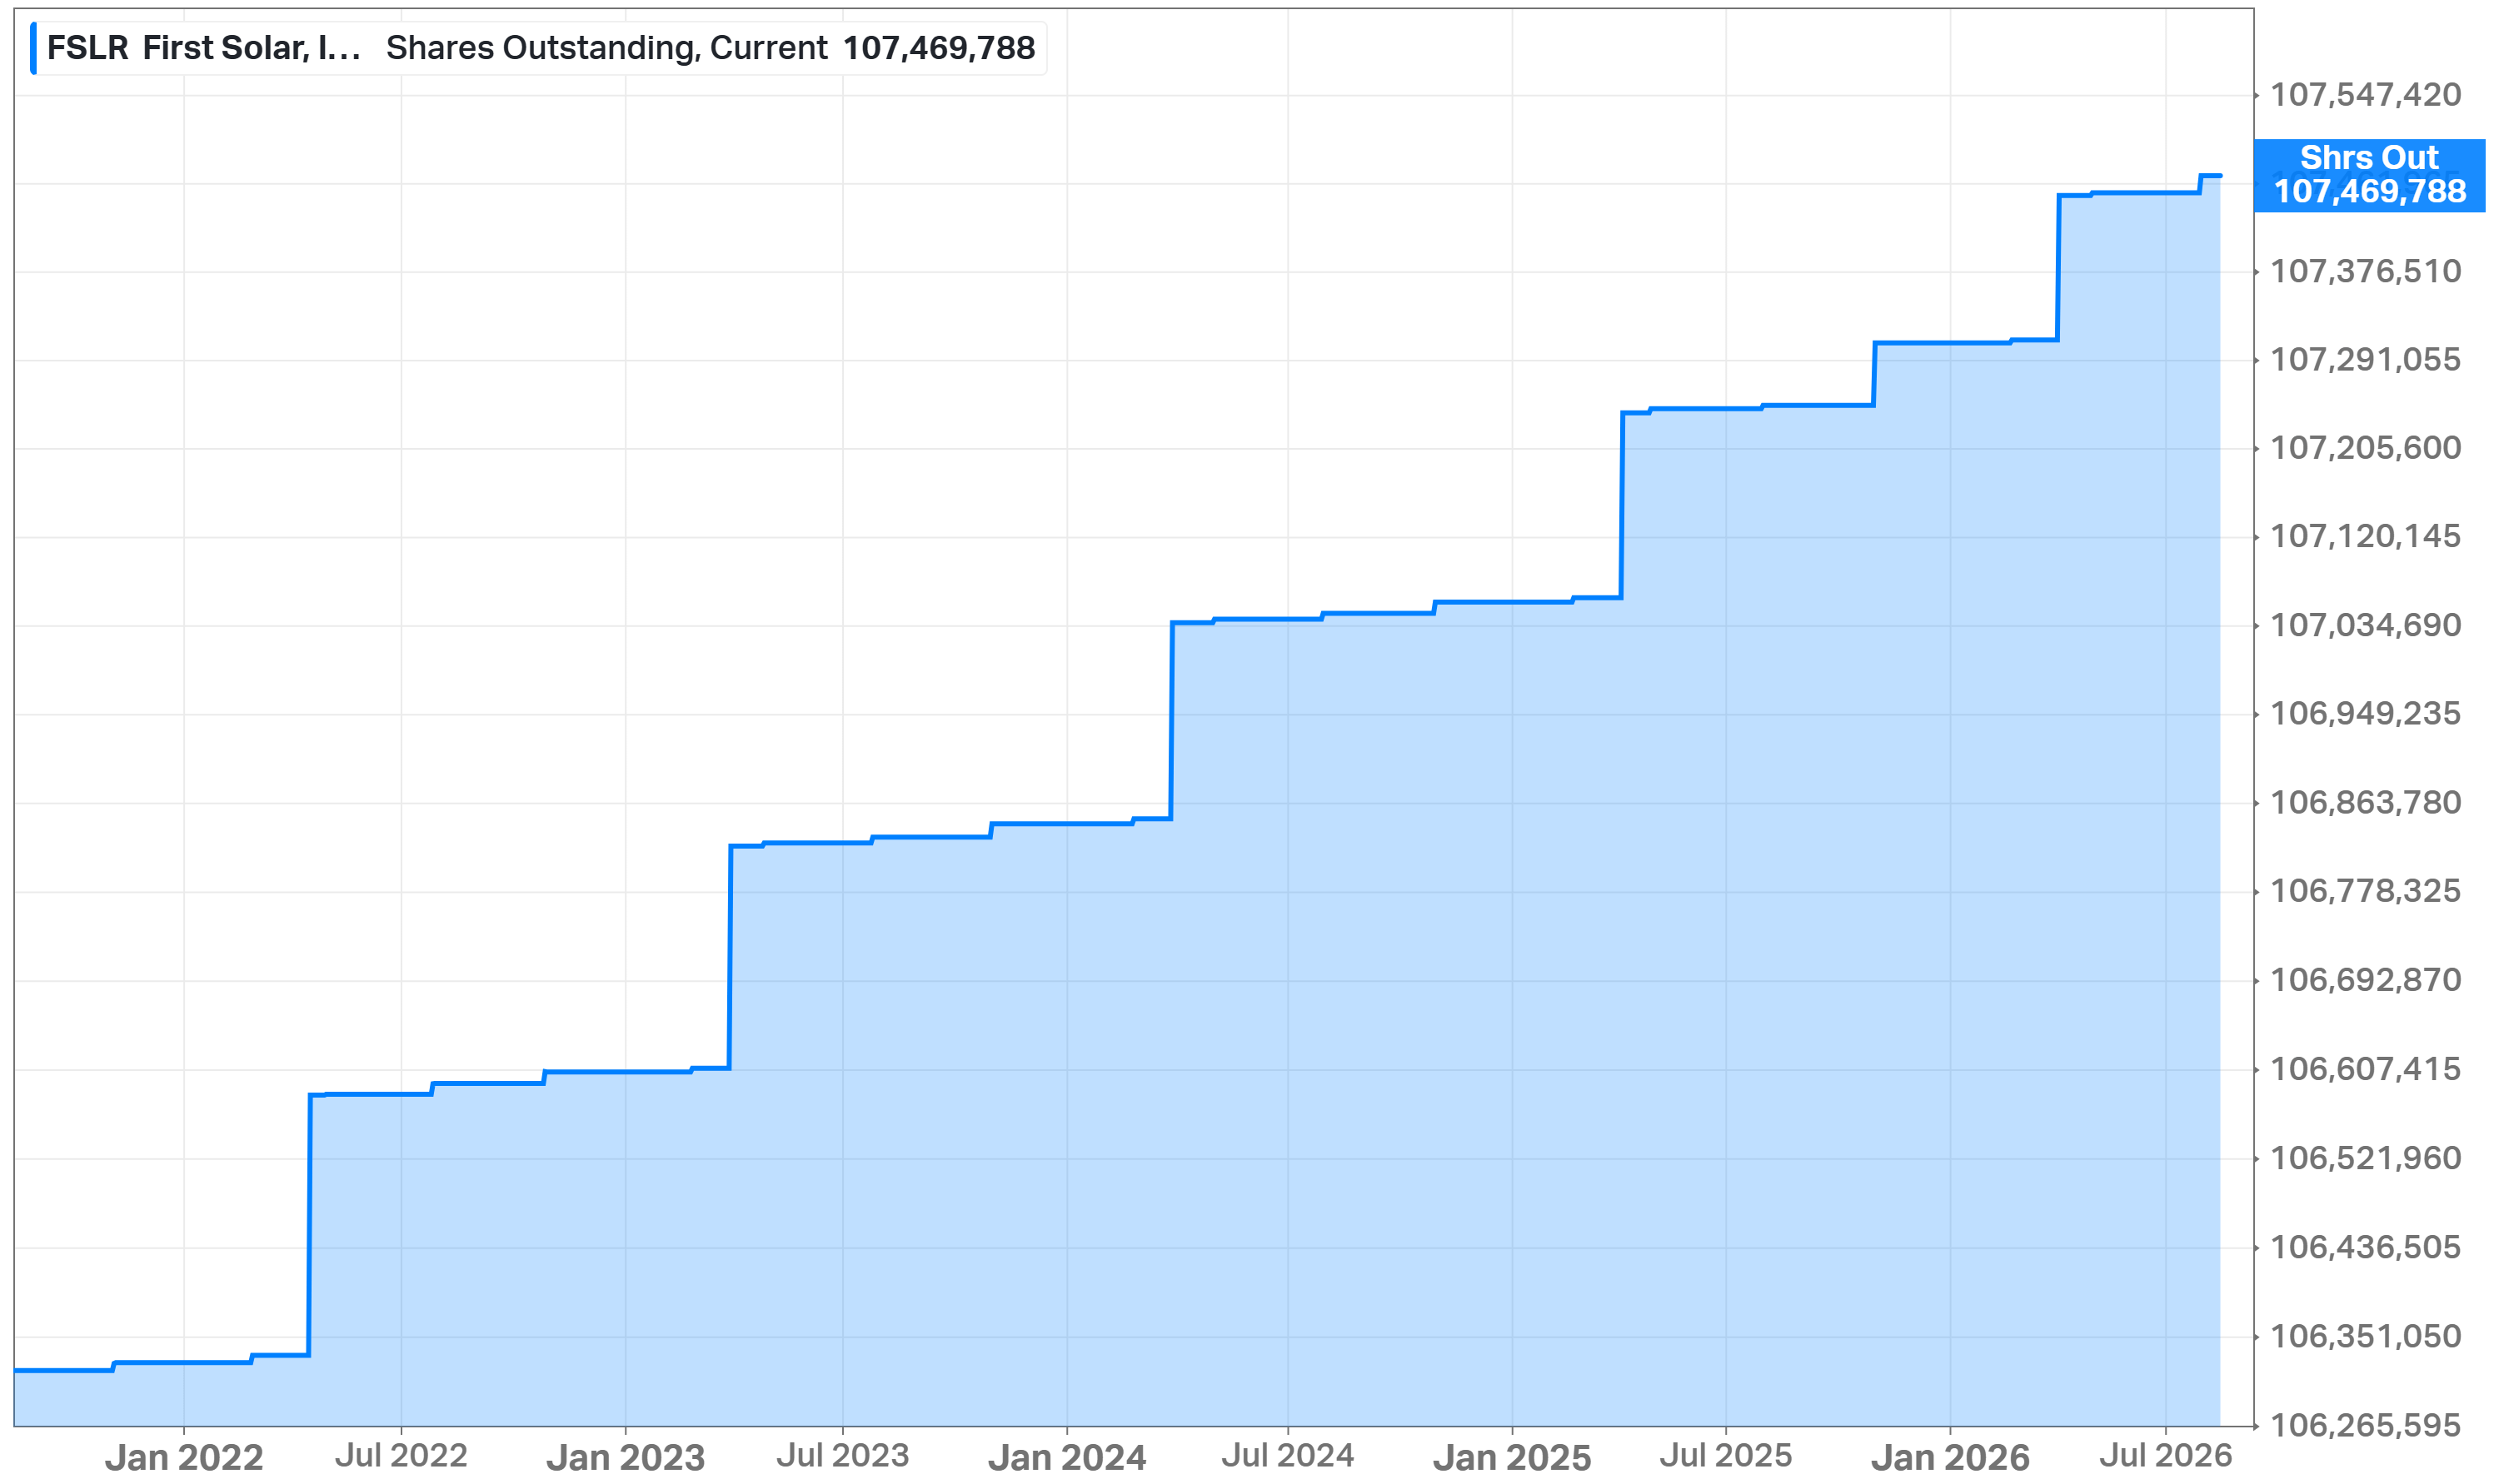
Shares outstanding have increased slightly to 107.47M on modest stock-based compensation.
Advantages
A strong balance sheet in a cyclical industry. Net cash of roughly $1.5B, FFO interest coverage of 55.8x, and almost no debt. FSLR has the resources to outlast competitors that have failed in past solar-industry downturns.
Demand visibility most manufacturers do not have. A 45.1 gigawatt, $13.6B backlog running through 2030, with US production substantially committed through 2028.
US policy has fenced off its core market. Section 45X tax credits worth $2.10-2.19B are built into 2026 guidance, trade barriers keep low-cost imports out, and the company holds an estimated 30% share of the US utility-scale market.
Cheap on every basis. 10.8x forward earnings, a PEG of 0.51, a Price/Book of 2.3x, and a 9.3% forward earnings yield - all near the low end of their own history. The PEG is the cheapest among competitors still posting positive growth.
Margins keep expanding. 44.0% gross margin LTM against a 31.4% 5Y mean, 32.5% net margin against 20.1%, and a 16.5% ROIC that is still rising - both margins are the highest of its competitors.
Disadvantages
Earnings depend on a tax credit that could change. 2026 guidance assumes $2.10-2.19B of Section 45X credits - a large share of projected profitability. Any reduction in incentive value or added compliance complexity would reduce margins directly.
No structural cost advantage. On a pre-credit basis, First Solar’s cost per watt runs modestly above its crystalline-silicon competitors, and the broader industry is fiercely competitive and commoditized. SolarEdge’s own swing from a deeply negative gross margin in early 2025 back to positive within a year shows how quickly conditions can turn even for a US-listed equipment name.
Tariffs cut both ways. 2026 guidance assumes a net $60-80M tariff impact. A pending Section 232 investigation could affect close to 1.8 gigawatts of finished Southeast Asia capacity, and the company is already carrying about $30M of quarterly underutilization costs there.
Revenue is flat to down in 2026. Guidance of $4.9-5.2B implies a roughly flat year after the Southeast Asia capacity pullback. This year’s story is funded by margin and tax credits, not volume.
Little cushion in a drawdown. No dividend and effectively no buyback; a Beta of 1.75 and 1Y volatility near 54% mean large swings around every catalyst.
What the bears get right: a 9.2% short interest is real money betting the policy tailwind fades faster than the market expects. Their case is straightforward: the solar module industry has a long history of poor returns on invested capital, Chinese crystalline-silicon manufacturers have far more capacity than global demand needs, and roughly a third of First Solar’s own manufacturing footprint is in Southeast Asia, exactly where US tariff policy is least settled. If Section 45X credits shrink or a Section 232 ruling goes the wrong way, the earnings growth behind today’s cheap multiple could prove temporary. As I see it, the balance sheet and the contracted backlog are real protections, but the position only works if the policy backdrop holds, and that is not something a spreadsheet can fully price in.
Competitors
The competitors set here is: Enphase Energy (the quality benchmark, though its own growth has stalled), SolarEdge Technologies (a turnaround still working through a brutal 2024-2025 drawdown), Sunrun (the residential installer, financed with far more debt than the rest of the group), and Nextpower (a smaller name with the best returns on capital of the 5).
The obvious comparison set of large crystalline-silicon module manufacturers like JinkoSolar and Canadian Solar has too little fresh data on the tools I use for this series, so this is the US-listed solar-equipment group.
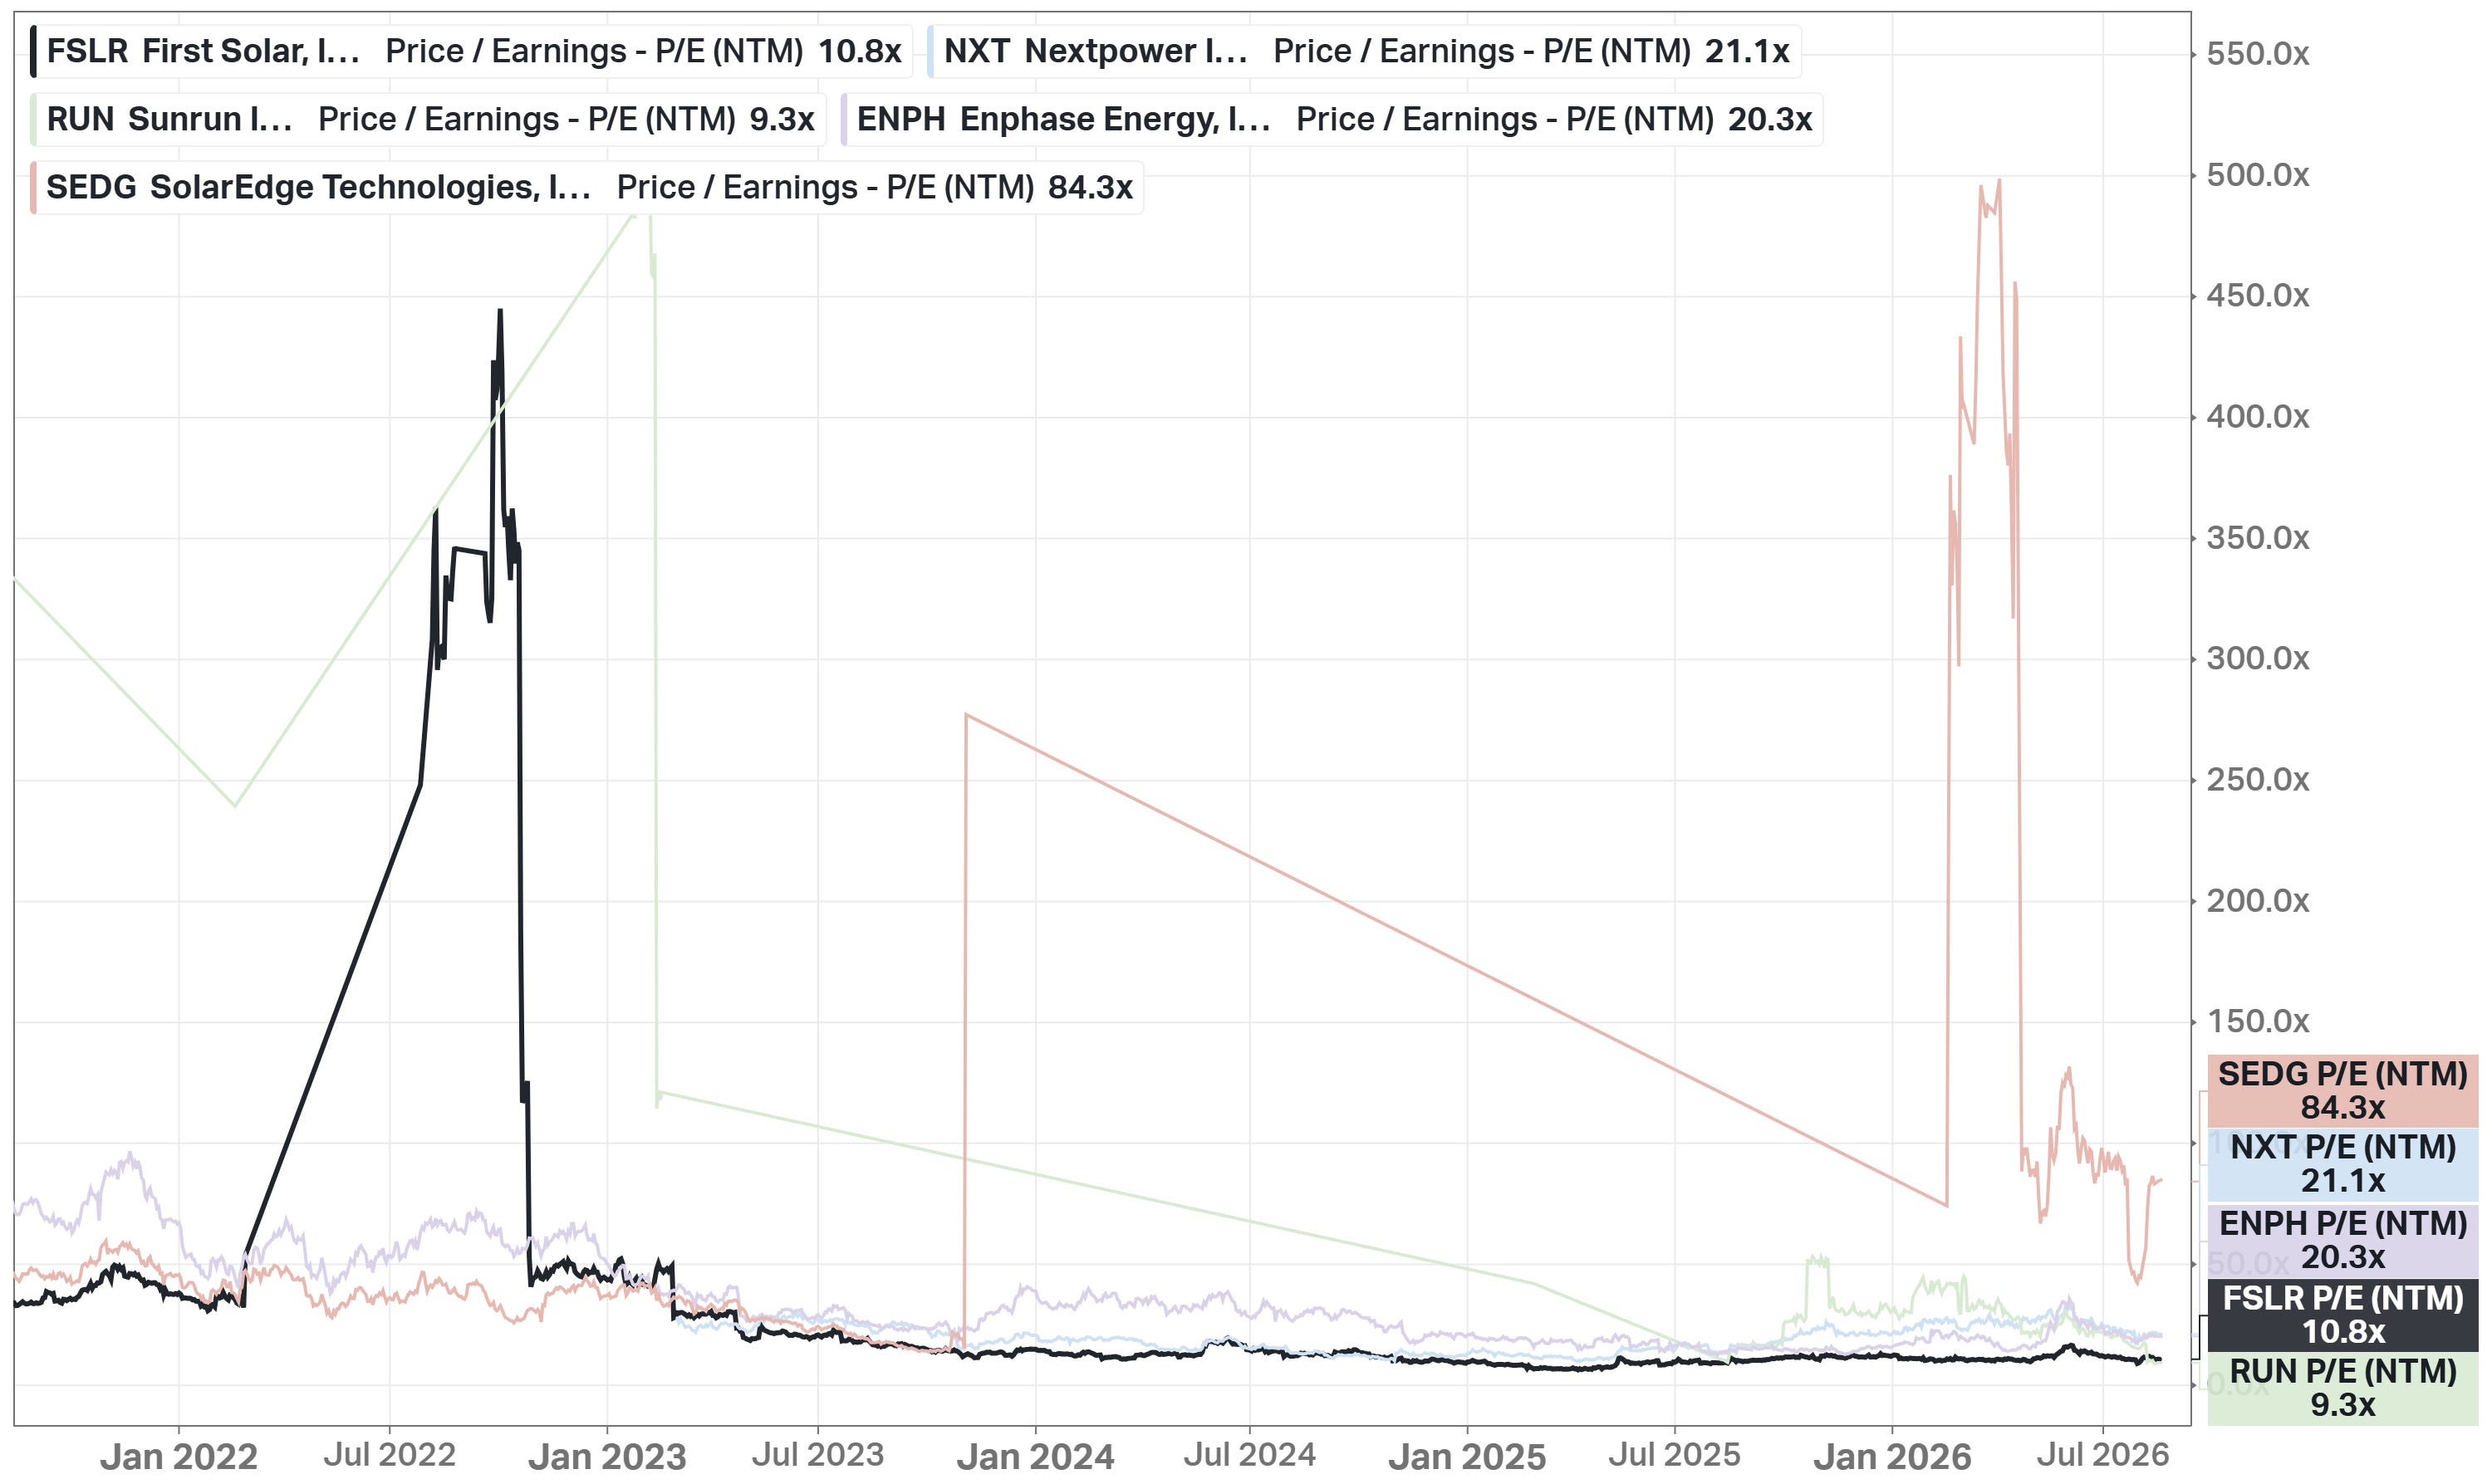
On forward P/E, First Solar is at 10.8x. Sunrun is lower at 9.3x; Enphase is at 20.3x, Nextpower at 21.1x, and SolarEdge at a distorted 84.3x - a symptom of earnings that only recently turned positive again.
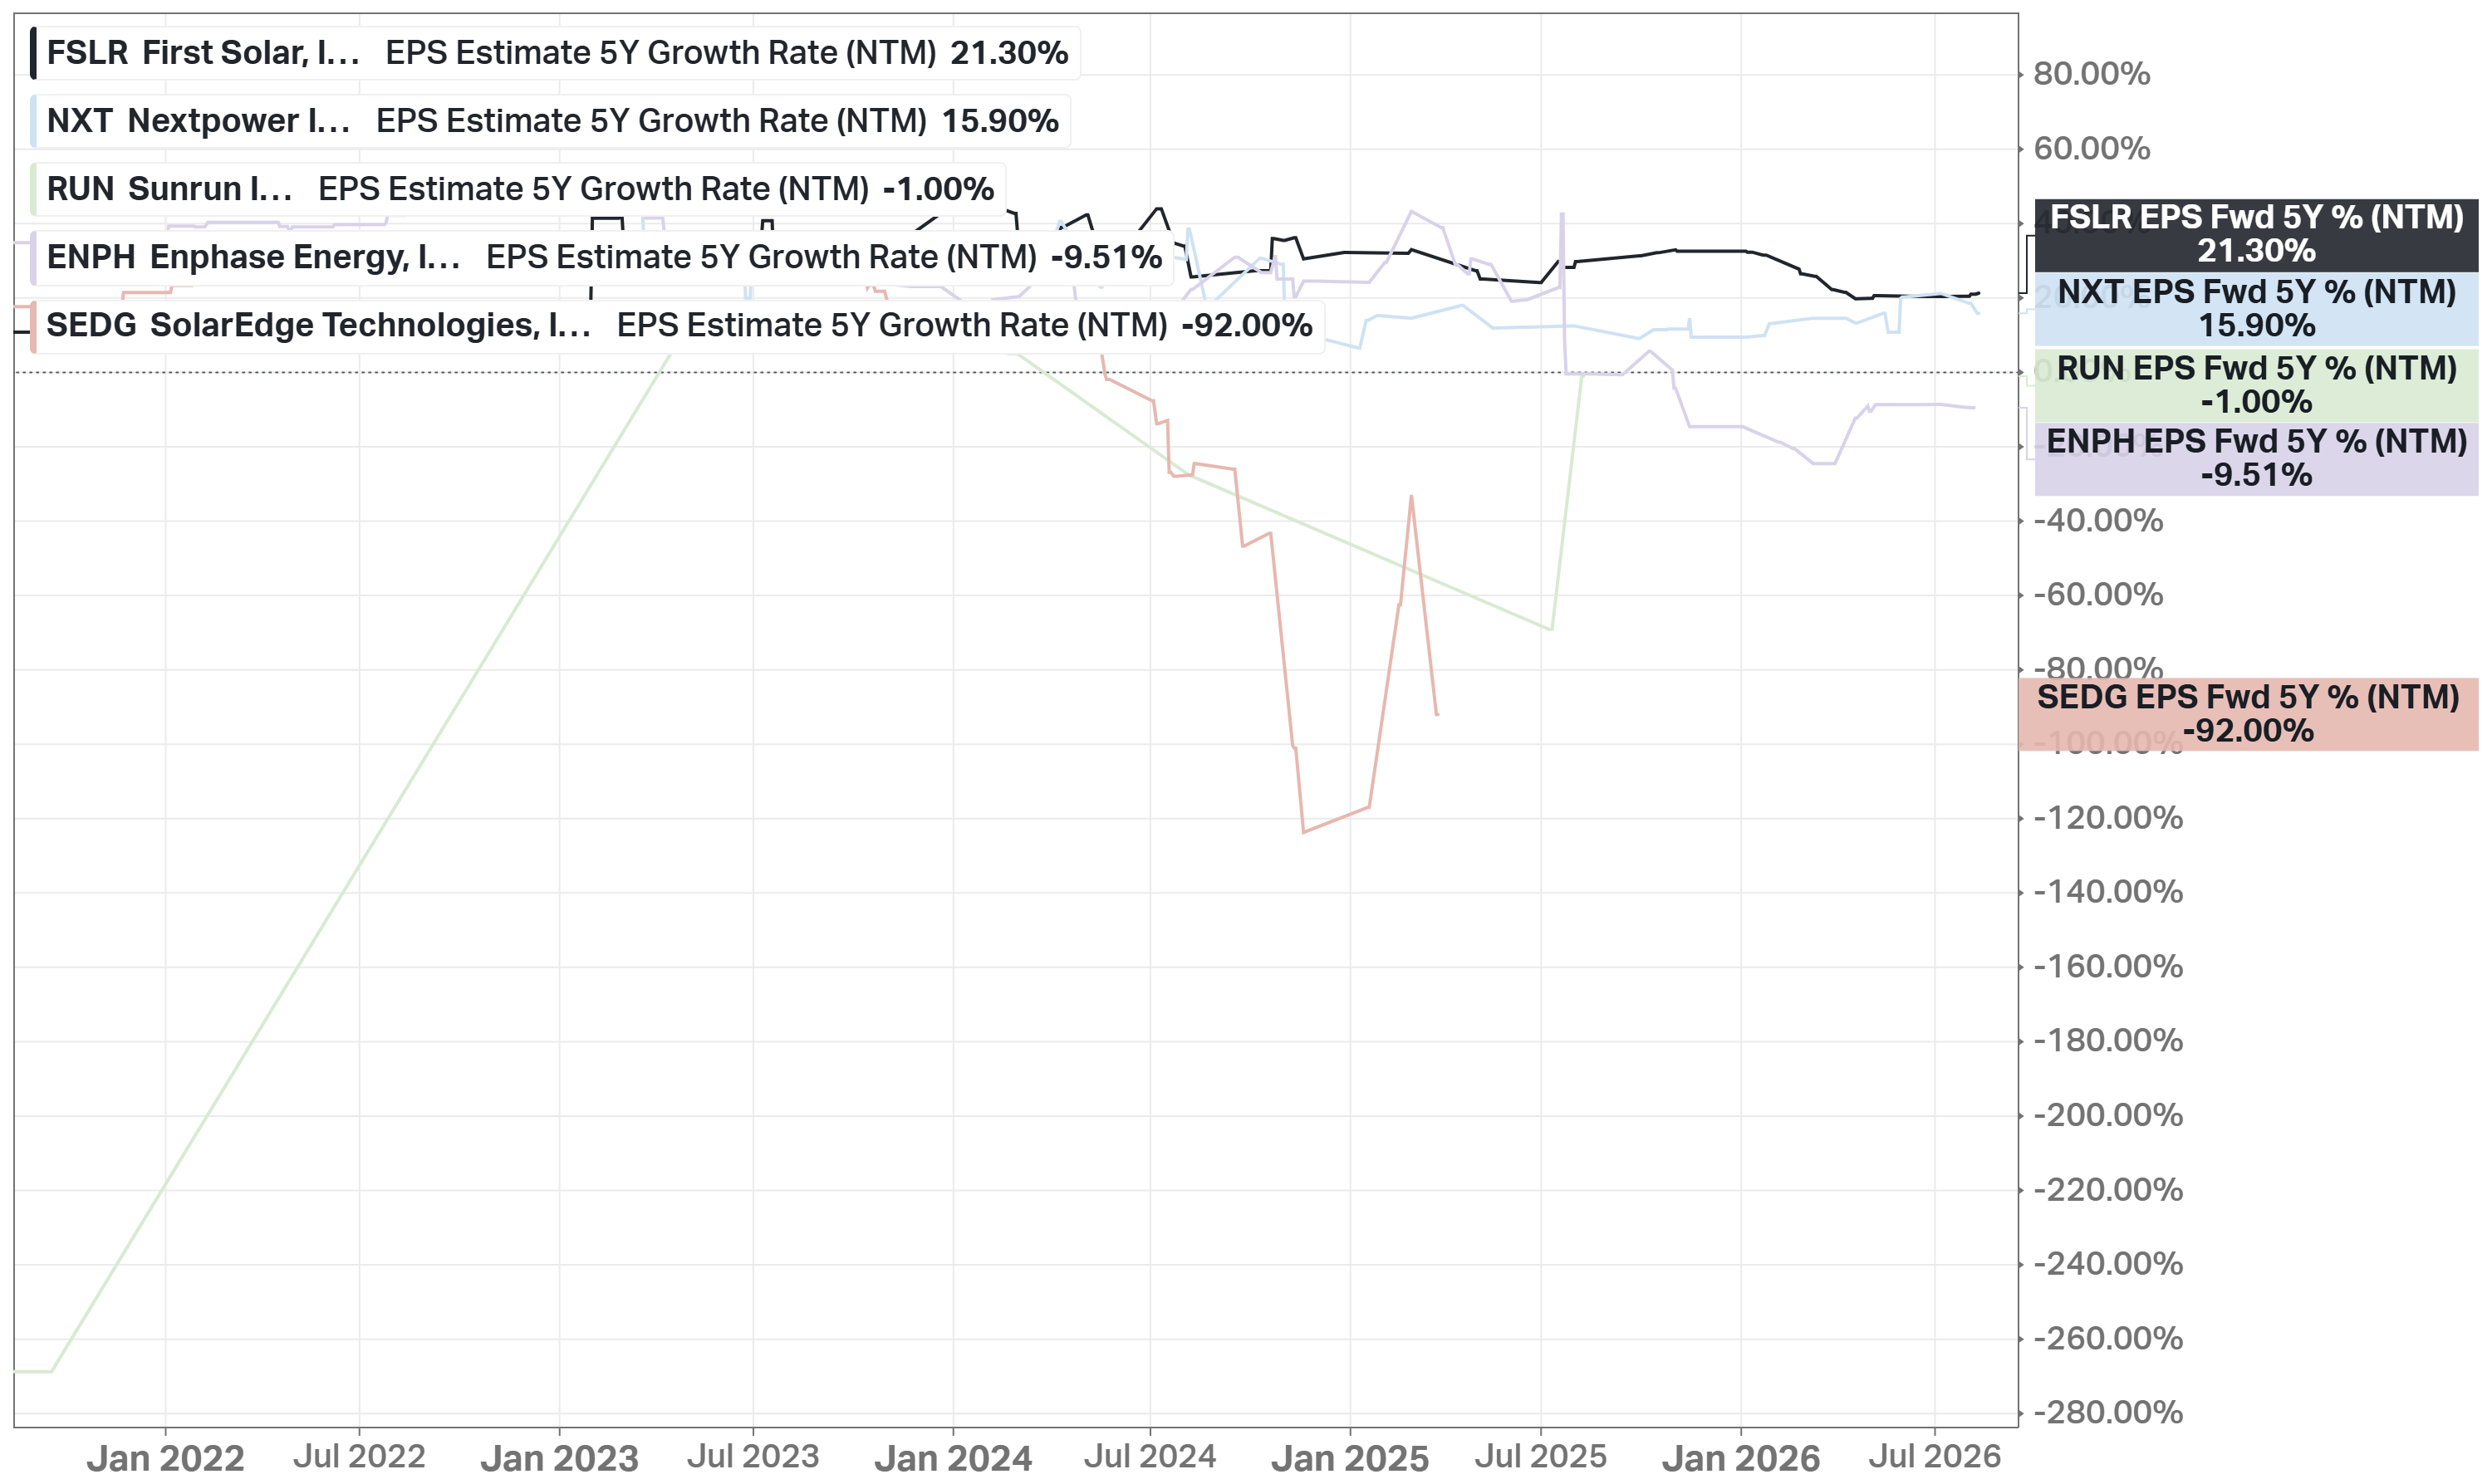
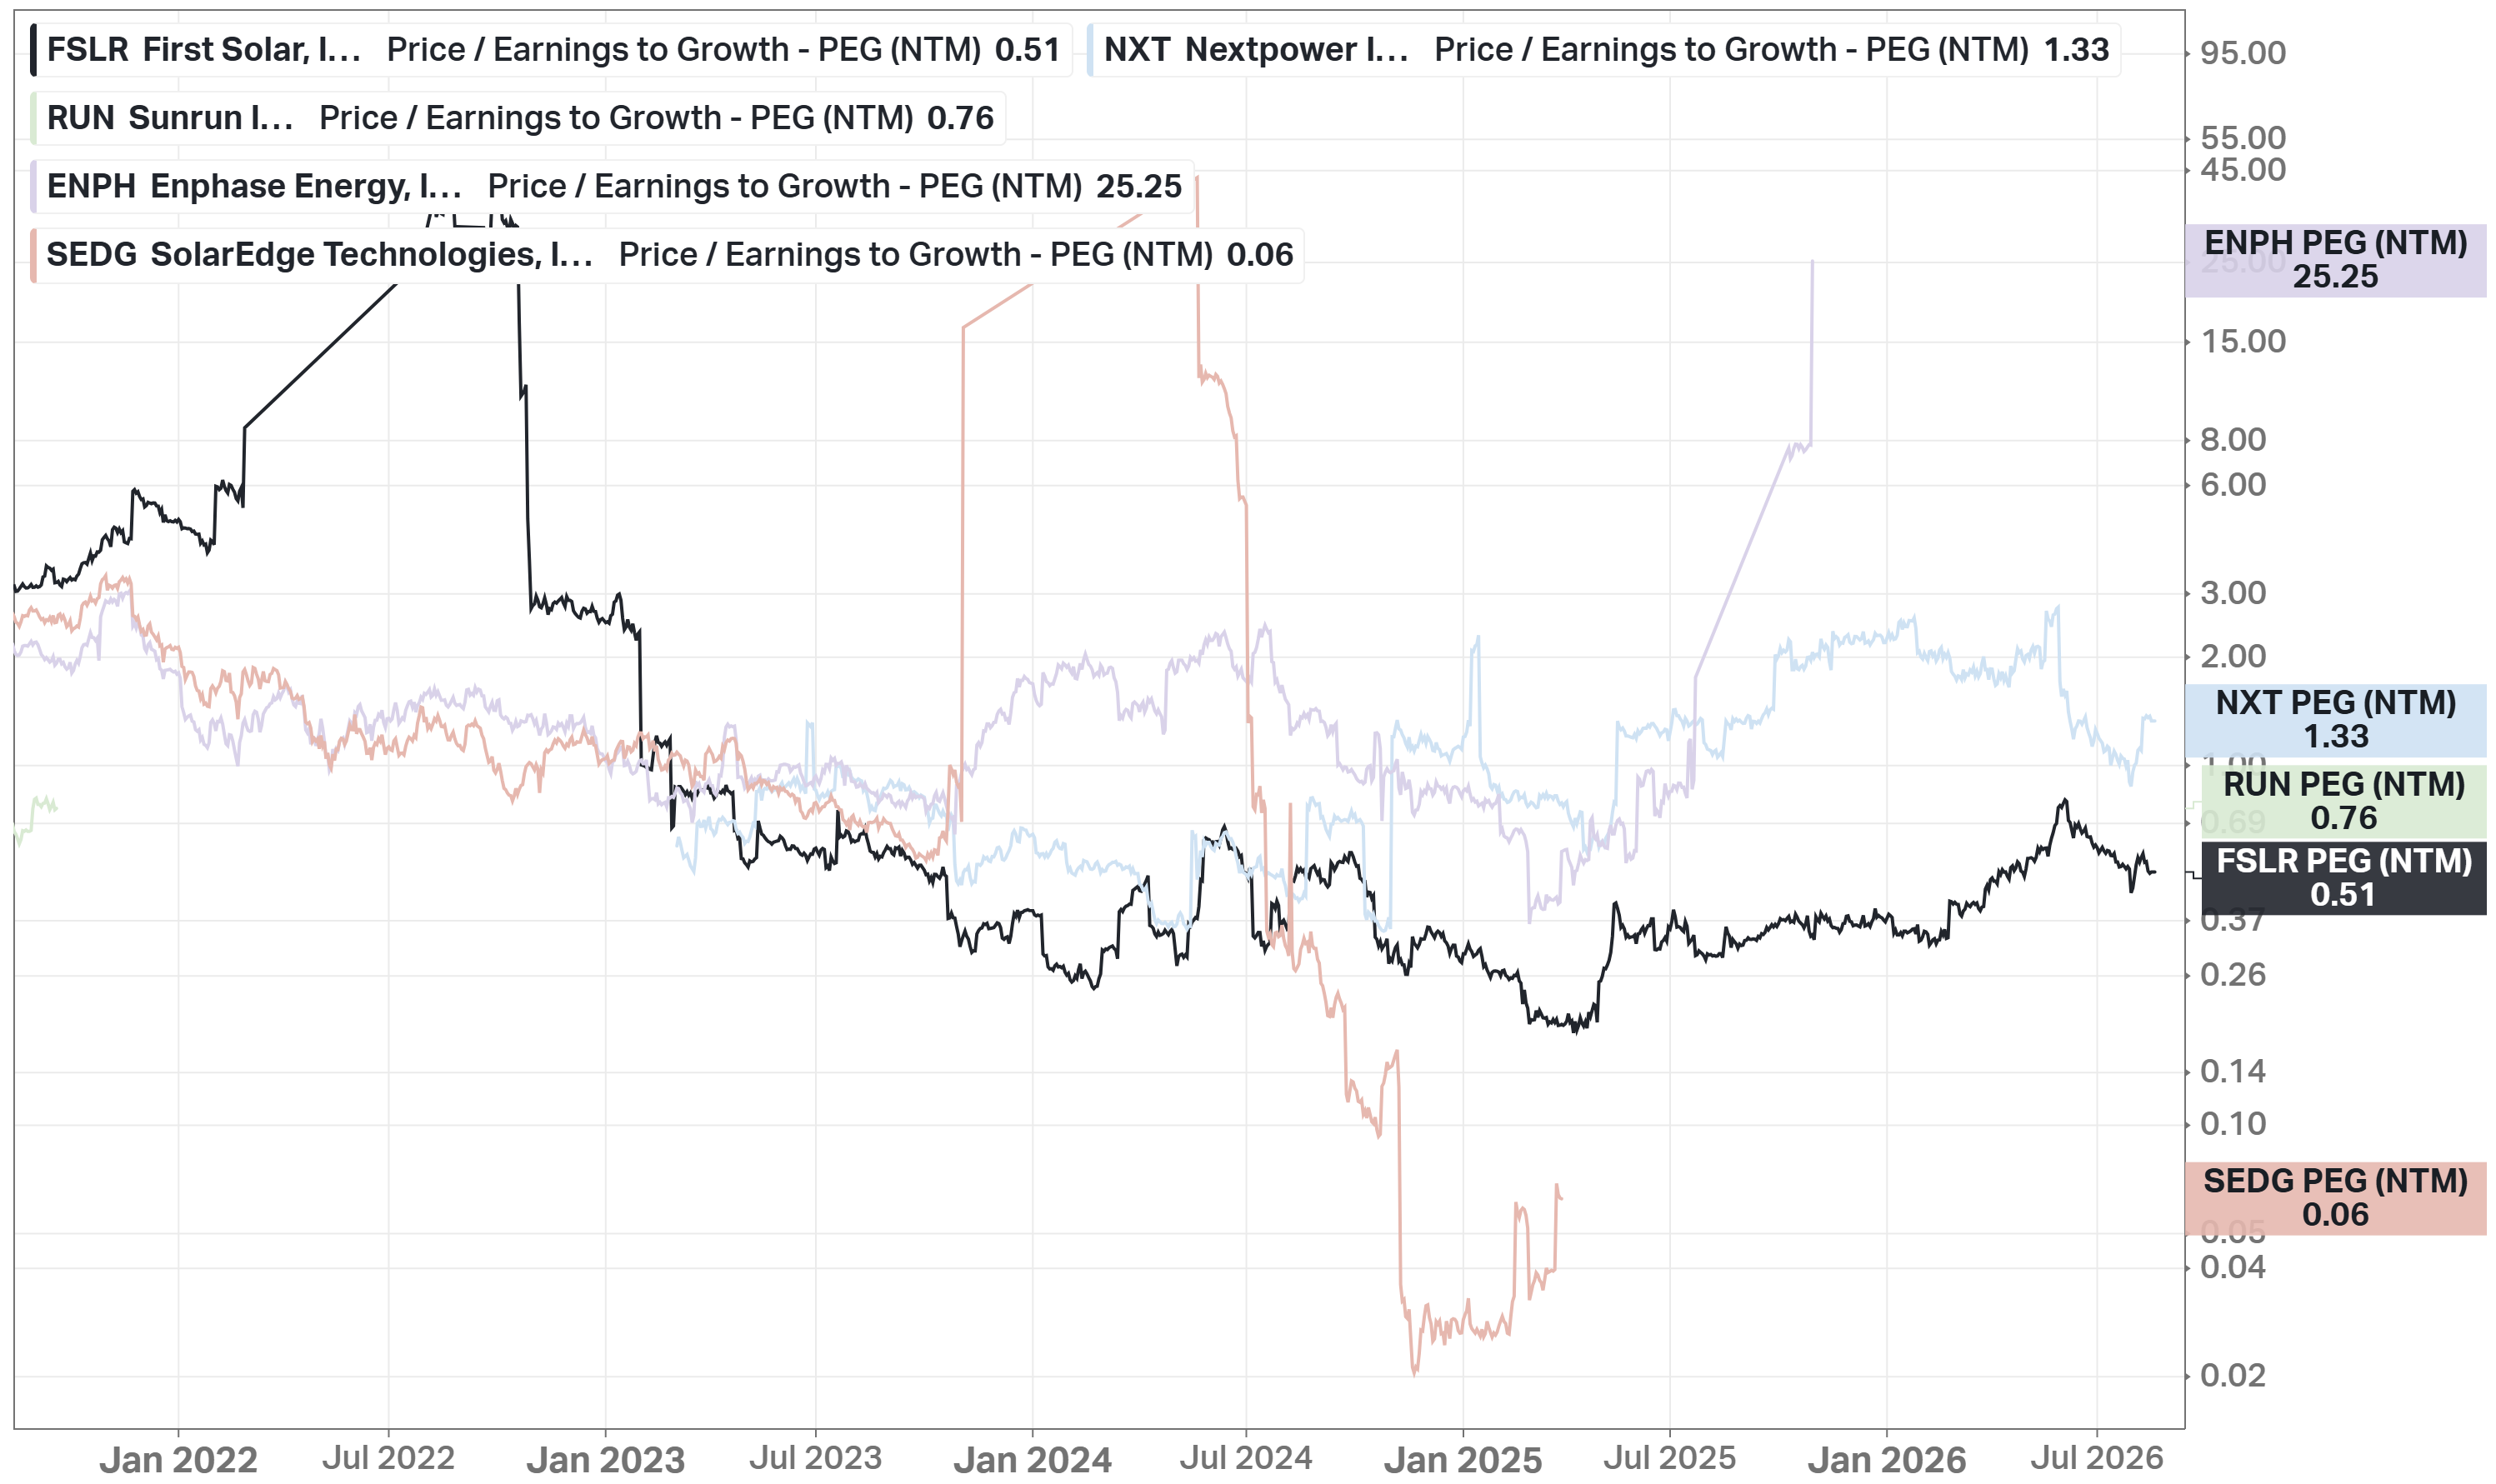
Consensus 5Y EPS growth tells the more interesting story: First Solar's 21.3% is the highest in the group. Nextpower is next at 15.9%, and then the numbers turn negative: Sunrun's is roughly flat at -1.0%, Enphase's is -9.5%, and SolarEdge's is -92%. As a result, FSLR's PEG of 0.51 is the cheapest growth-adjusted multiple among the names still actually growing; Sunrun is at 0.76 and Nextpower at 1.33. Enphase and SolarEdge's PEG numbers are not meaningful here, since a PEG built on shrinking or near-zero forward earnings does not measure the same thing.
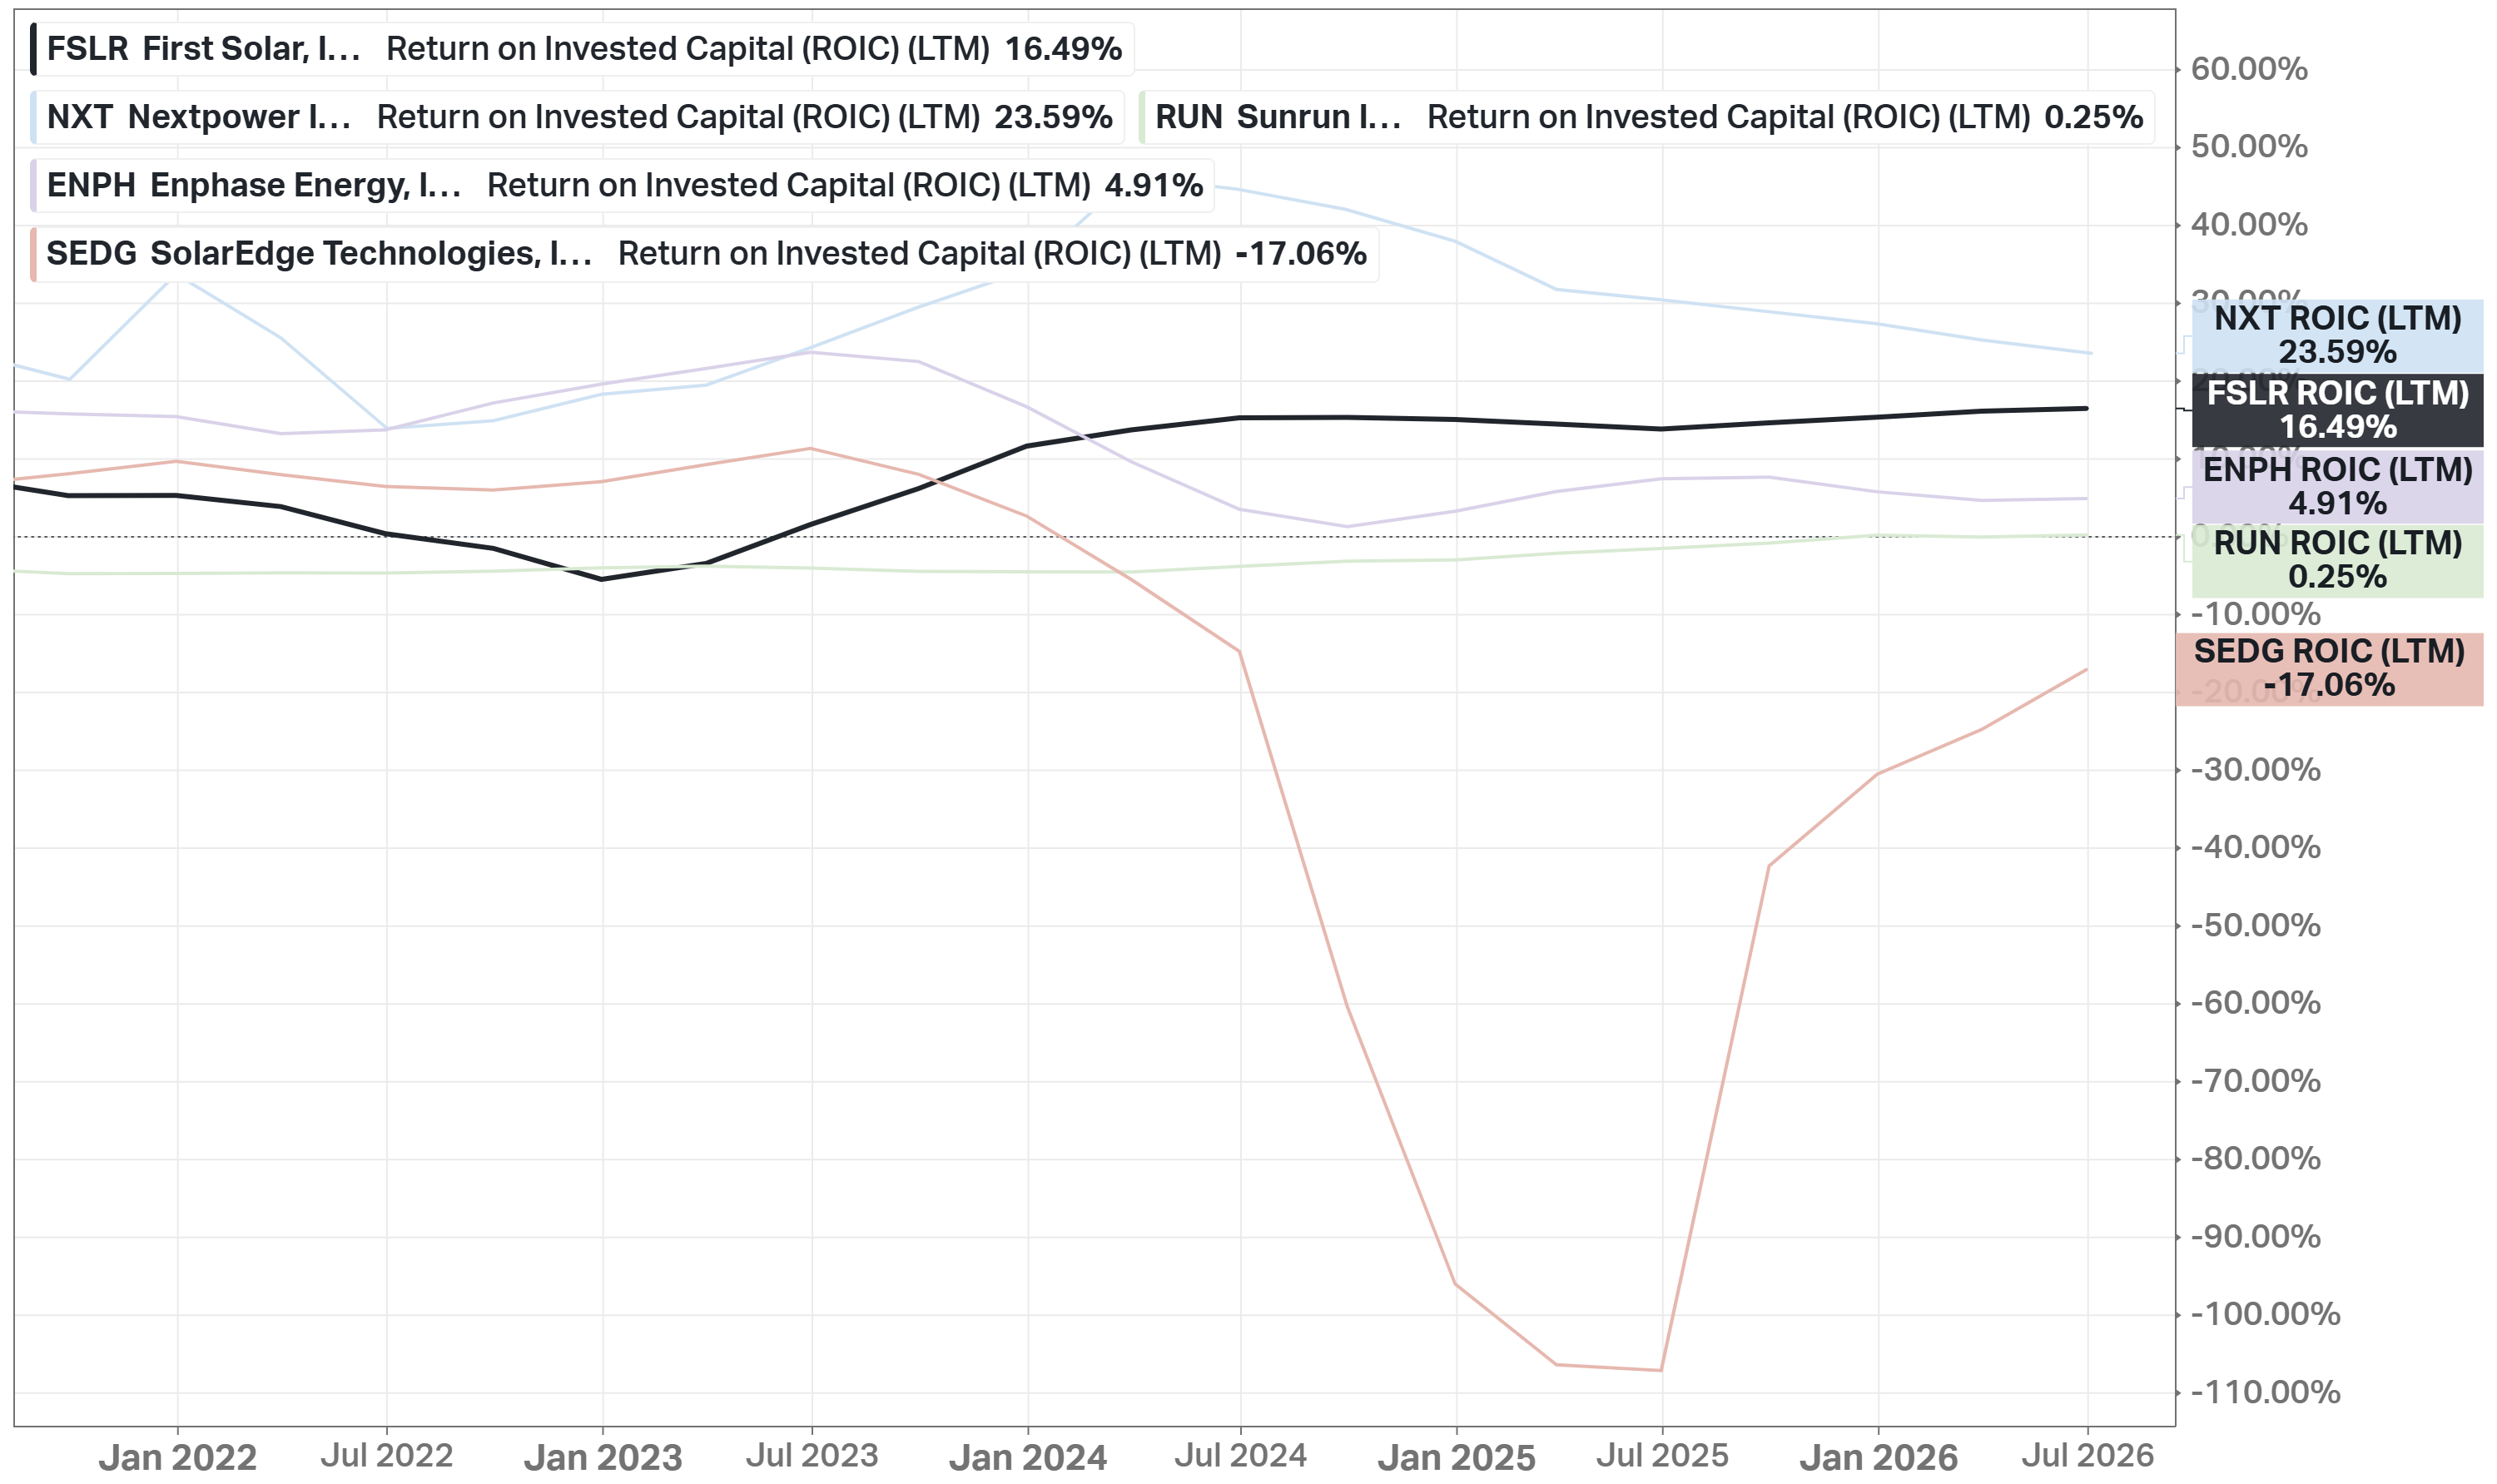
On returns on capital, Nextpower actually leads the group at a 23.6% ROIC, though that is down sharply from above 50% in 2022 as its base of invested capital has grown. First Solar is next at 16.5% and rising; Enphase is at 4.9%, Sunrun is close to breakeven at 0.3%, and SolarEdge is destroying capital at -17.1%, still recovering from its drawdown.
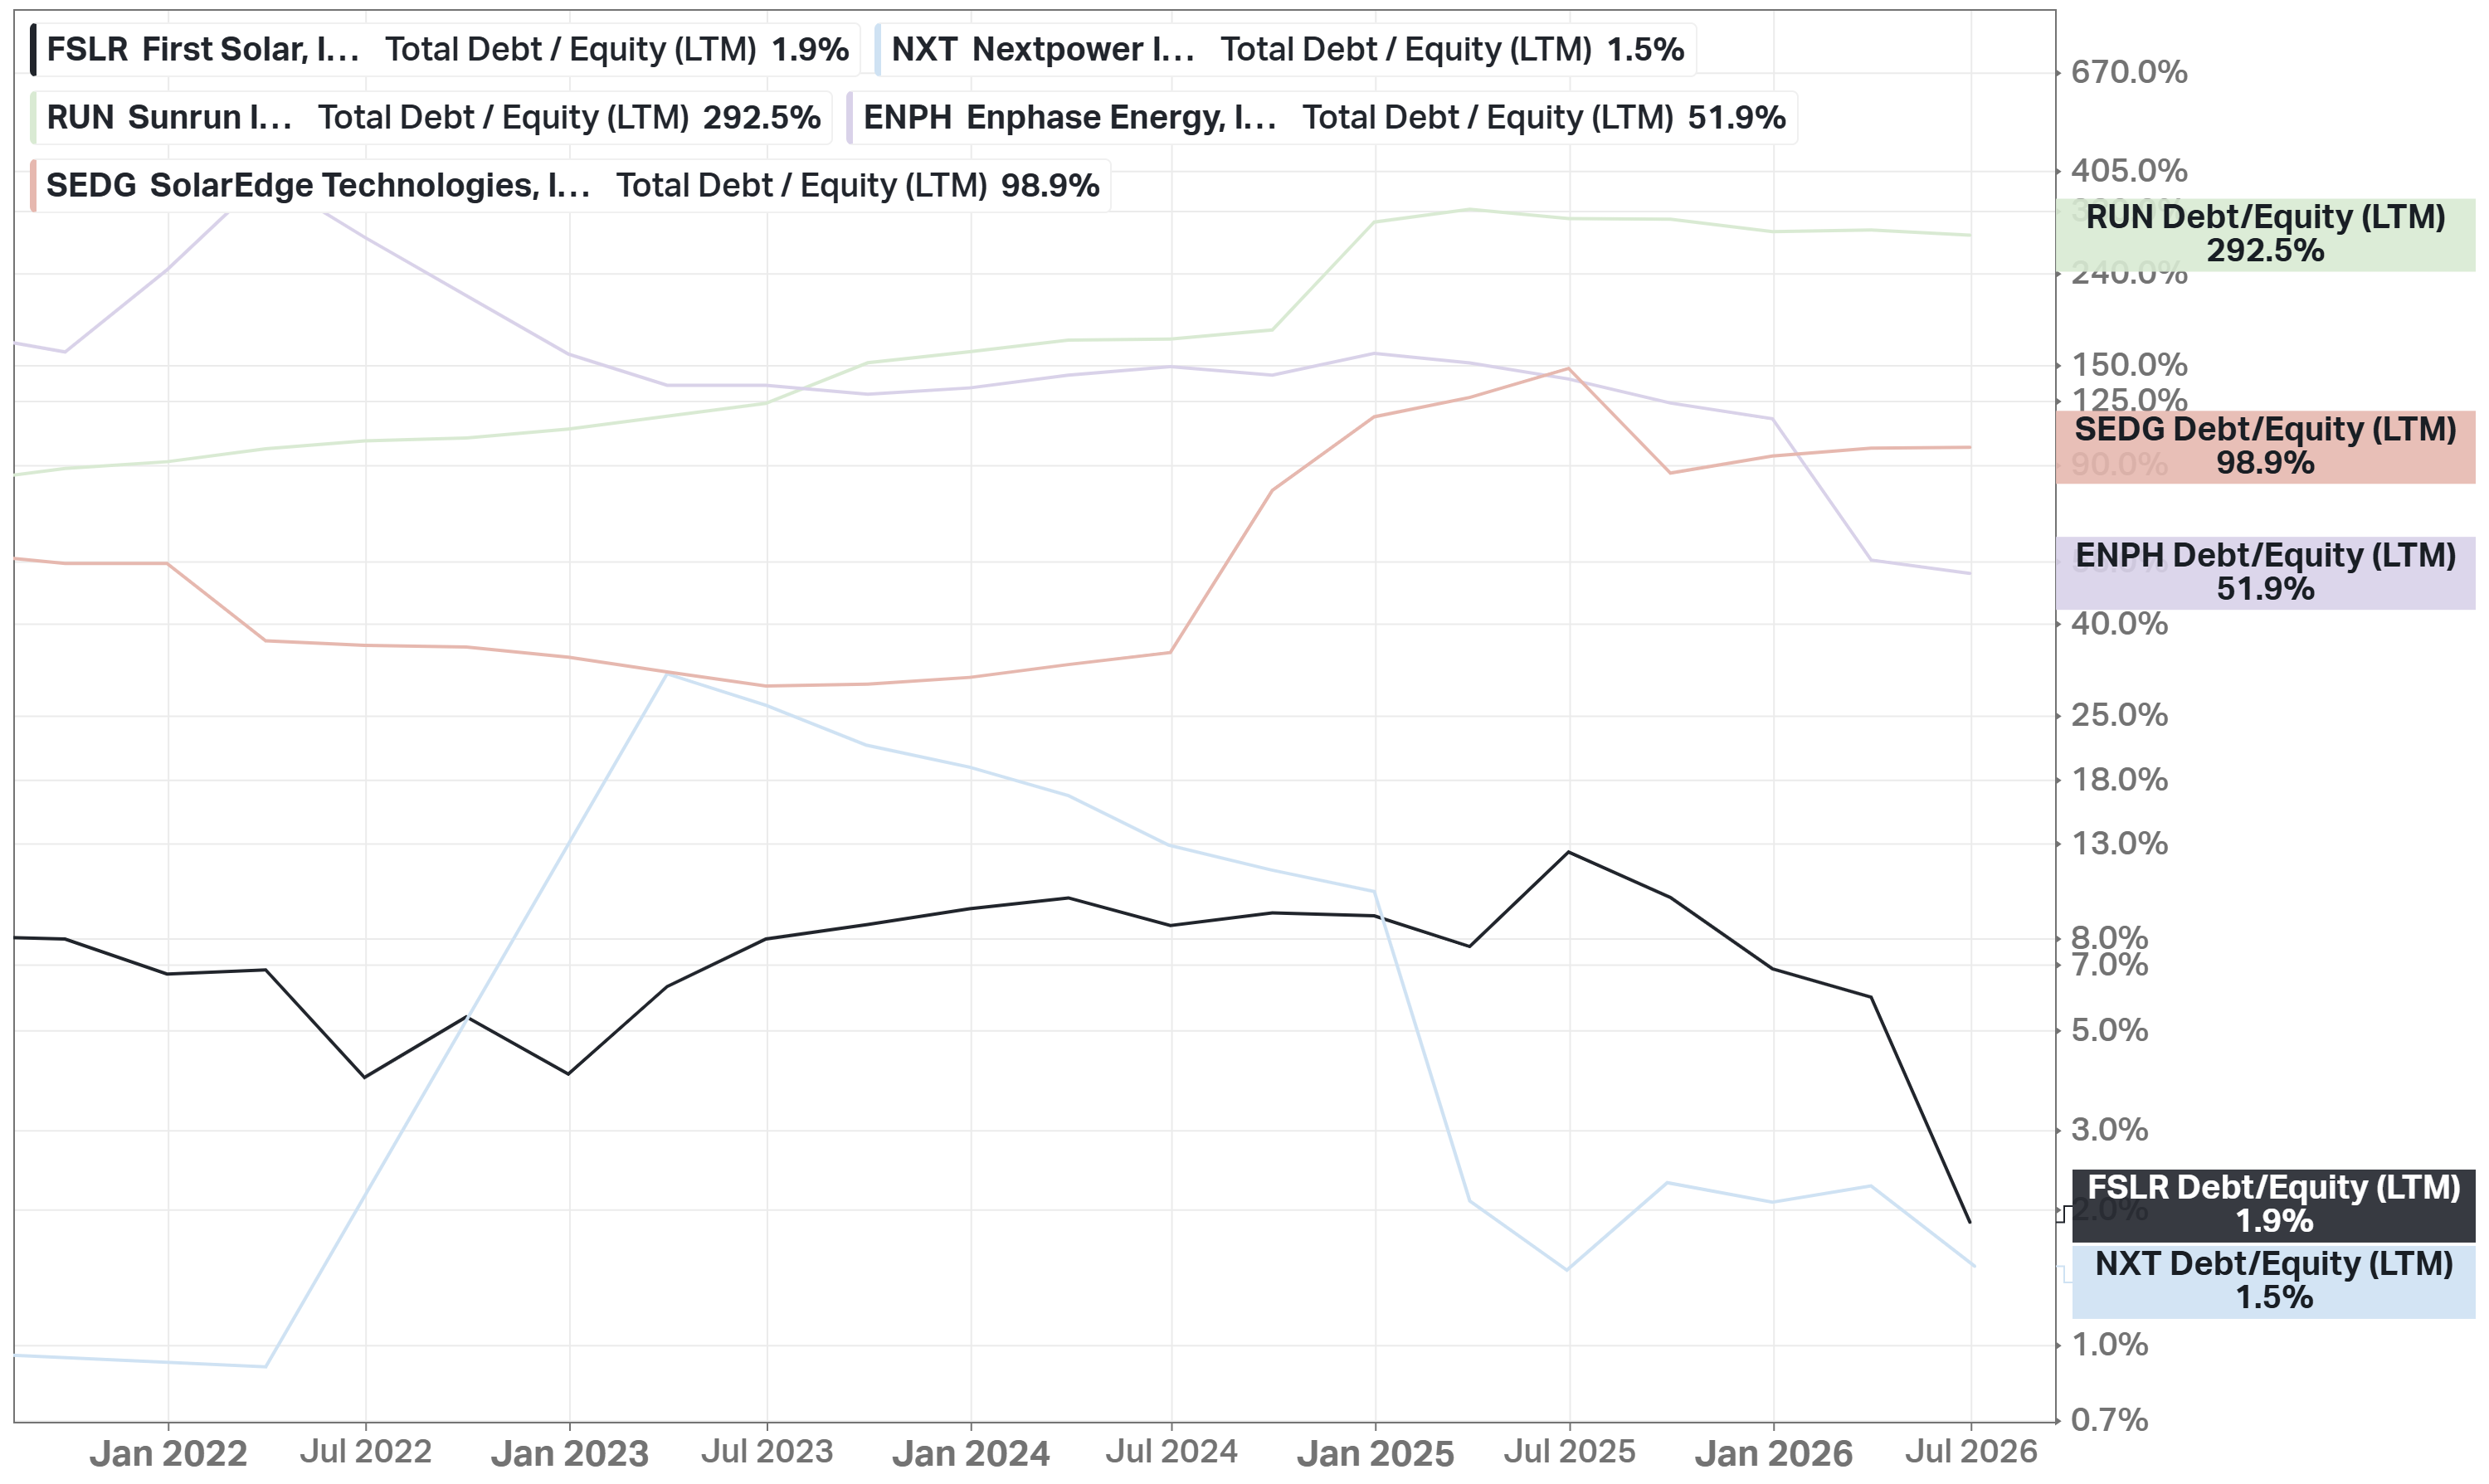
First Solar's Debt/Equity is 1.9%, and Nextpower's is 1.5% (both essentially unlevered) against 51.9% for Enphase, 98.9% for SolarEdge, and 292.5% for Sunrun.
On margins, First Solar also leads: 44.0% gross margin and 32.5% net margin, both the highest of the 5.
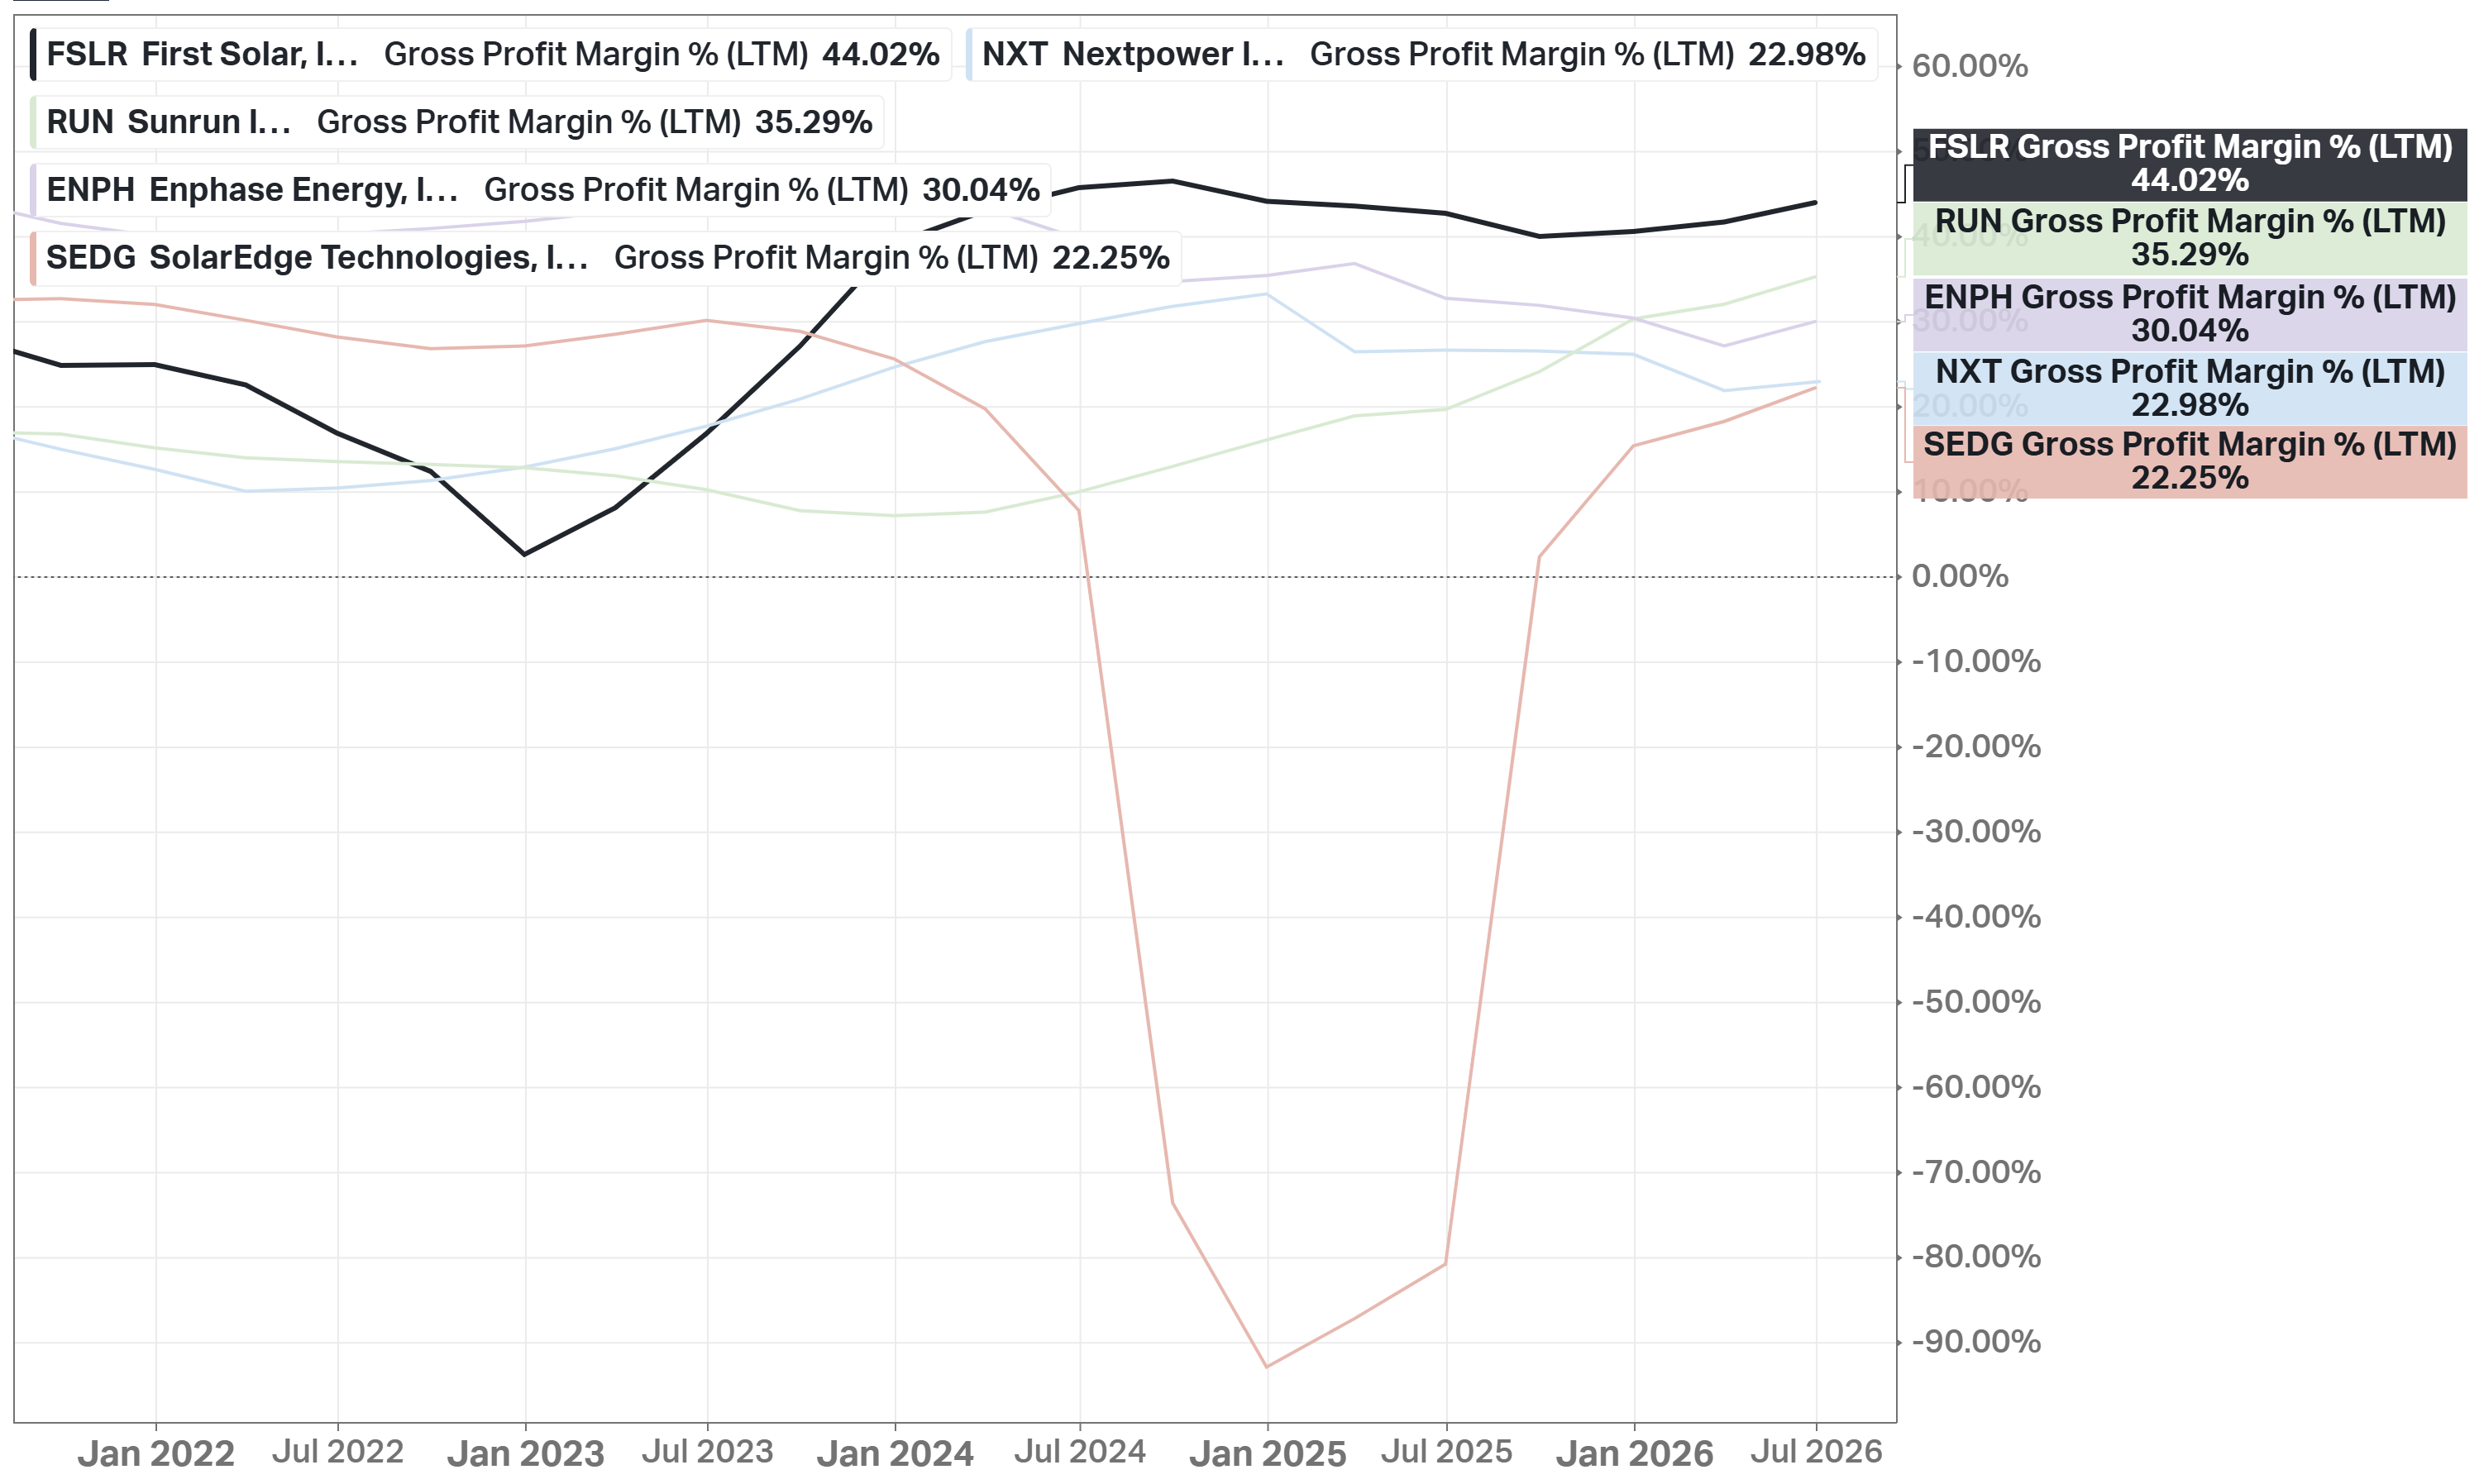
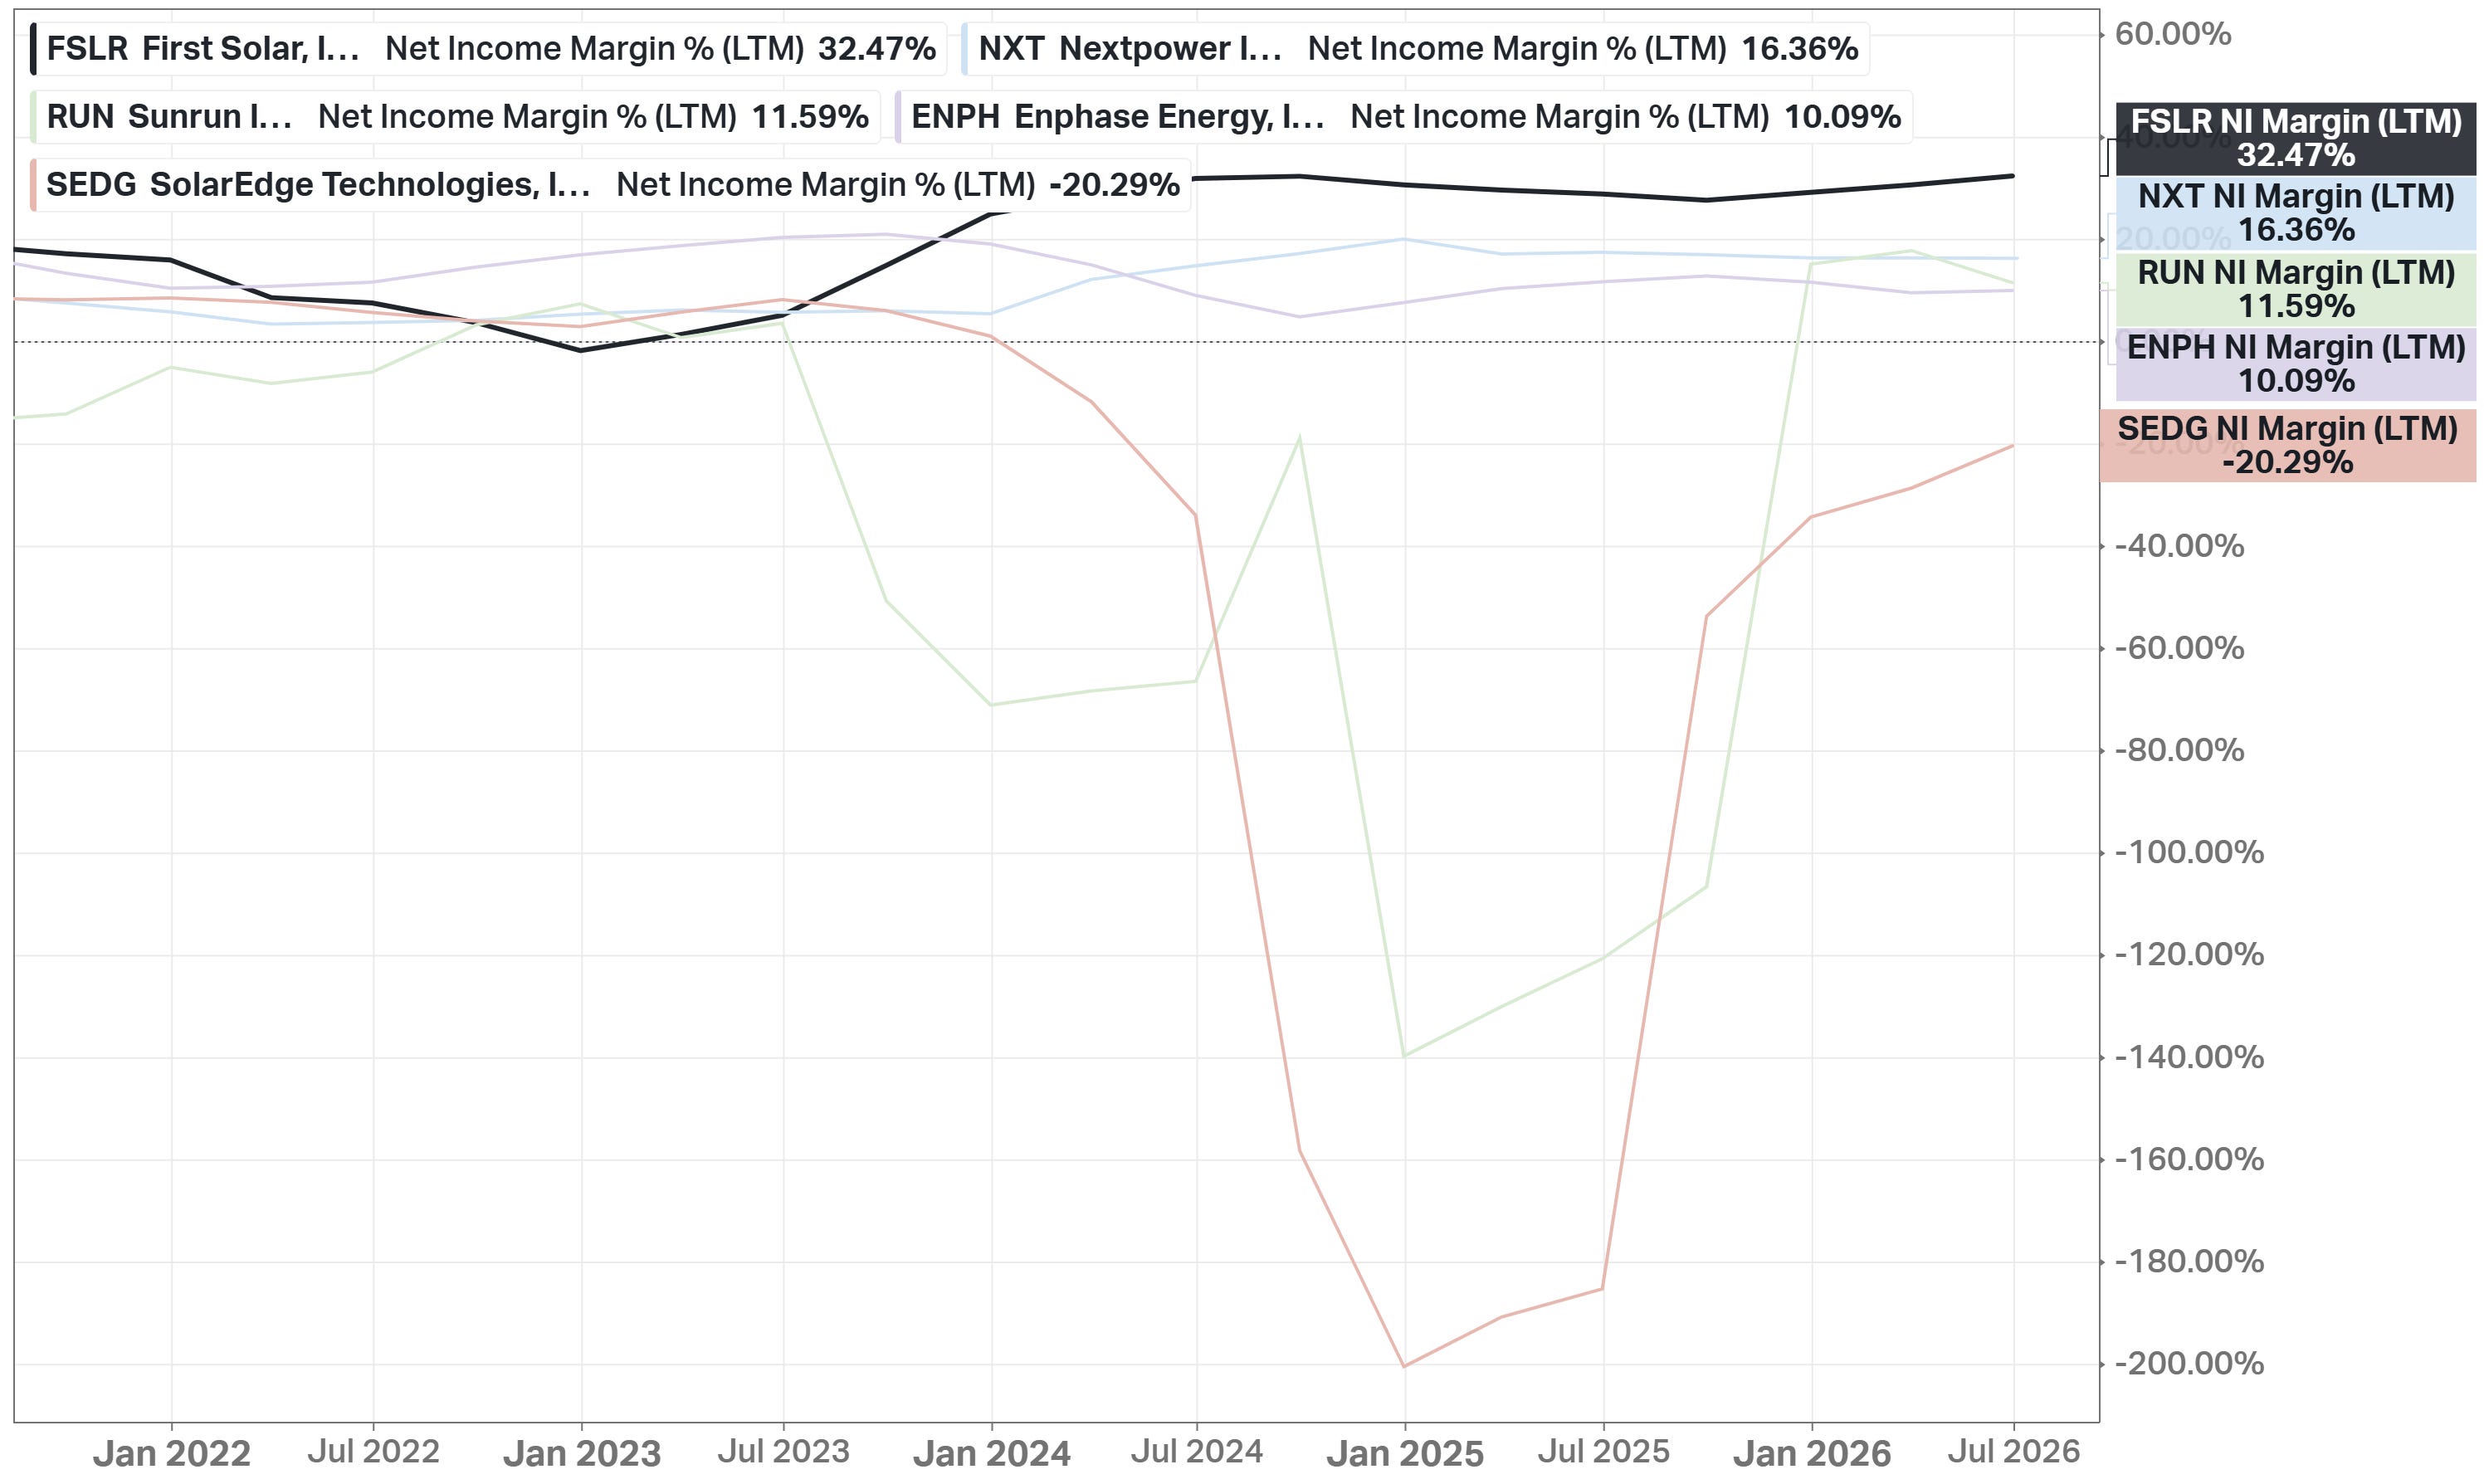
In my view, First Solar is not the best business in this group by ROIC alone - Nextpower's returns are still better. But it is the only one that combines real growth, the highest margins, and a sub-1 PEG all at once.

Past
Q2 2026 (ended June 30, all USD, YoY):
Net sales $1.06B, down 3.7% (missed consensus by 0.4%)
EPS $3.92, beat consensus by 43.1%, up 23.3% from $3.18
Gross profit $605M, up 21% from $499.9M; gross margin expanded about 12 points to 57% for the quarter
Adjusted EBITDA $644M, up 15%, with margin expanding 990 basis points to 60.9%
Cash and equivalents $1.69B, down from $2.80B at year-end 2025; no long-term debt, versus $282.6M at year-end 2025
Contracted backlog: 45.1 gigawatts worth $13.6B through 2030, with 1.9 gigawatts of new US bookings during the quarter at $0.36 per watt
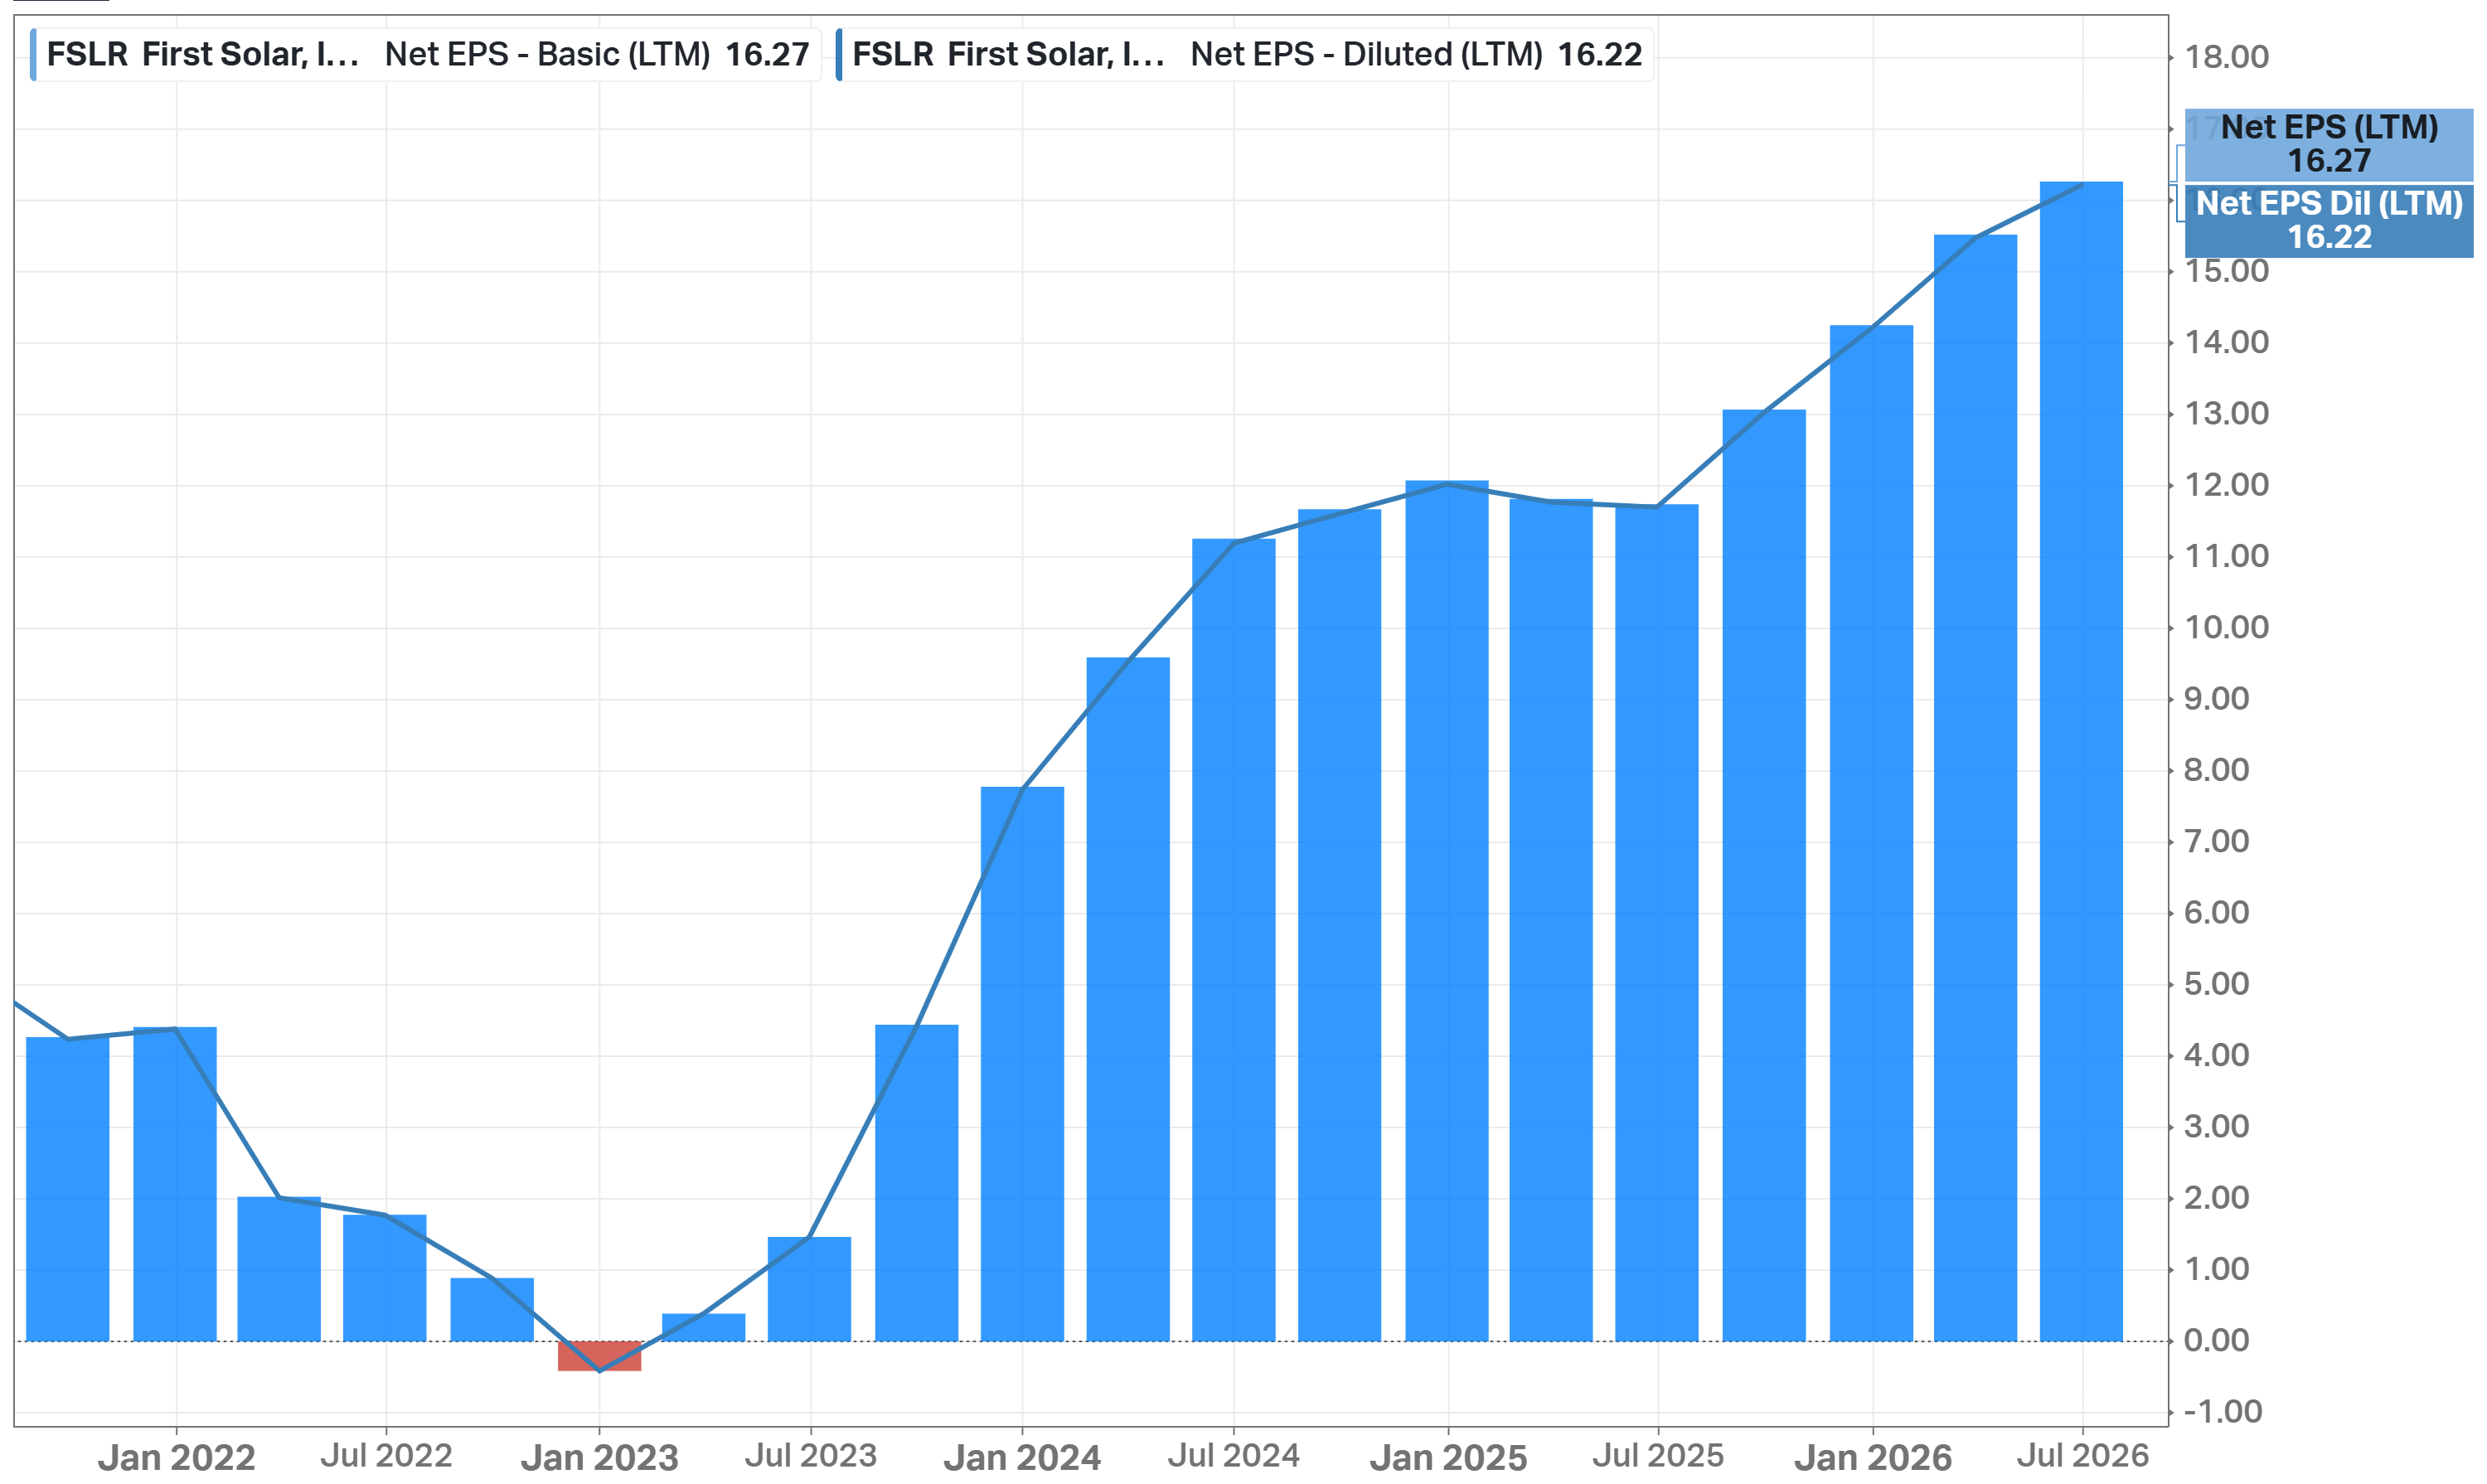
Why is the stock still down 14% YTD, after a quarter like this? I see three reasons, in order of importance:
The 2026 top line is flat to down. Guidance of $4.9-5.2B implies a roughly flat-to-negative year after the Southeast Asia capacity pullback, and Q2 sales themselves missed consensus and fell 3.7% YoY.
The policy overhang never really lifted. A $60-80M net tariff impact, a pending Section 232 investigation, and a 2026 guidance built on $2.10-2.19B of Section 45X credits keep the stock trading on Washington news as much as on its own numbers.
Cash on the balance sheet fell sharply on paper. $1.69B at the end of Q2, down from $2.80B at year-end 2025, even though this mostly reflects the normal seasonal timing of credit monetization and capacity spending rather than a change in the business.
Worth noting also what a headline-only read misses: gross margin expanded 12 points, and adjusted EBITDA grew 15% despite the sales miss, and the backlog still runs through 2030. A business shedding revenue for structural reasons does not usually see margin expand like this.
The longer history matters more. LTM revenue reached $5.38B, net income $1.75B, and FCF $1.50B. Every margin is above its 5Y mean: gross margin 44.0% against 31.4%, net margin 32.5% against 20.1%, and FCF margin 27.9% against a negative 6.1% mean - the company was still burning cash on a trailing basis as recently as 2023 and 2024.
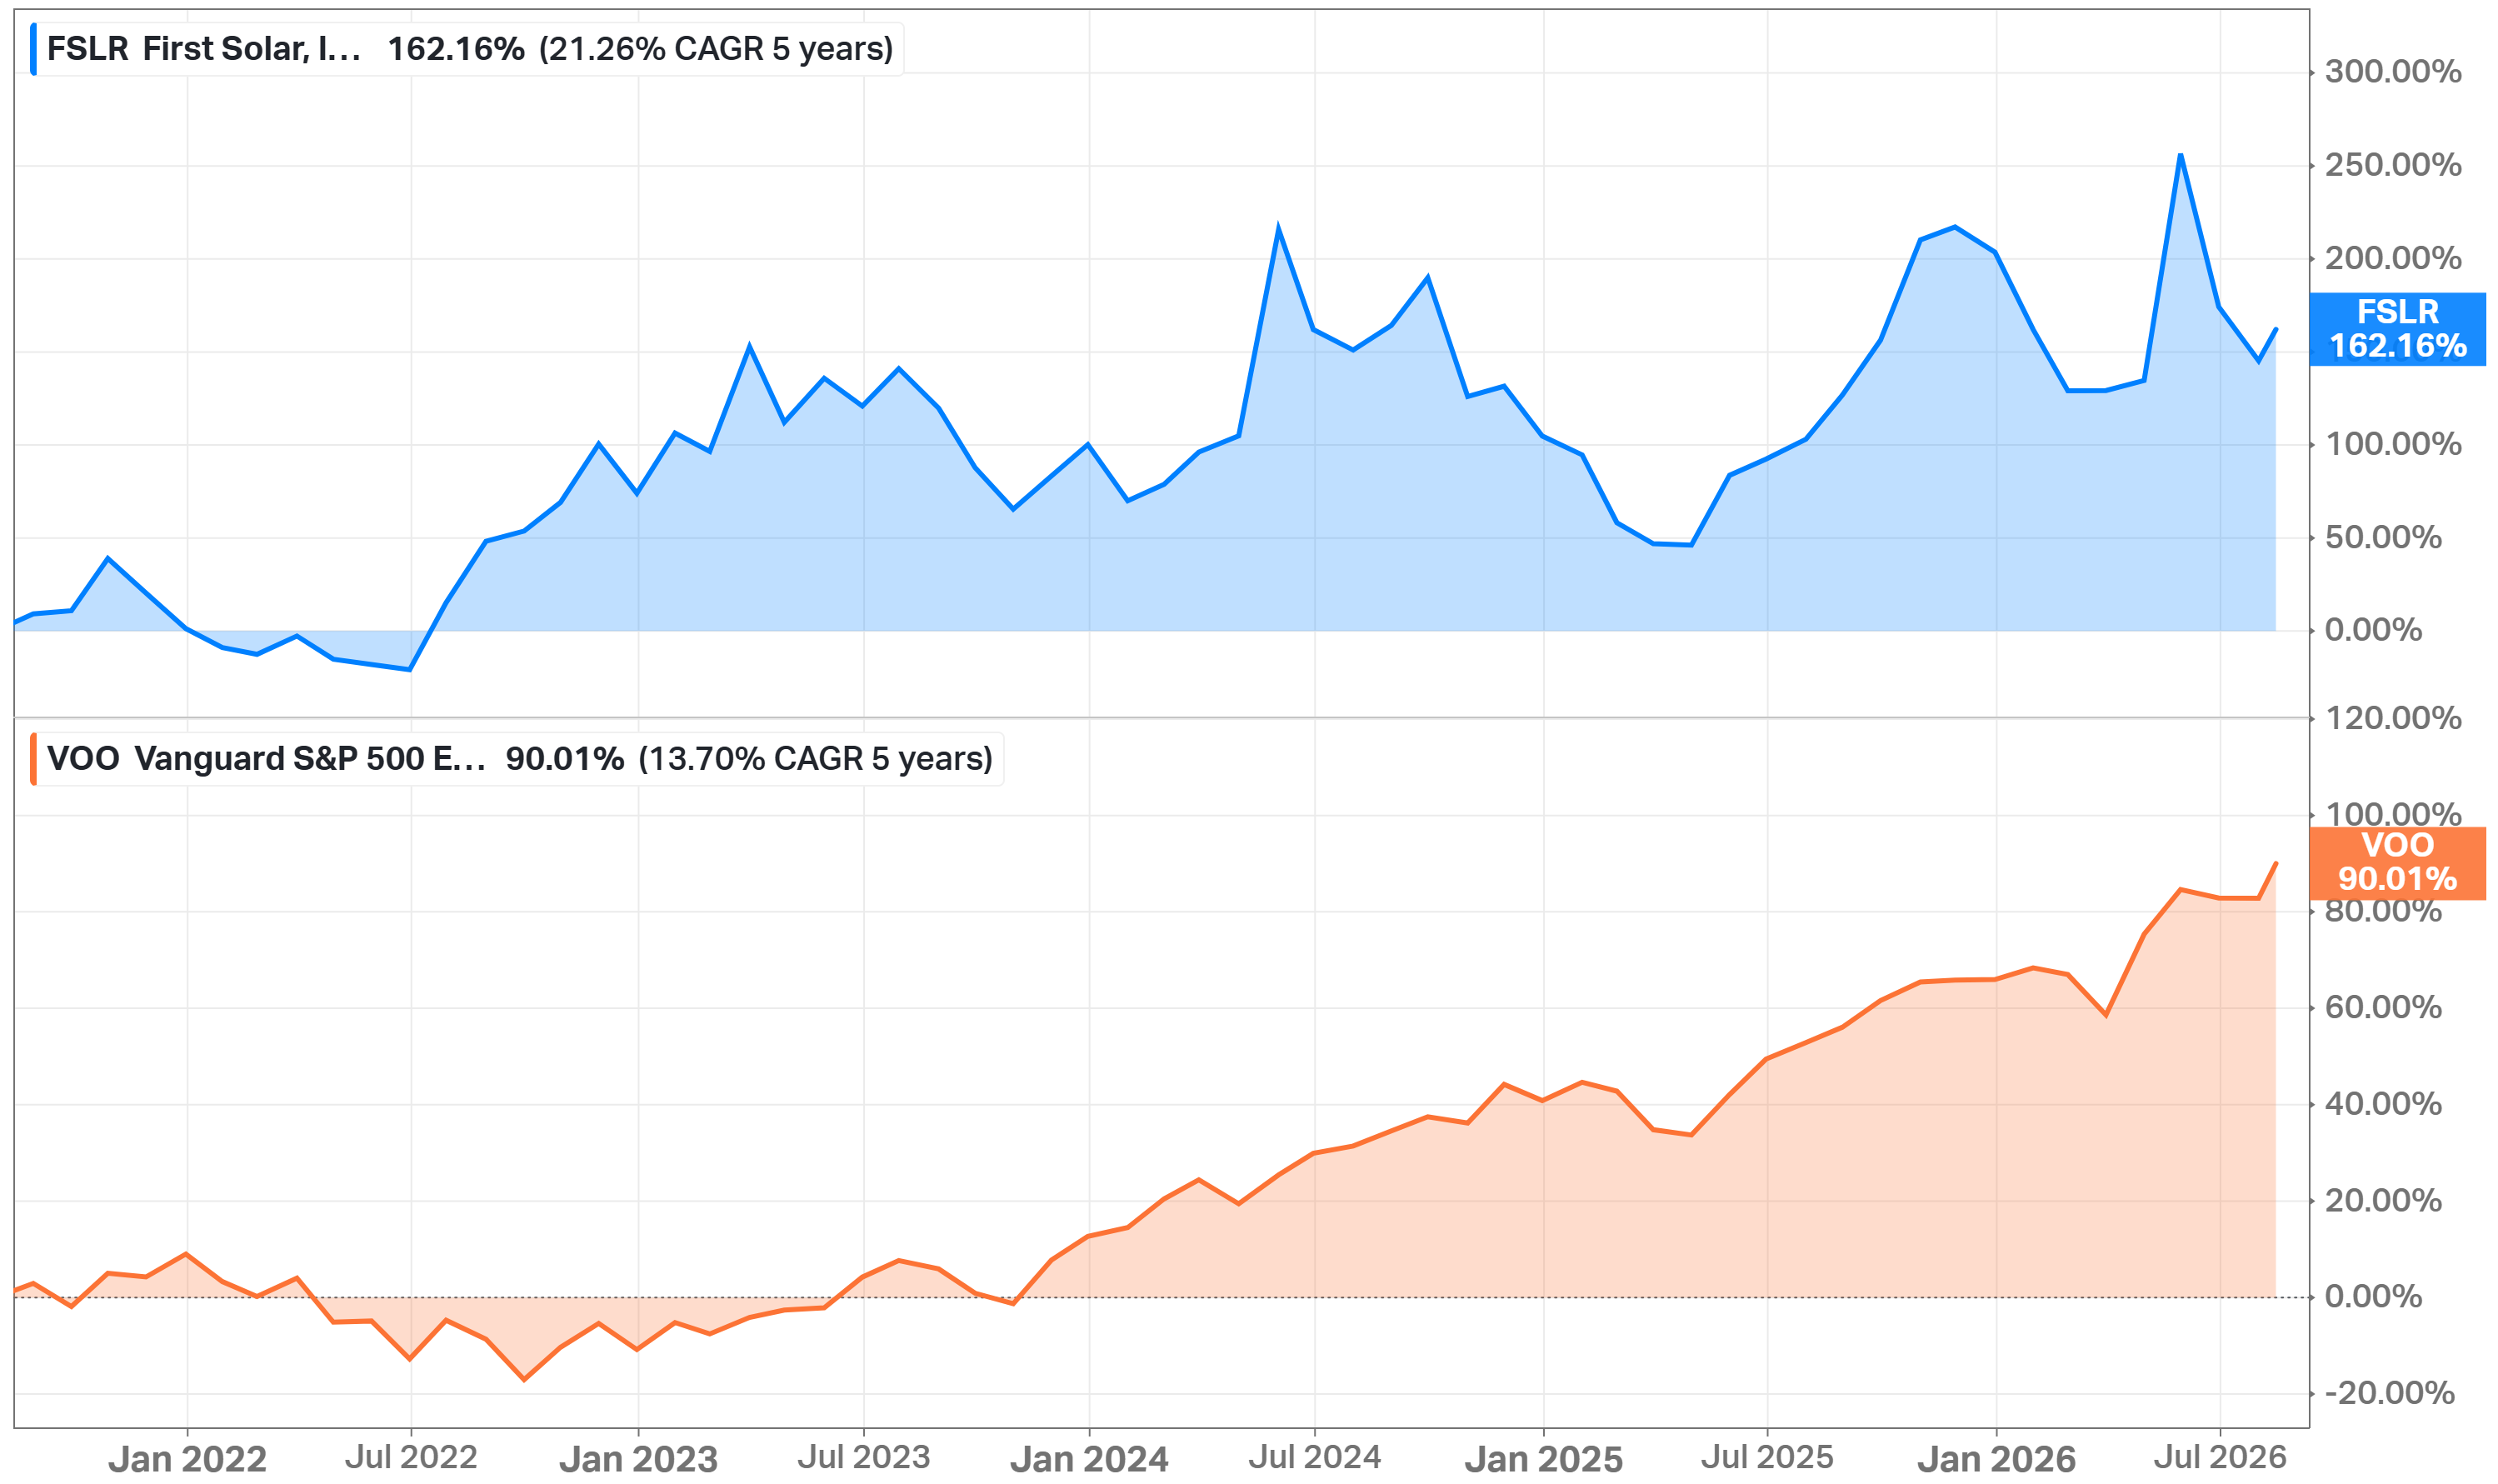
Total return of 162.16% over 5 years (21.26% per year) against 90.01% for VOO (13.70% per year); and the gap holds over 10 years too, at 16.97% per year against 15.42%. FSLR has already beaten the market by a wide margin, and at 10.8x forward earnings, it does not look like a stock that needs to keep doing that to still be attractively priced.
Future

Consensus revenue: FY2026 $5.05B (-3.31%), FY2027 $5.91B (+17.07%), FY2028 $6.53B (+10.49%) - the flat year is 2026 only
Consensus EPS: $17.60 -> $23.09 -> $29.19 (FY2026 - FY2028)
5Y forward EPS growth estimate: 21.30%, almost exactly in line with its own 20.41% mean - the growth outlook itself has held steady while the multiple compressed
Analysts: Buy (9 Strong Buy / 15 Buy / 10 Hold / 1 Sell / 1 Strong Sell, 36 covering), average target $270.97, +20.13% from here (the range is $150.00 to $402.00)
Company guidance: FY2026 sales of $4.9-5.2B, gross profit of $2.4-2.6B, module shipments of 17-18.2 gigawatts, and capital expenditure of $0.8-1B
Current Valuation
Current vs 5Y mean:
Price/Fwd Earnings: 10.8x vs 30.4x
Price/Fwd Sales: 4.4x vs 4.1x
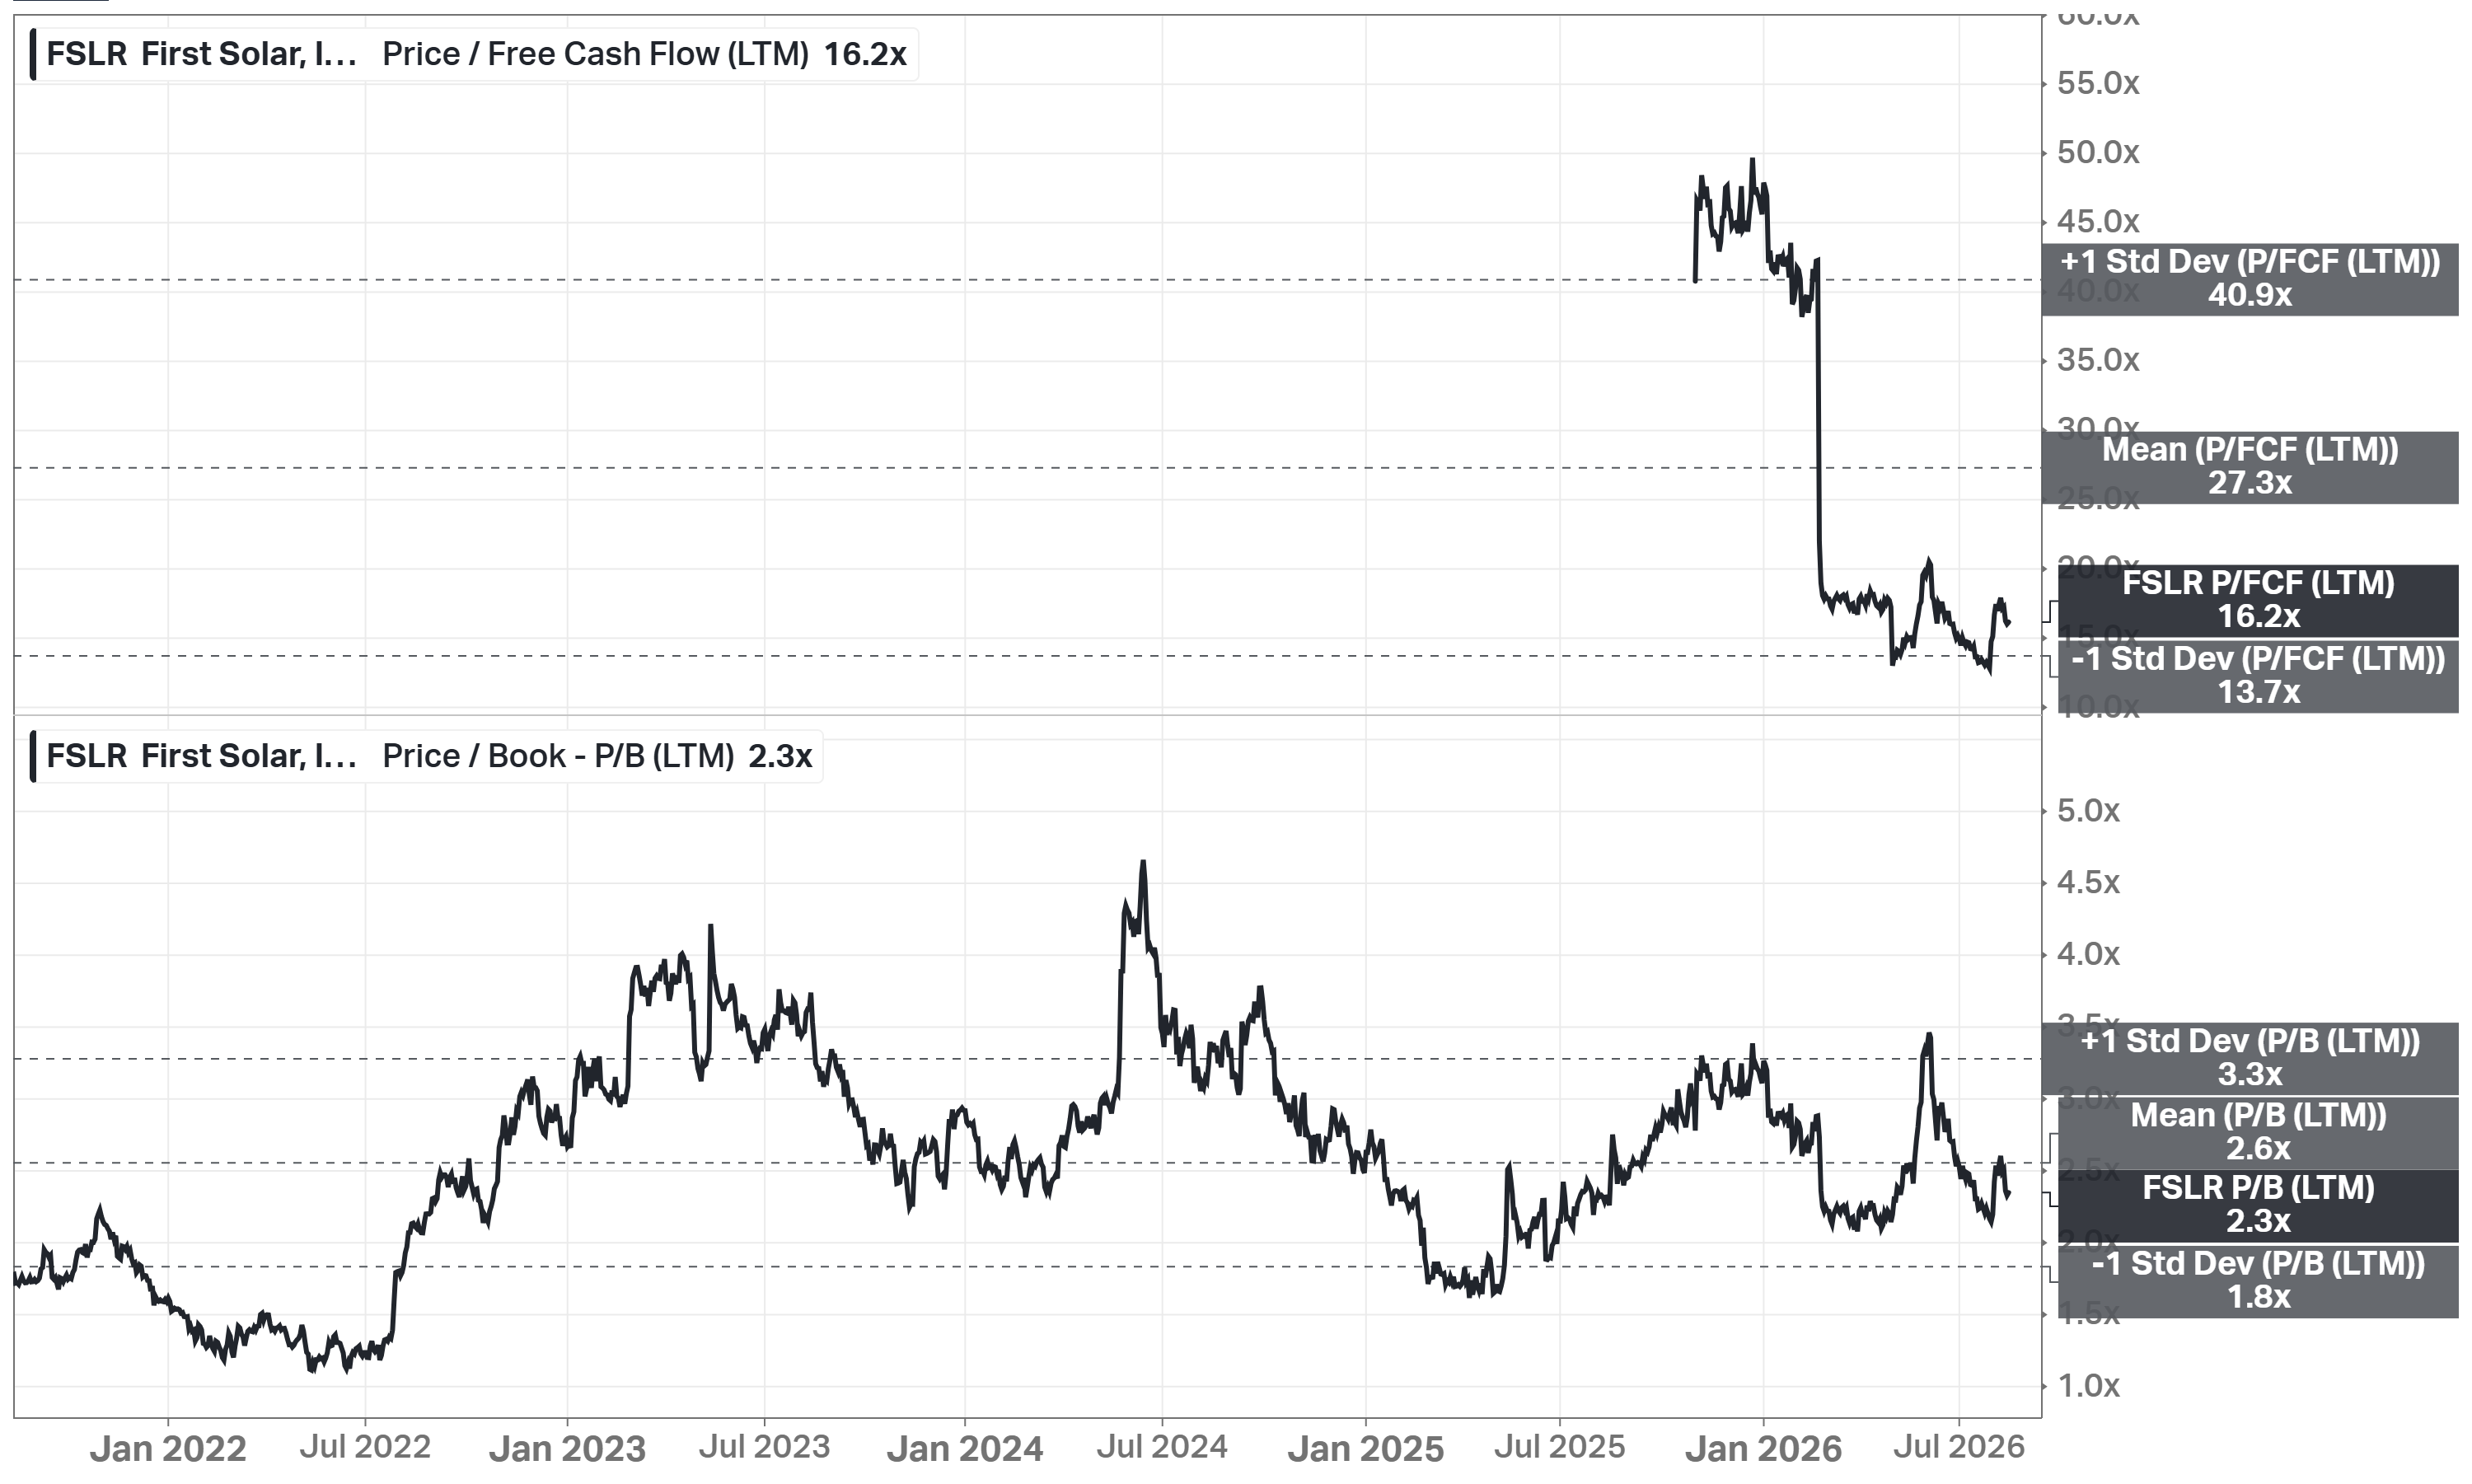
Price/FCF: 16.2x vs 27.3x
Price/Book: 2.3x vs 2.6x
PEG: 0.51 vs 2.23
Forward Earnings Yield: 9.3%
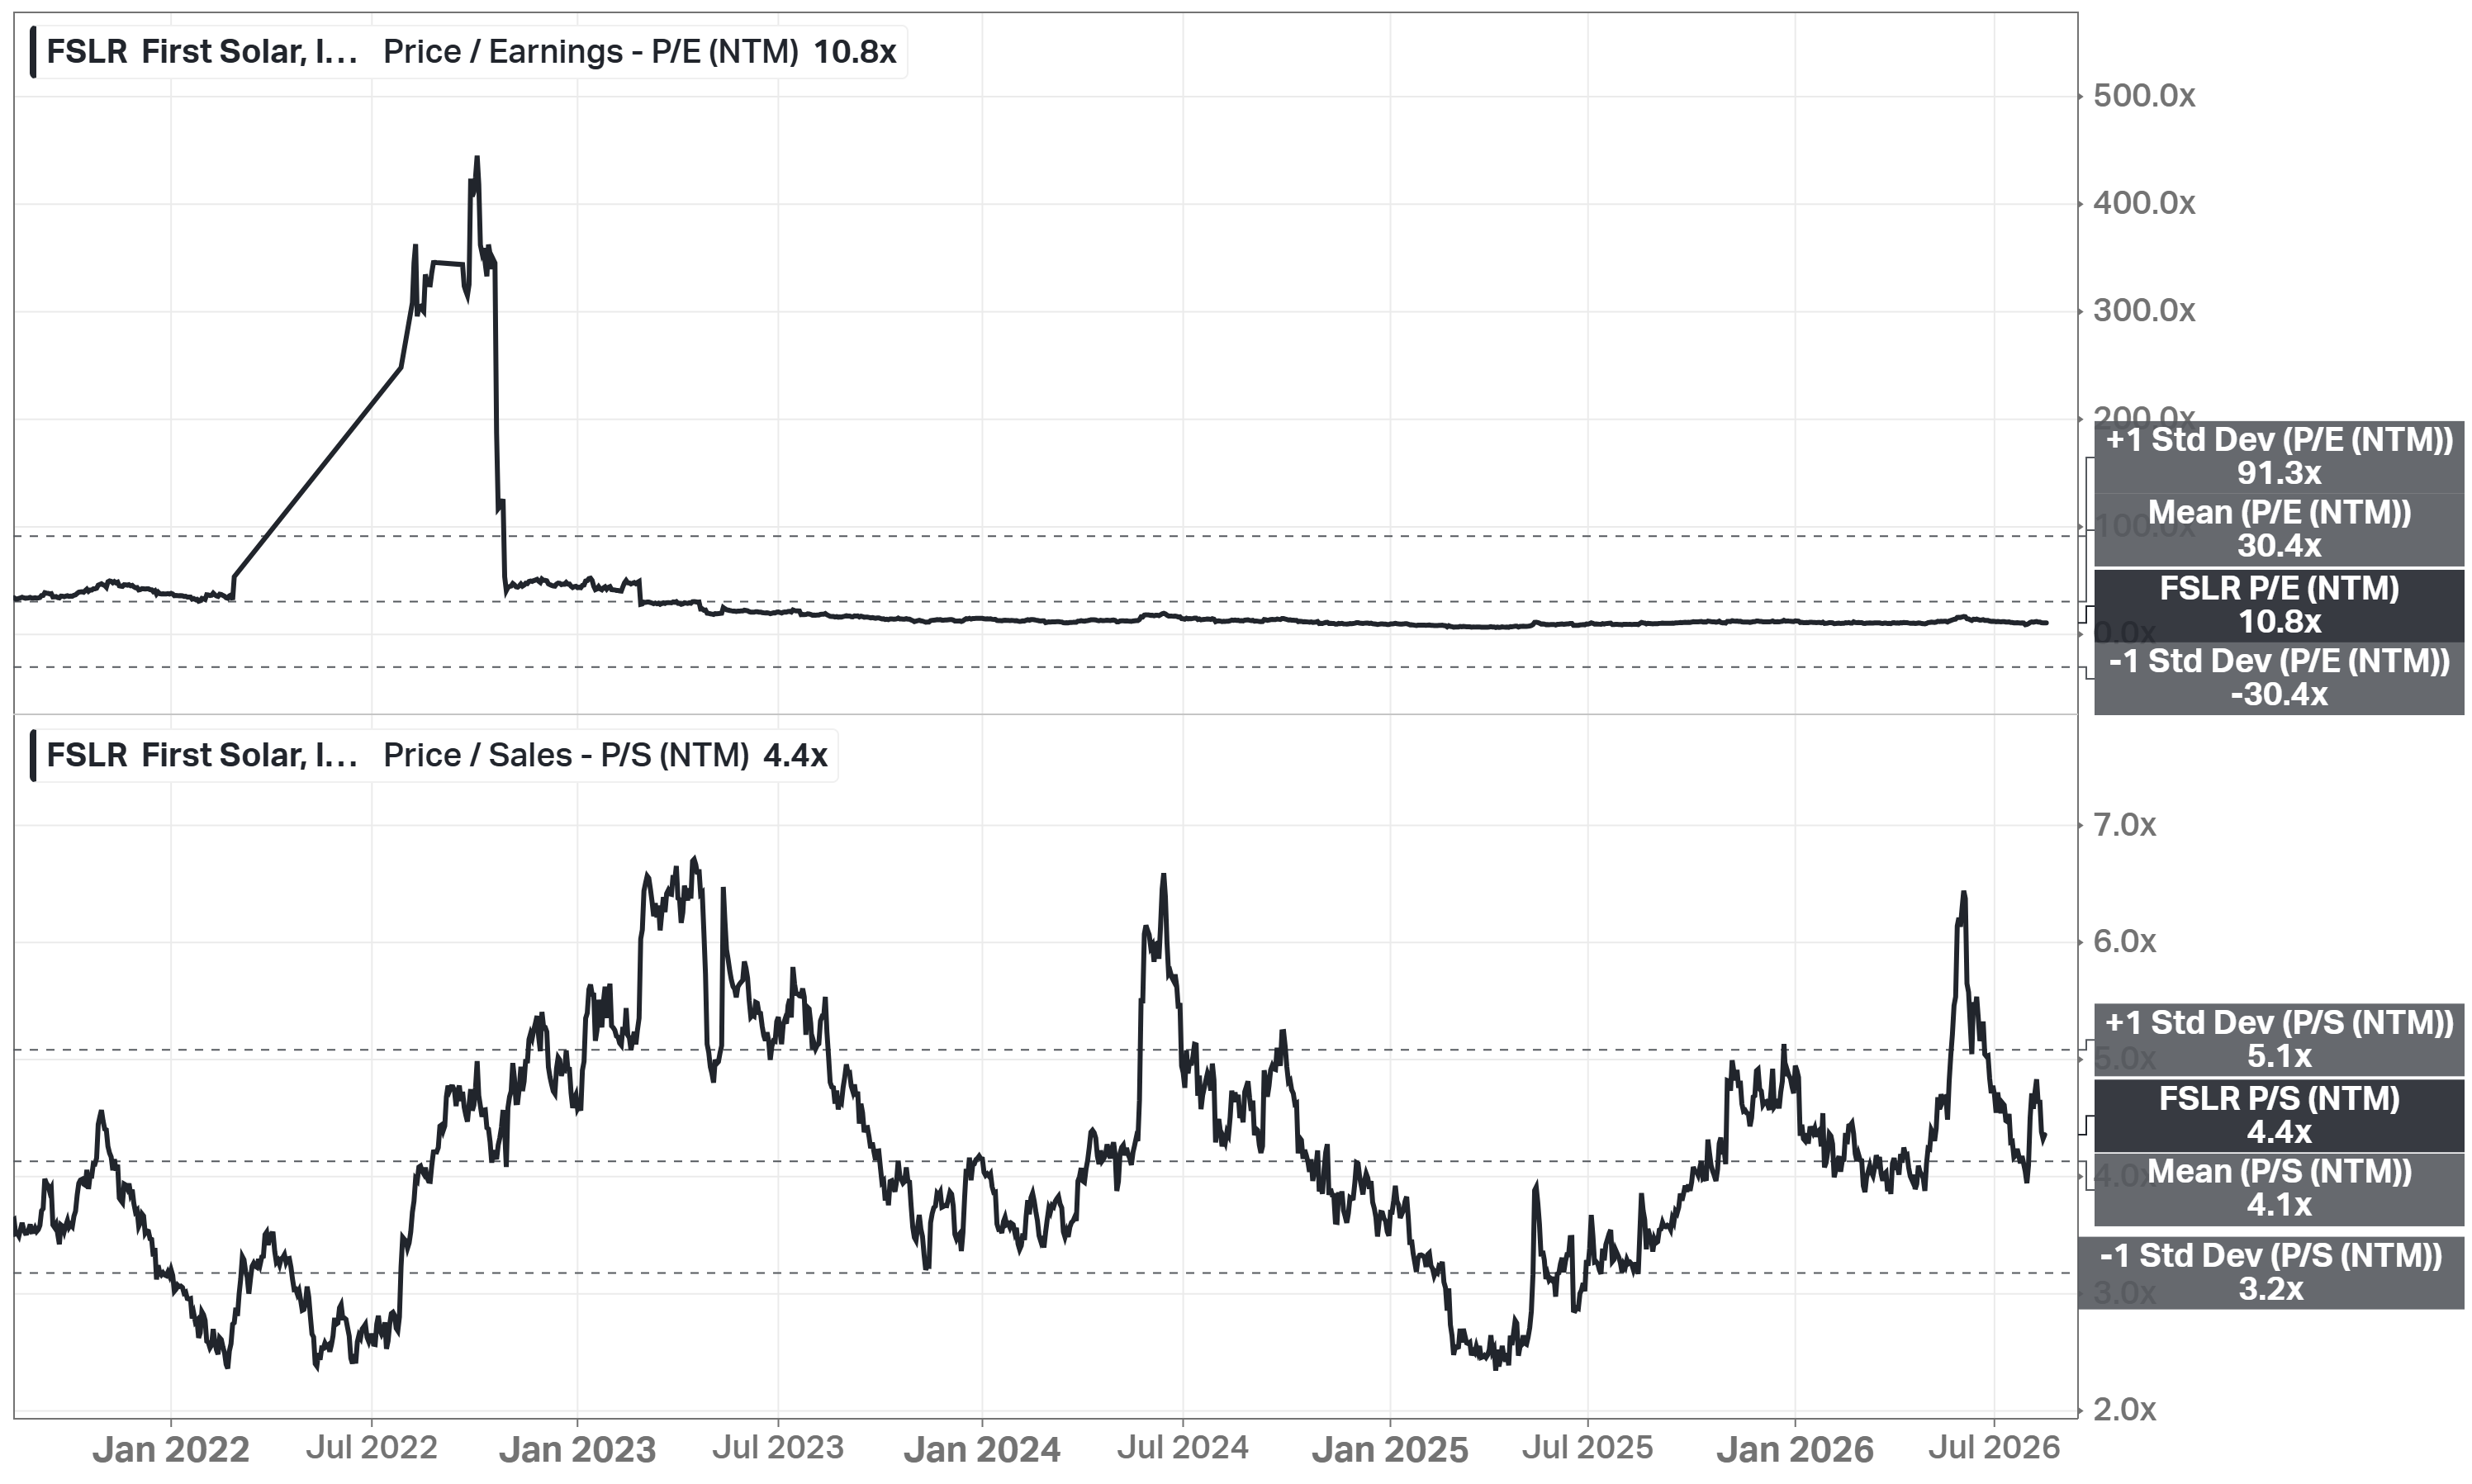
Most multiples here are at or below their 5Y mean. Price/Book is 2.3x against a 2.6x mean, and Price/FCF is 16.2x against a 27.3x mean. On a Price/Sales basis, FSLR is actually slightly above its own mean, at 4.4x versus 4.1x - the one multiple here that has not compressed. First Solar now trades at a 9.3% forward earnings yield. To me, that is a high yield for a business consensus expects to grow EPS at over 20% a year.
Analyst’s note:
The 5Y mean here is distorted by 2022 and early 2023, when First Solar’s earnings were near zero. A near-zero denominator sent the forward P/E and PEG to extreme, meaningless levels for several quarters, which drags the 5Y average up to 30.4x and 2.23 respectively. I do not use those means anywhere in my model. The exit multiples in the Fair Price section start from today’s levels, not from the distorted average.
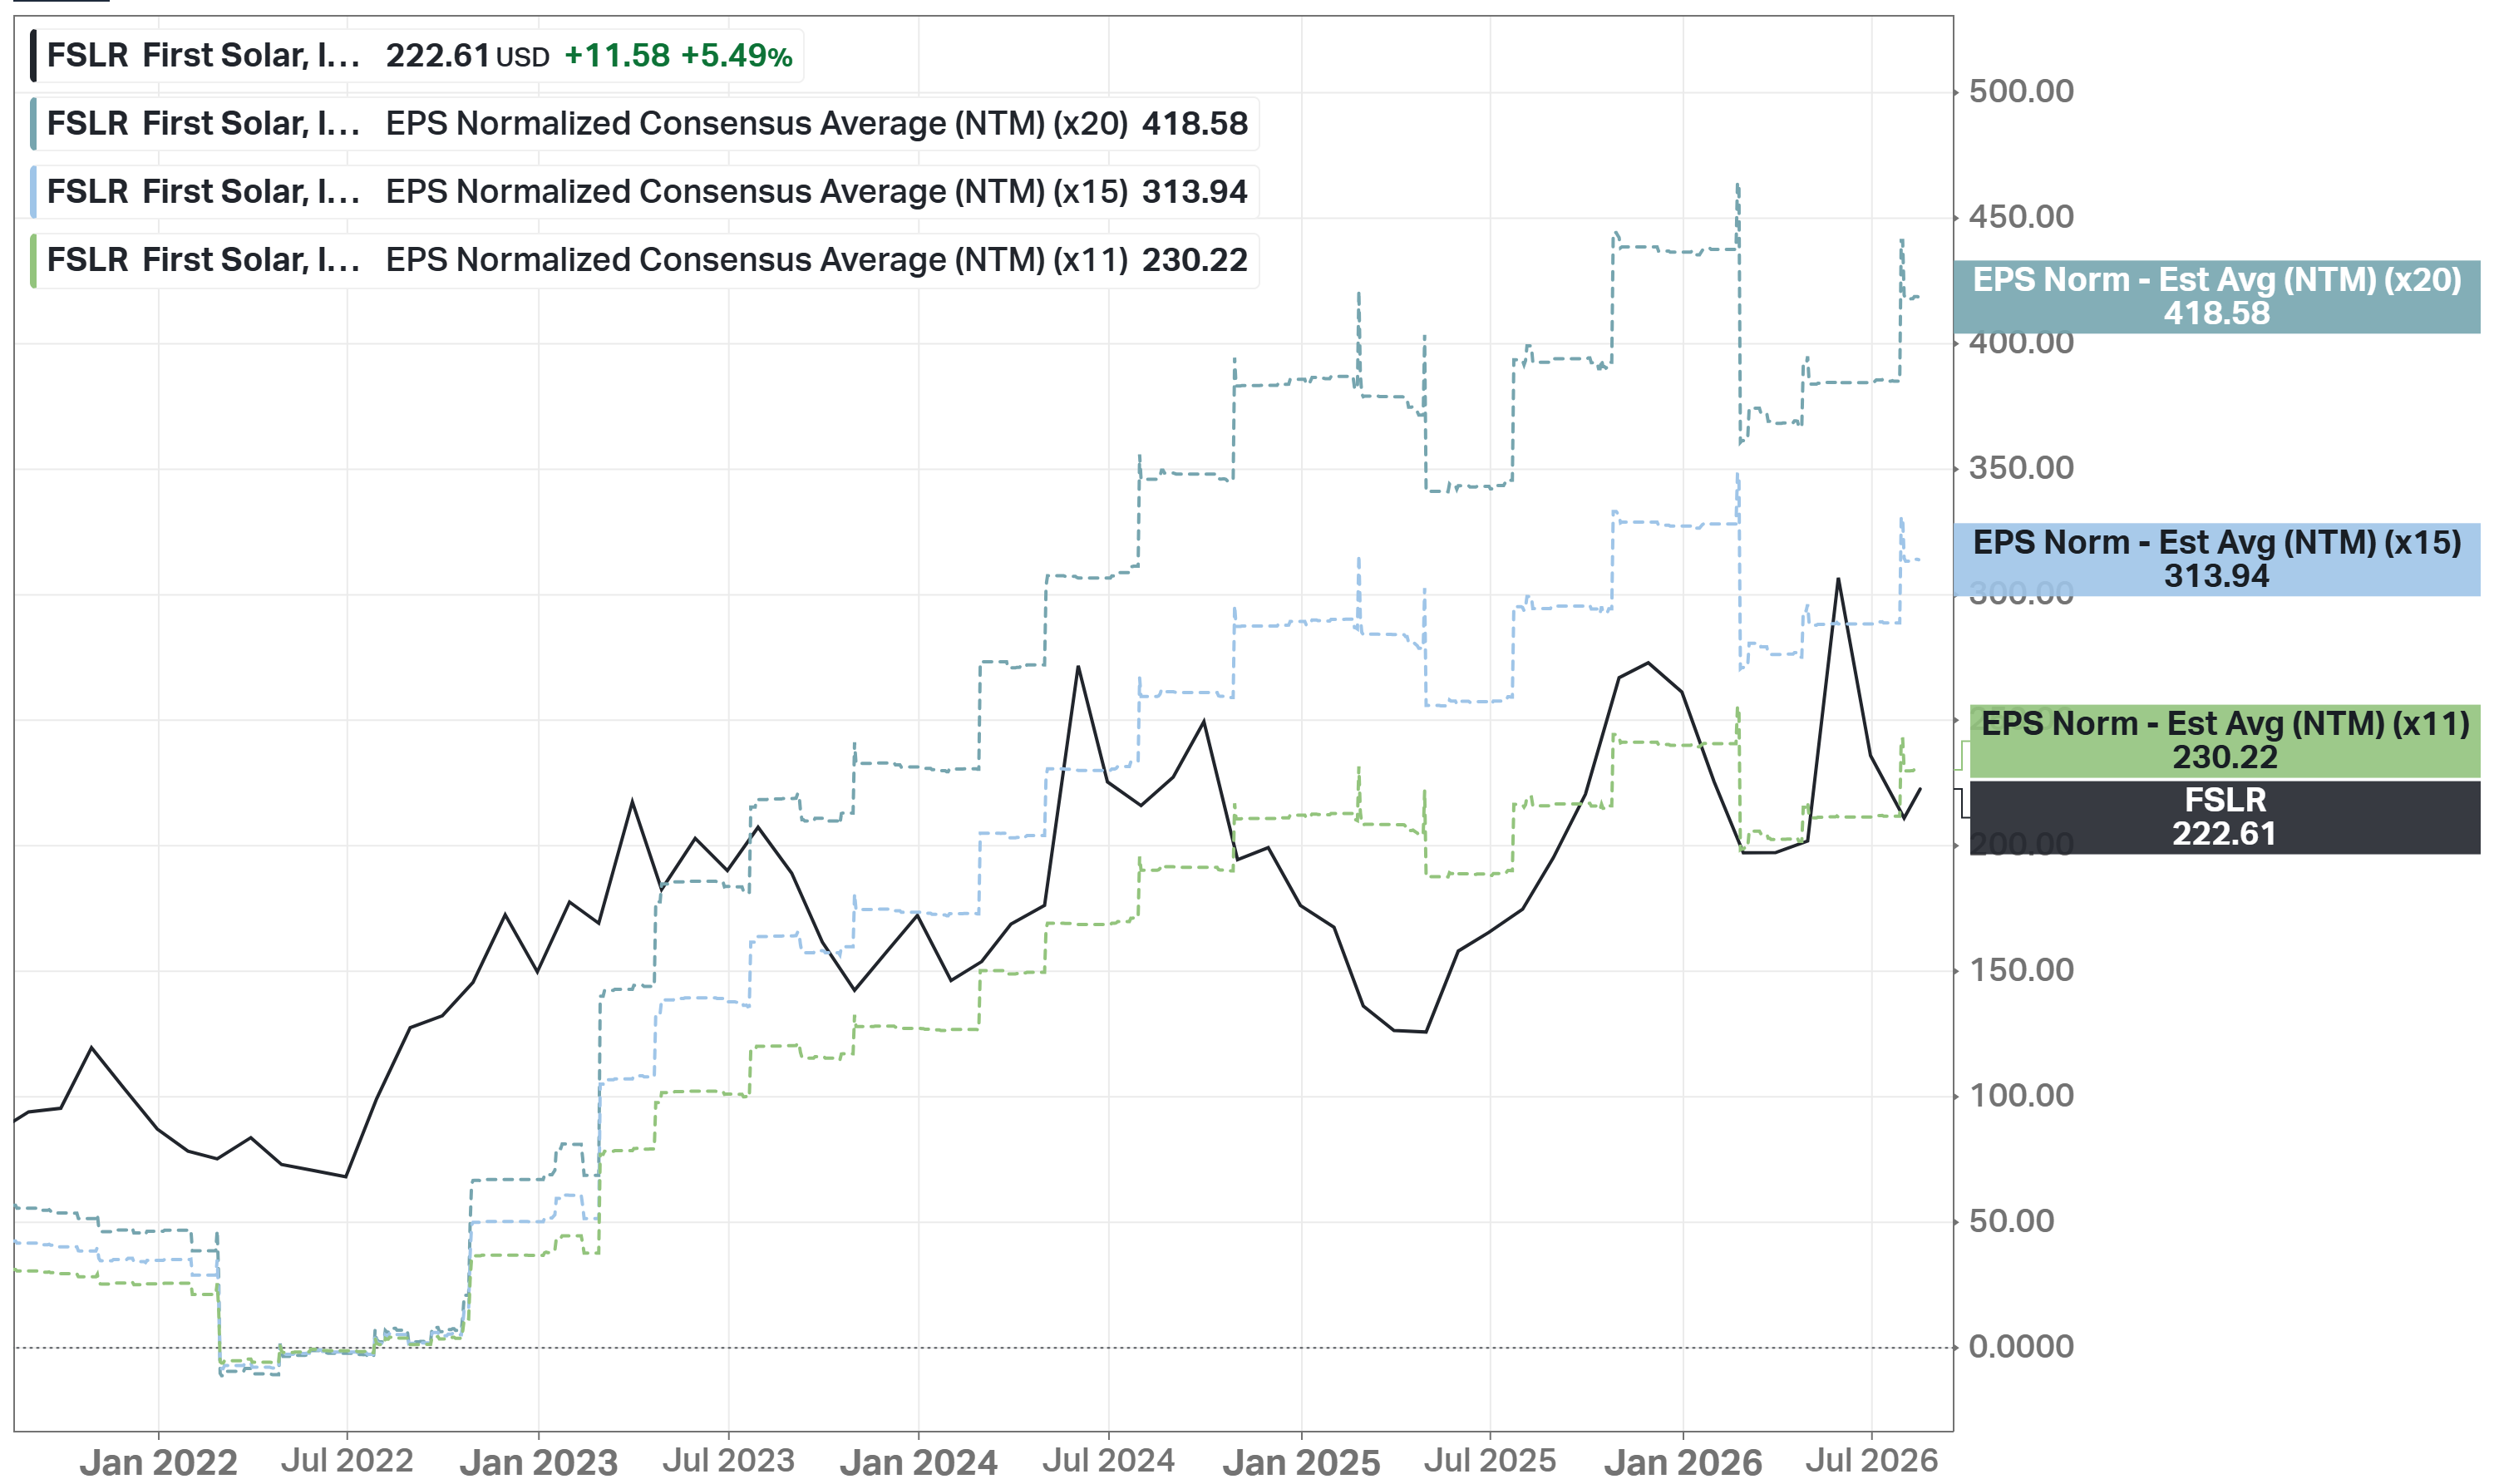
One chart frames this whole section. The corridor below takes the consensus forward EPS estimate and multiplies it by my 3 exit multiples: 11x, 15x, and 20x.
Fair Price
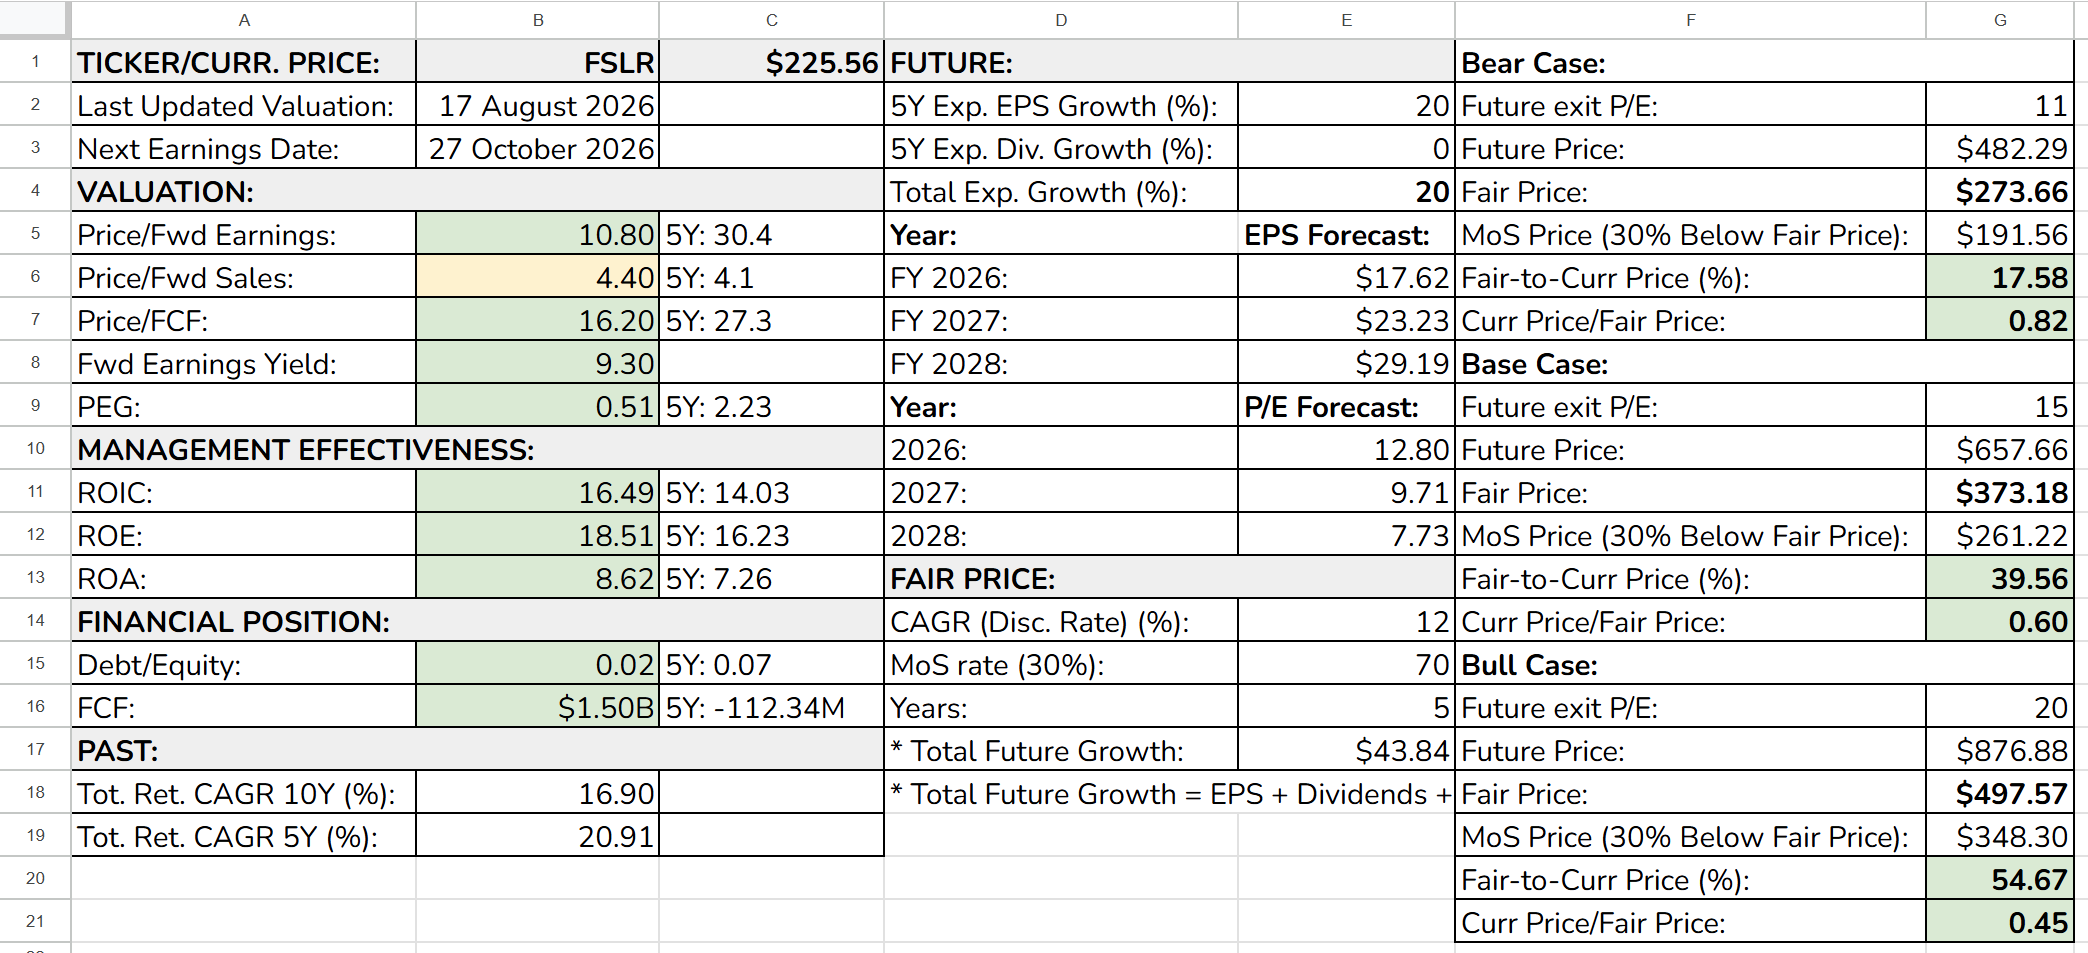
My standard model projects EPS 5 years forward and takes the slowdown risk into account by capping future growth at 20% per year. Consensus for the next 2 years runs above that (+31.2% for FY2027, +26.4% for FY2028), so my projection is below the consensus average. There are no dividends to add. Starting EPS is $17.62 (FY2026), which gives $43.84 in FY2031.
Analyst’s note:
Consensus moved to $17.60 for FY2026 after I had built the model, which starts from $17.62. The 0.1% difference is well within the 30% margin of safety, so I did not rebuild it. On the newer number, the Bear Case is $273 instead of $274.
The discount rate is 12%; the margin of safety is 30%. The exit multiples are 11x, 15x, and 20x. 11x is close to where the stock already trades today - the current NTM multiple is actually a touch below even that. 15x is a modest re-rating, still well under the 30x-plus levels First Solar traded at during 2022-23’s near-zero-earnings stretch. 20x assumes First Solar earns something closer to a quality-industrial multiple once the policy backdrop proves durable over a full cycle. The 30.4x historical mean plays no role, because it is distorted by the near-zero earnings of 2022 and early 2023.
Bear Case (exit P/E 11x): fair price $274 - MoS price $192
Base Case (exit P/E 15x): fair price $373 - MoS price $261
Bull Case (exit P/E 20x): fair price $498 - MoS price $348
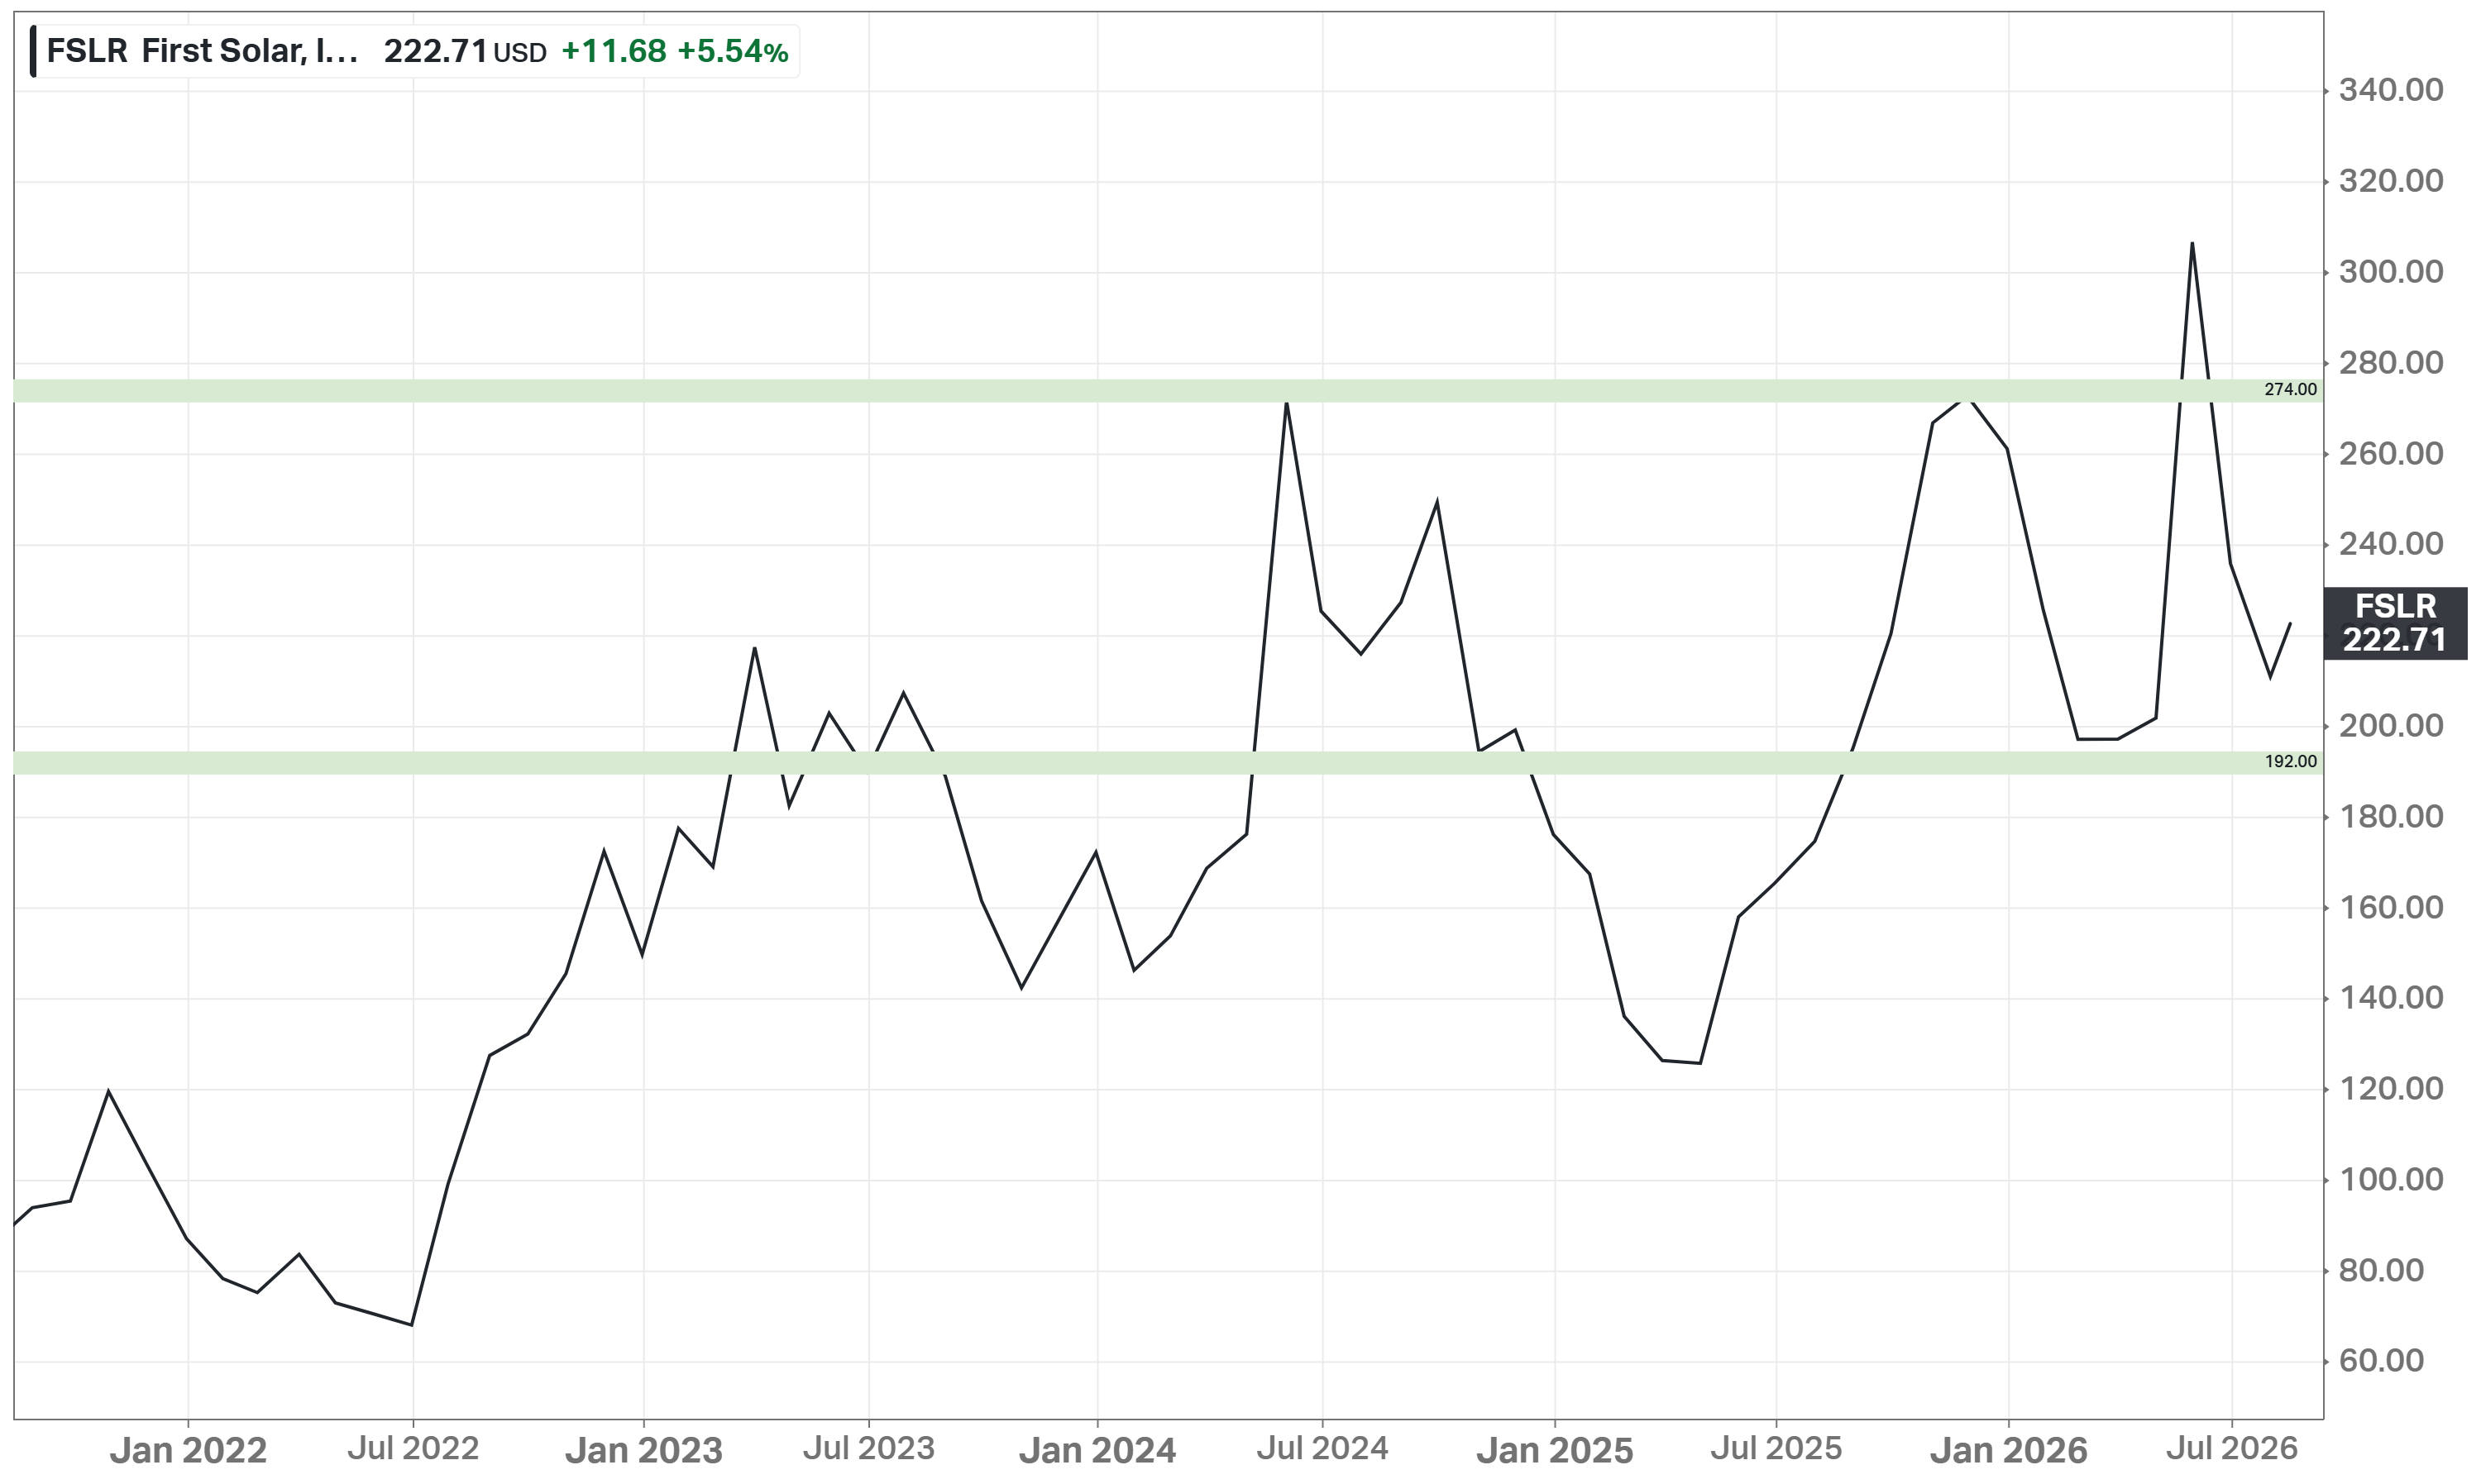
At $225.56, the stock trades 18% below the Bear Case fair price, inside the accumulation zone of $192-274. Worth noting that my Base Case of $373 is still below the highest street target of $402.
Verdict: First Solar belongs in a long-term portfolio as a policy-levered value-and-growth position - not a core holding, and sized like a cyclical industrial with real regulatory risk attached. The company is the largest thin-film solar module manufacturer in the Western Hemisphere, protected less by technology than by US trade and tax policy. The stock trades at 10.8x forward earnings and a PEG of 0.51, among the cheapest multiples in its competitor group despite having the best margins of the 5. My model’s corridor runs $274-498, with an accumulation zone of $192-274; at $225.56, the stock is inside that zone. I’ve owned the company for more than 1.5 years and am going to hold it further. The realistic bear case here is not a demand decline but a policy shock - a cut to Section 45X credits or an adverse Section 232 ruling would reduce earnings directly, since a large share of 2026’s projected profitability runs through the tax credit line rather than the module business itself. Buy with a multi-year horizon, and judge the thesis on the durability of US manufacturing policy and the pace of the backlog converting into shipped, credit-qualified gigawatts - not the share price.
Due Diligence
Profitability (10 of 15):
Positive Gross Profit: $2.37B
Positive Operating Income: $1.81B
Positive Net Income: $1.75B
Positive FCF: $1.50B
Gross margin >= 40%: Yes (44.0%)
Net margin >= 10%: Yes (32.5%)
FCF margin >= 10%: Yes (27.9%)
Management (ROIC, ROE, ROA) >= 10%: Mostly (16.5% / 18.5% / 8.6%)
Strong 3Y Revenue Growth: ~26% per year
Exceptional Revenue Growth Forecast: Mixed (FY2026 guidance is down 3.3%, but FY2027-2028 consensus implies ~14% CAGR)
ROE is increasing: ~7% -> 18.5%
ROIC is increasing: ~6% -> 16.5%
Revenue surprises in the last 5Y in a row: No (Missed: 2021, 2022, and 2023)
EPS surprises in the last 5Y in a row: No (Missed: 2024 and 2025)
EPS growth YoY 5Y in a row: No (Decline in 2022)
Financial Strength (6 of 6):
Total assets ($13.39B) exceed total liabilities ($3.07B) by 4.4x
Negative Net Debt: -$1.54B (cash and short-term investments of $1.73B against $194M of debt)
Low Debt/Equity: 0.02 (5Y mean: 0.07)
Debt/Capital: 0.02 (5Y mean: 0.07)
Interest coverage (FFO): 55.8x
Piotroski F-Score: 8 of 9
Valuation and Advantage (2 of 4):
Valuation < 5Y mean: Yes
Valuation < the industry: Mixed (cheaper than most named competitors on forward P/E, but a forward Price/Sales of 4.62x that runs above the broader solar sub-industry’s 2.13x)
Does it have a moat: No
Outperformed the S&P 500 over 5Y: Yes (21.26% vs 13.70% CAGR)
Shares (1 of 3):
Insider ownership >= 5%: Yes (5.54%)
Fewer shares outstanding YoY: No (slight, steady dilution)
Insider buys in the last 6M: No
Price (2 of 4):
1Y price forecast > 10%: Yes (+20.13%)
Next 5Y EPS growth estimate (CAGR) > 10%: Yes (21.30%)
DCF Value: $205, overvalued by 10%
Short Interest < 5%: No (9.20%)
Watchlist Note
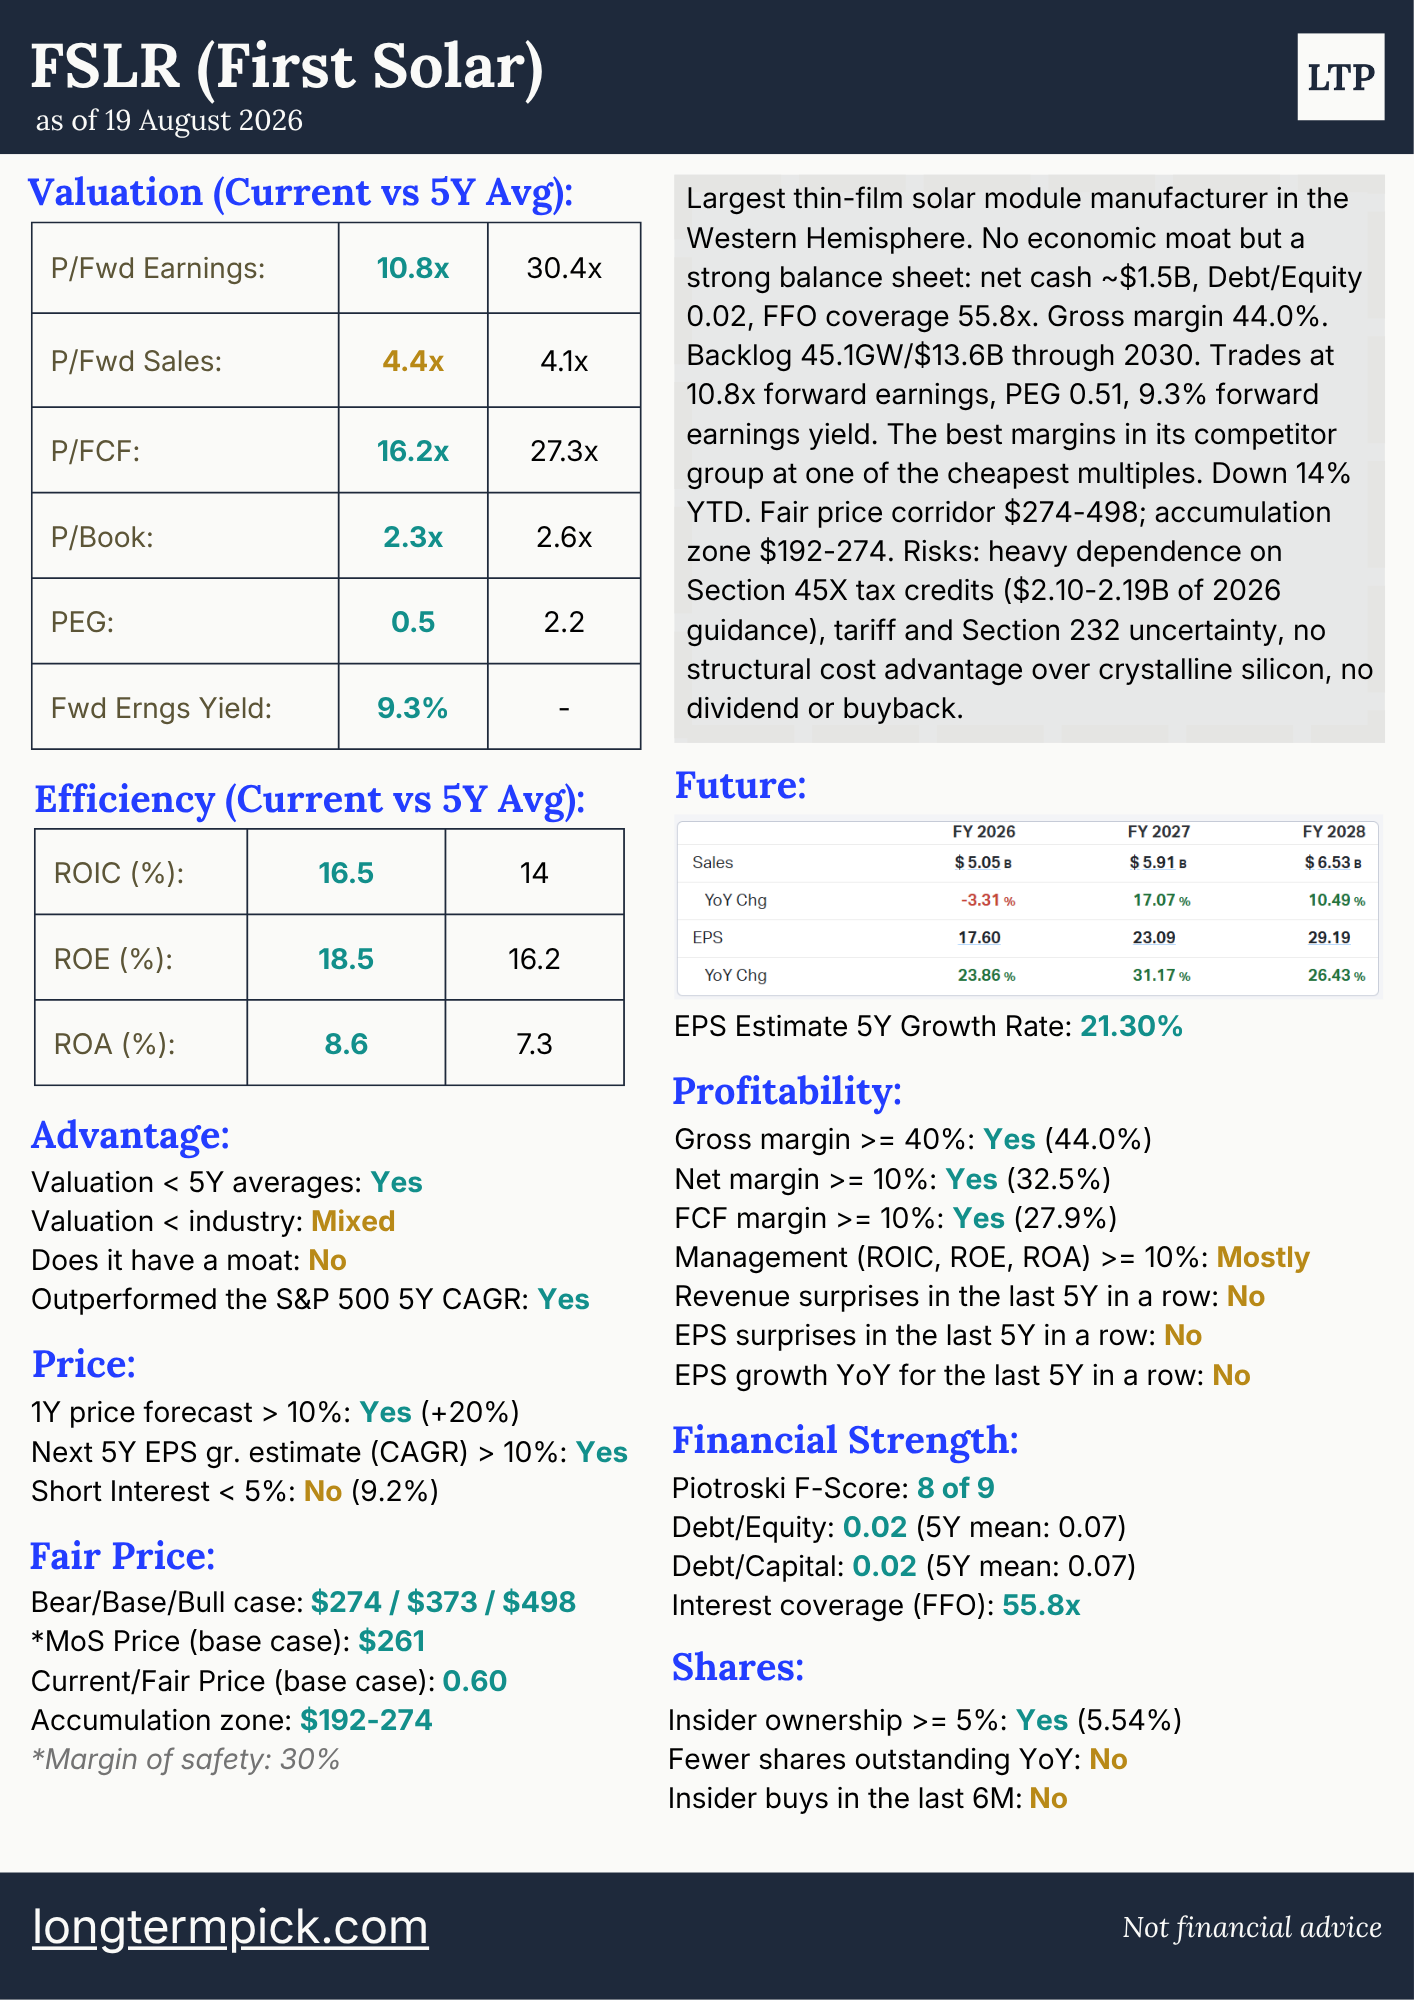
Largest thin-film solar module manufacturer in the Western Hemisphere. No economic moat but a strong balance sheet: net cash ~$1.5B, Debt/Equity 0.02, FFO coverage 55.8x. Gross margin 44.0%. Backlog 45.1GW/$13.6B through 2030. Trades at 10.8x forward earnings, PEG 0.51, 9.3% forward earnings yield. The best margins in its competitor group at one of the cheapest multiples. Down 14% YTD. Fair price corridor $274-498; accumulation zone $192-274. Risks: heavy dependence on Section 45X tax credits ($2.10-2.19B of 2026 guidance), tariff and Section 232 uncertainty, no structural cost advantage over crystalline silicon, no dividend or buyback.
One-Pager
This is not a financial or investing recommendation. It is solely for educational purposes.
The earnings jump in Q2 was that the gross margin improved from 45% to 57%. In the Q2 report it is stated that reason for the improved margin was mainly IEEPA tariff refunds that First Solar got back after the respective Supreme Court decision. That will be a one-time effect and the gross margin will come down again.
So while the revenue can be predicted pretty well, EPS is harder to forecast. On the one hand First Solar will get scaling benefits that come with the expansion but on the other hand they loose this one-time effect.
Calling it a no-moat business while still holding it is the honest version of this, and it makes the policy question the whole thesis rather than a footnote. One thing worth drawing out: the manufacturing credit is paid per watt, not as a share of price, so if module pricing falls the credit becomes a larger fraction of gross profit rather than a cushion against it. That makes the oversupply risk and the policy risk the same risk arriving from two directions, which is a different shape from listing them as separate bullets.