

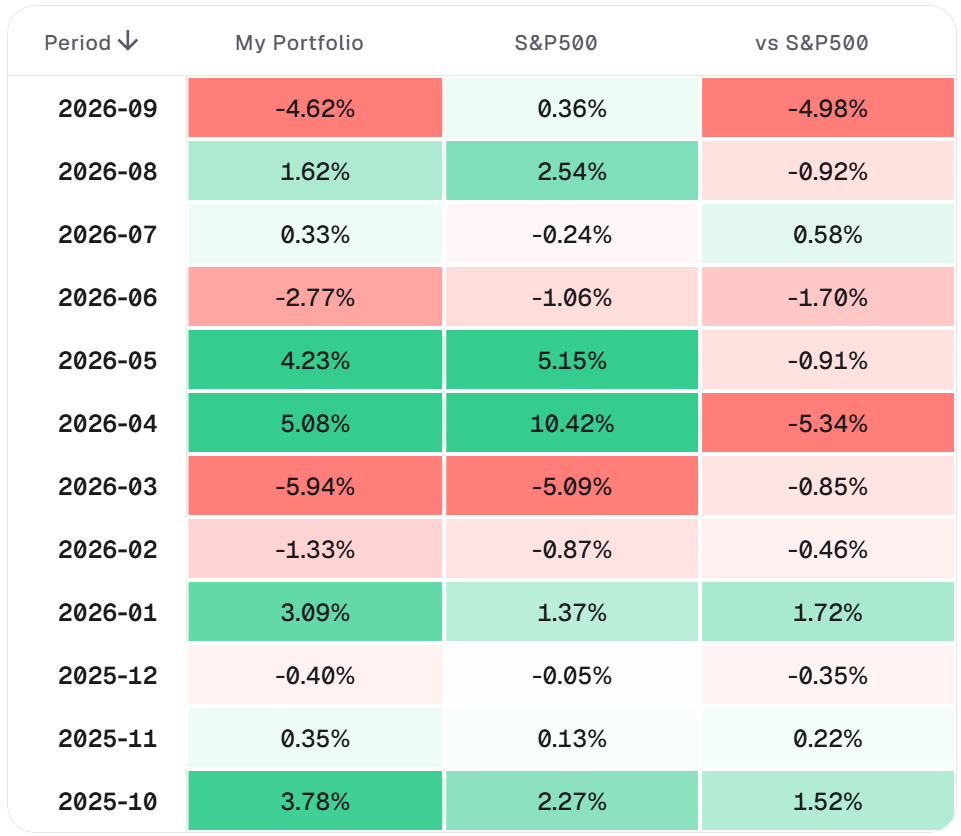
TL;DR: September was a weak month: the portfolio lost 4.62%, while the S&P 500 added 0.36%. YTD, it is at -0.90% against +12.47%, and since December 2021, at +88.83% against +66.63%. Most of the decrease came from long-term interest rates - EDV and First Solar together explain more than half of it. There were no trades, and every point of the September plan was done. At the end of the month, 8 of my 9 stocks were in their buy zones, against 6 of 9 a month ago.
The track record
In September, the portfolio lost 4.62%, while the S&P 500 added 0.36%. YTD, it is at -0.90% against +12.47%. Since December 2021, the portfolio is up 88.83% against 66.63% for the S&P 500, or 14.09% a year against 11.17%.
The YTD gap is ~13 points, and it has two sources. A third of the portfolio is in Treasuries: YTD, SGOV returned ~3%, and EDV lost ~12%. At the same time, FSLR and ADBE both lost ~32% YTD, and V, my largest position, gained only ~4%.
One comparison changed this month. QQQ is now ahead since inception: +93.34% against my +88.83%, or 14.65% a year against 14.09%. In #002, the portfolio was ahead of all four benchmarks. It is still ahead of the S&P 500, VUG (12.64% a year), and SPYG (13.06%). The Sharpe ratio decreased to 0.82 from 0.90; beta (0.95) and the maximum drawdown (-19%, 123 days) did not change.
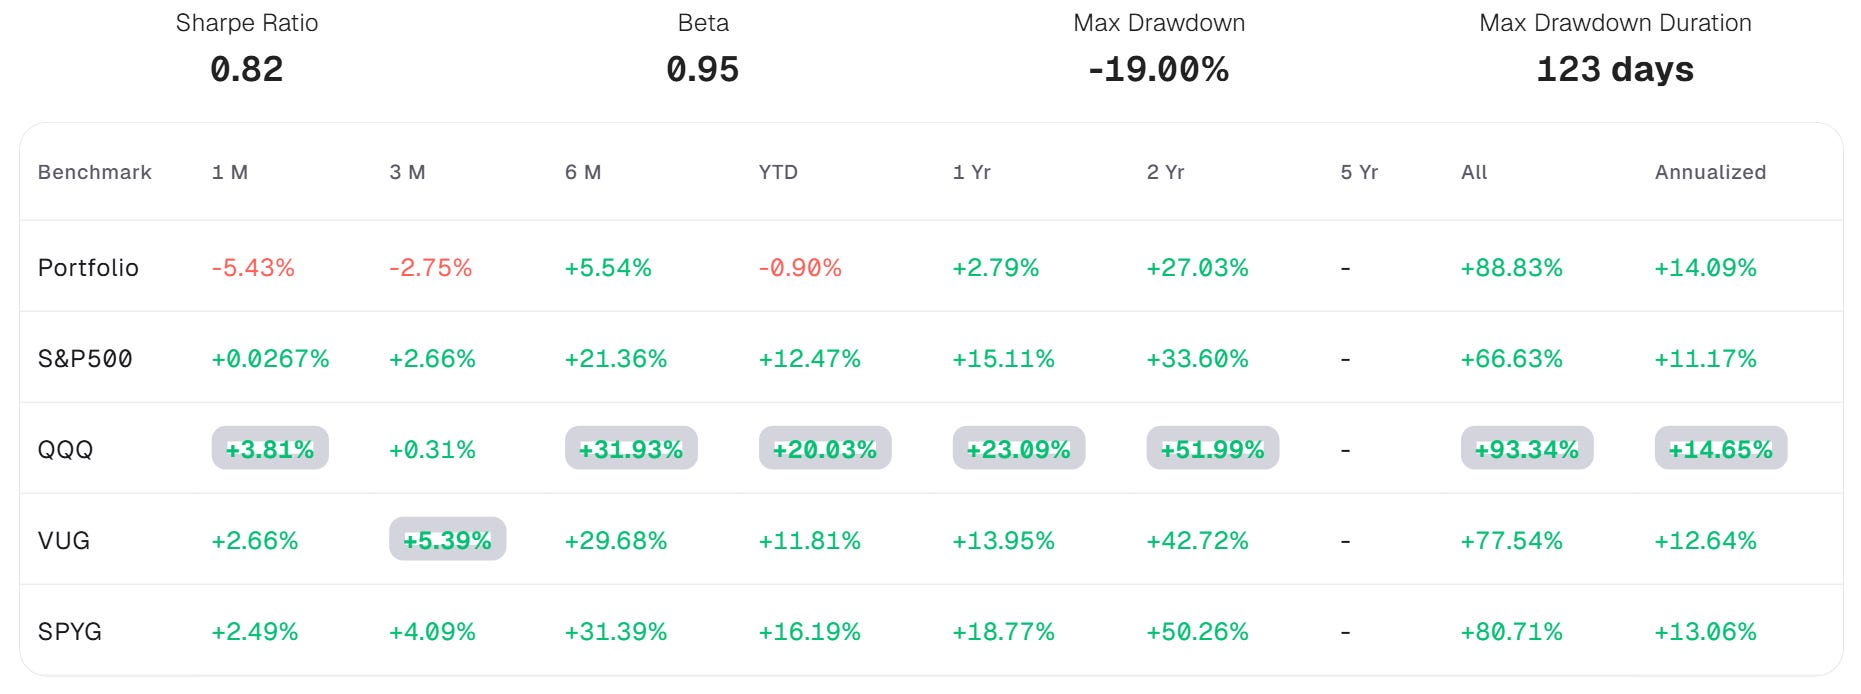
As promised in #002, the final August number is now in the table: +1.62% against +2.54% for the S&P 500. It is lower than the +2.50% I published because that number did not include Aug 31.
Analyst’s note:
The “1M” column in the benchmark table is the trailing month from the day of the screenshot, not the calendar month. The calendar September is in the monthly table: -4.62% against +0.36%.
Analyst’s note:
All numbers in this issue are as of September 30, 2026, taken during the US trading session (around midday in New York), not after the close. The final September figure, with the full last day, will appear in the monthly table of #004.
