

Paid subscribers got this analysis on Oct 04. Upgrade your subscription to get the next one early.

TL;DR: Micron (MU) is one of three companies that make most of the world's DRAM (the working memory of servers, PCs, and phones), and it sells high-bandwidth memory (HBM) for AI chips and solid-state drives (SSDs) for data centers. The Q4 FY2026 report was another record: revenue increased 379% YoY to $54.2B, and gross margin reached 87%. FY2026 net income of $85.0B is 1.85x Micron's combined net income of the previous 10 years. At the same time, the stock is at 6.2x FY2027 consensus earnings, since the market does not believe these margins will last. Management says this cycle is different, because 26 multi-year contracts now have floor prices. I see a better cycle, not the end of cycles - only ~26% of revenue through 2030 has a defined price. Verdict: a record business priced for a peak that lasts. My model holds FY2027 EPS flat for 5 years instead of growing it, and MU is far above my accumulation zone.
Investment Thesis
Micron reported Q4 FY2026 on Sep 30 with revenue, gross margin, and EPS above the top of its own guidance, and it guided another record for Q1 FY2027. In my July analysis, I decided not to buy MU at $879, since a 6x P/E on peak memory earnings is a trap. Since then, the stock is up 25%, and it is still at 6x forward earnings, because the EPS estimates increased almost as fast. Micron has also signed contracts that, as management says, change the economics of the industry. My idea here is to test that claim against 25 years of memory cycles.
The upcycle is still getting stronger. Revenue increased 379% YoY to $54.23B, the sixth record quarter in a row, and non-GAAP EPS reached $33.42. Part of the jump is the calendar, since Q4 had 14 weeks. On a 13-week basis, revenue grew ~22% QoQ, and the Q1 FY2027 guidance of $61.5B is another ~22% above that.
Analysts raise the estimates, and the market still pays 6x. Consensus expects FY2027 EPS of $176.69 (+134%) on revenue of $274.7B (+106%), and the EPS estimate increased 11% in the last 7 days and 18% in 90 days. At $1,097, MU trades at 6.2x that EPS, a 16.1% earnings yield. The PEG ratio of 0.03 means nothing here, since consensus itself expects EPS to stop growing in FY2029. The better question is what the price assumes. At a 12% required return and a 12x exit multiple, MU needs FY2032 EPS of ~$161, 9% below the FY2027 consensus.
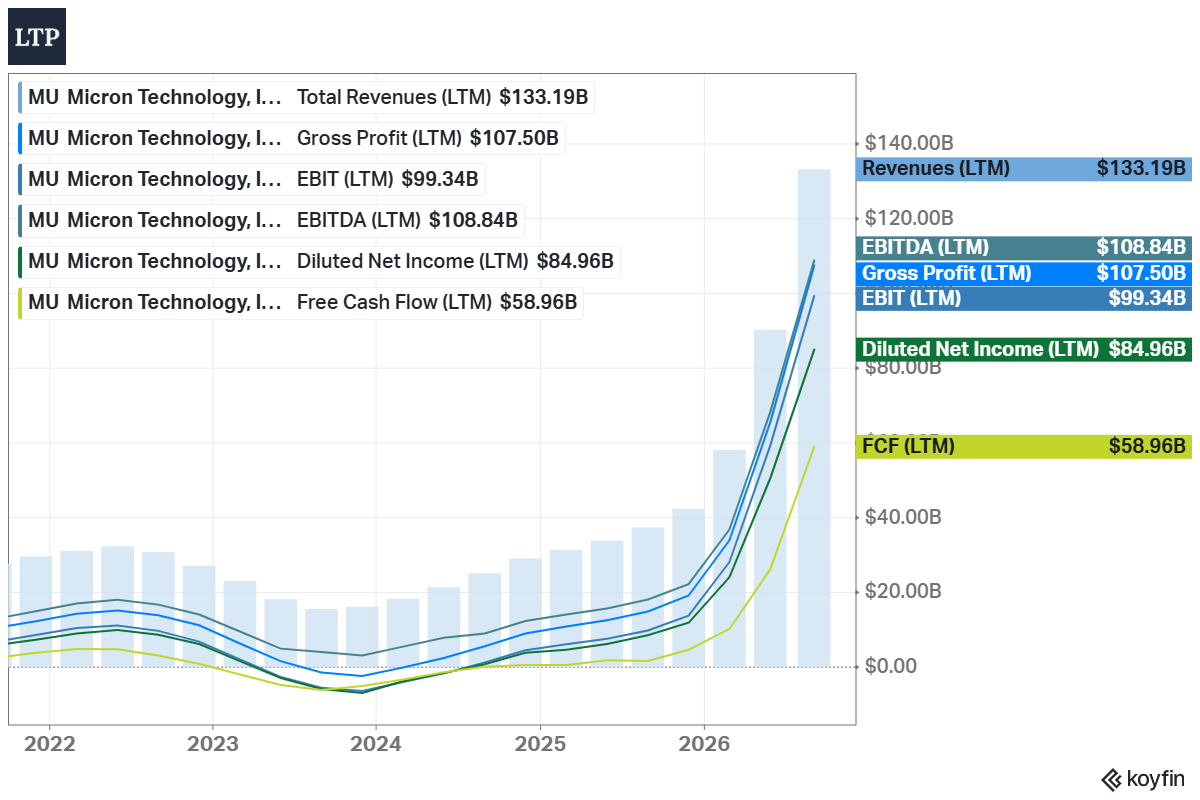
FY2026 was by far the best year in Micron’s history. The GAAP gross margin was 80.72%, net margin 63.80%, and FCF $59.0B after $30.7B of capex. LTM ROIC is 67.49% against a 13.26% 5Y mean. Micron has $68.3B of net cash, against $2.6B of net debt a year ago.
The multiple is low, but it is always low at the top. MU trades at 6.2x forward earnings against a 17.7x 5Y mean, and the mean is distorted by 2023, when forward EPS was close to zero. My own 10Y history from SEC filings gives a better picture. The median trailing P/E at Micron’s reports was 14.6x, but at the two previous earnings peaks, it was 2.6x (December 2018) and 6.1x (July 2022). By then, the stock was already 45-50% below its high.
The bear case: new cleanrooms from all three large producers start output in 2027-2028, customers already cut memory per system, and by TrendForce’s estimate, memory will take 68% of the capex of large cloud companies in 2027. My model takes this into account by holding FY2027 EPS flat for 5 years instead of growing it, and today’s 6x is the Bear Case exit multiple. With these inputs, the Bear Case fair price is $602, and MU trades 82% above it.
Company Overview
Next Earnings Date: Dec 16, 2026 (estimated)
Market Cap: $1.24T
Sector: Information Technology | Industry: Semiconductors
Type: Large Growth
Short Interest: 2.60%
Micron Technology was founded in 1978 in Boise, Idaho, and it is still headquartered there. It is the only US-based DRAM producer. Memory is the whole business: DRAM brought 73% of revenue in Q4 FY2026, NAND 26%, and NOR the rest. Sanjay Mehrotra has been CEO since 2017. Before that, he co-founded SanDisk and was its CEO from 2011 until its sale in 2016. Micron had ~53,000 employees at the end of FY2025.
The product range covers the whole memory hierarchy of a data center. DRAM: HBM stacks that are placed next to AI accelerators (HBM3E and HBM4), high-capacity DDR5 server modules, low-power LPDDR5X (including SOCAMM modules for servers), and graphics memory. NAND: data center SSDs, client SSDs for PC makers, and managed NAND for phones and cars. In December 2025, Micron decided to exit its Crucial consumer business, so that the supply goes to larger customers in faster-growing segments.
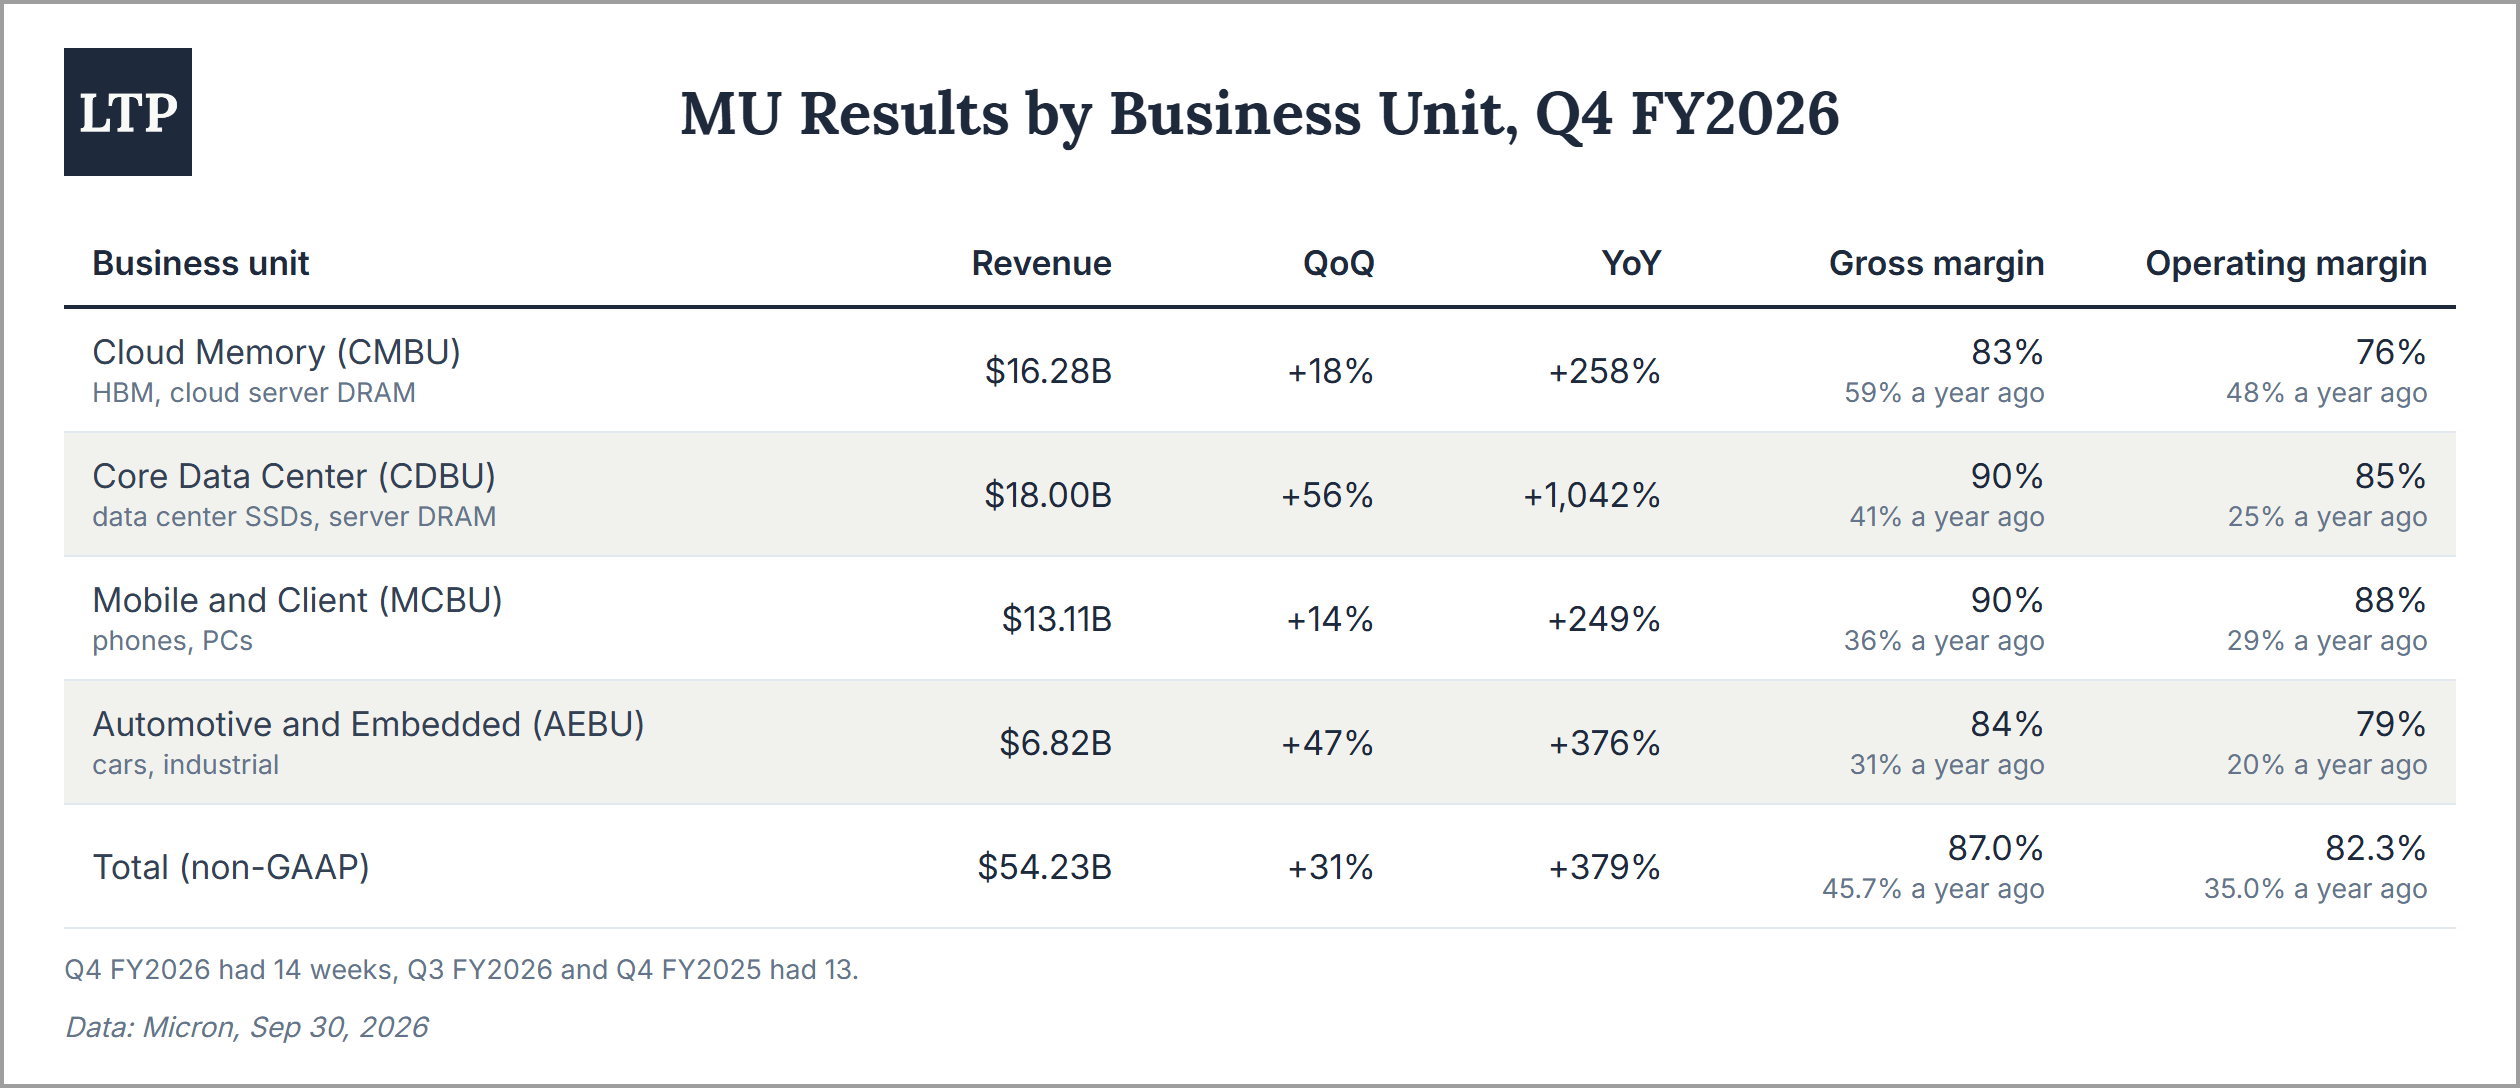
Micron reports four business units. The two data center units brought 63% of Q4 revenue, and the Core Data Center unit grew more than 11x in one year. At the same time, every unit has a gross margin of 83-90%, including phones, PCs, and cars, since prices increased in every market at once.
Micron makes the chips itself. According to its FY2025 10-K, wafers are produced in the US, Taiwan, Singapore, and Japan, and chips are assembled and tested in Taiwan, Singapore, Malaysia, China, and India. New fabs in Idaho, Japan, Singapore, and New York are under construction. Sales go mostly directly to large customers. In FY2025, the top 10 customers brought more than half of revenue, and ~80% of revenue was shipped to locations outside the US.
Market Overview
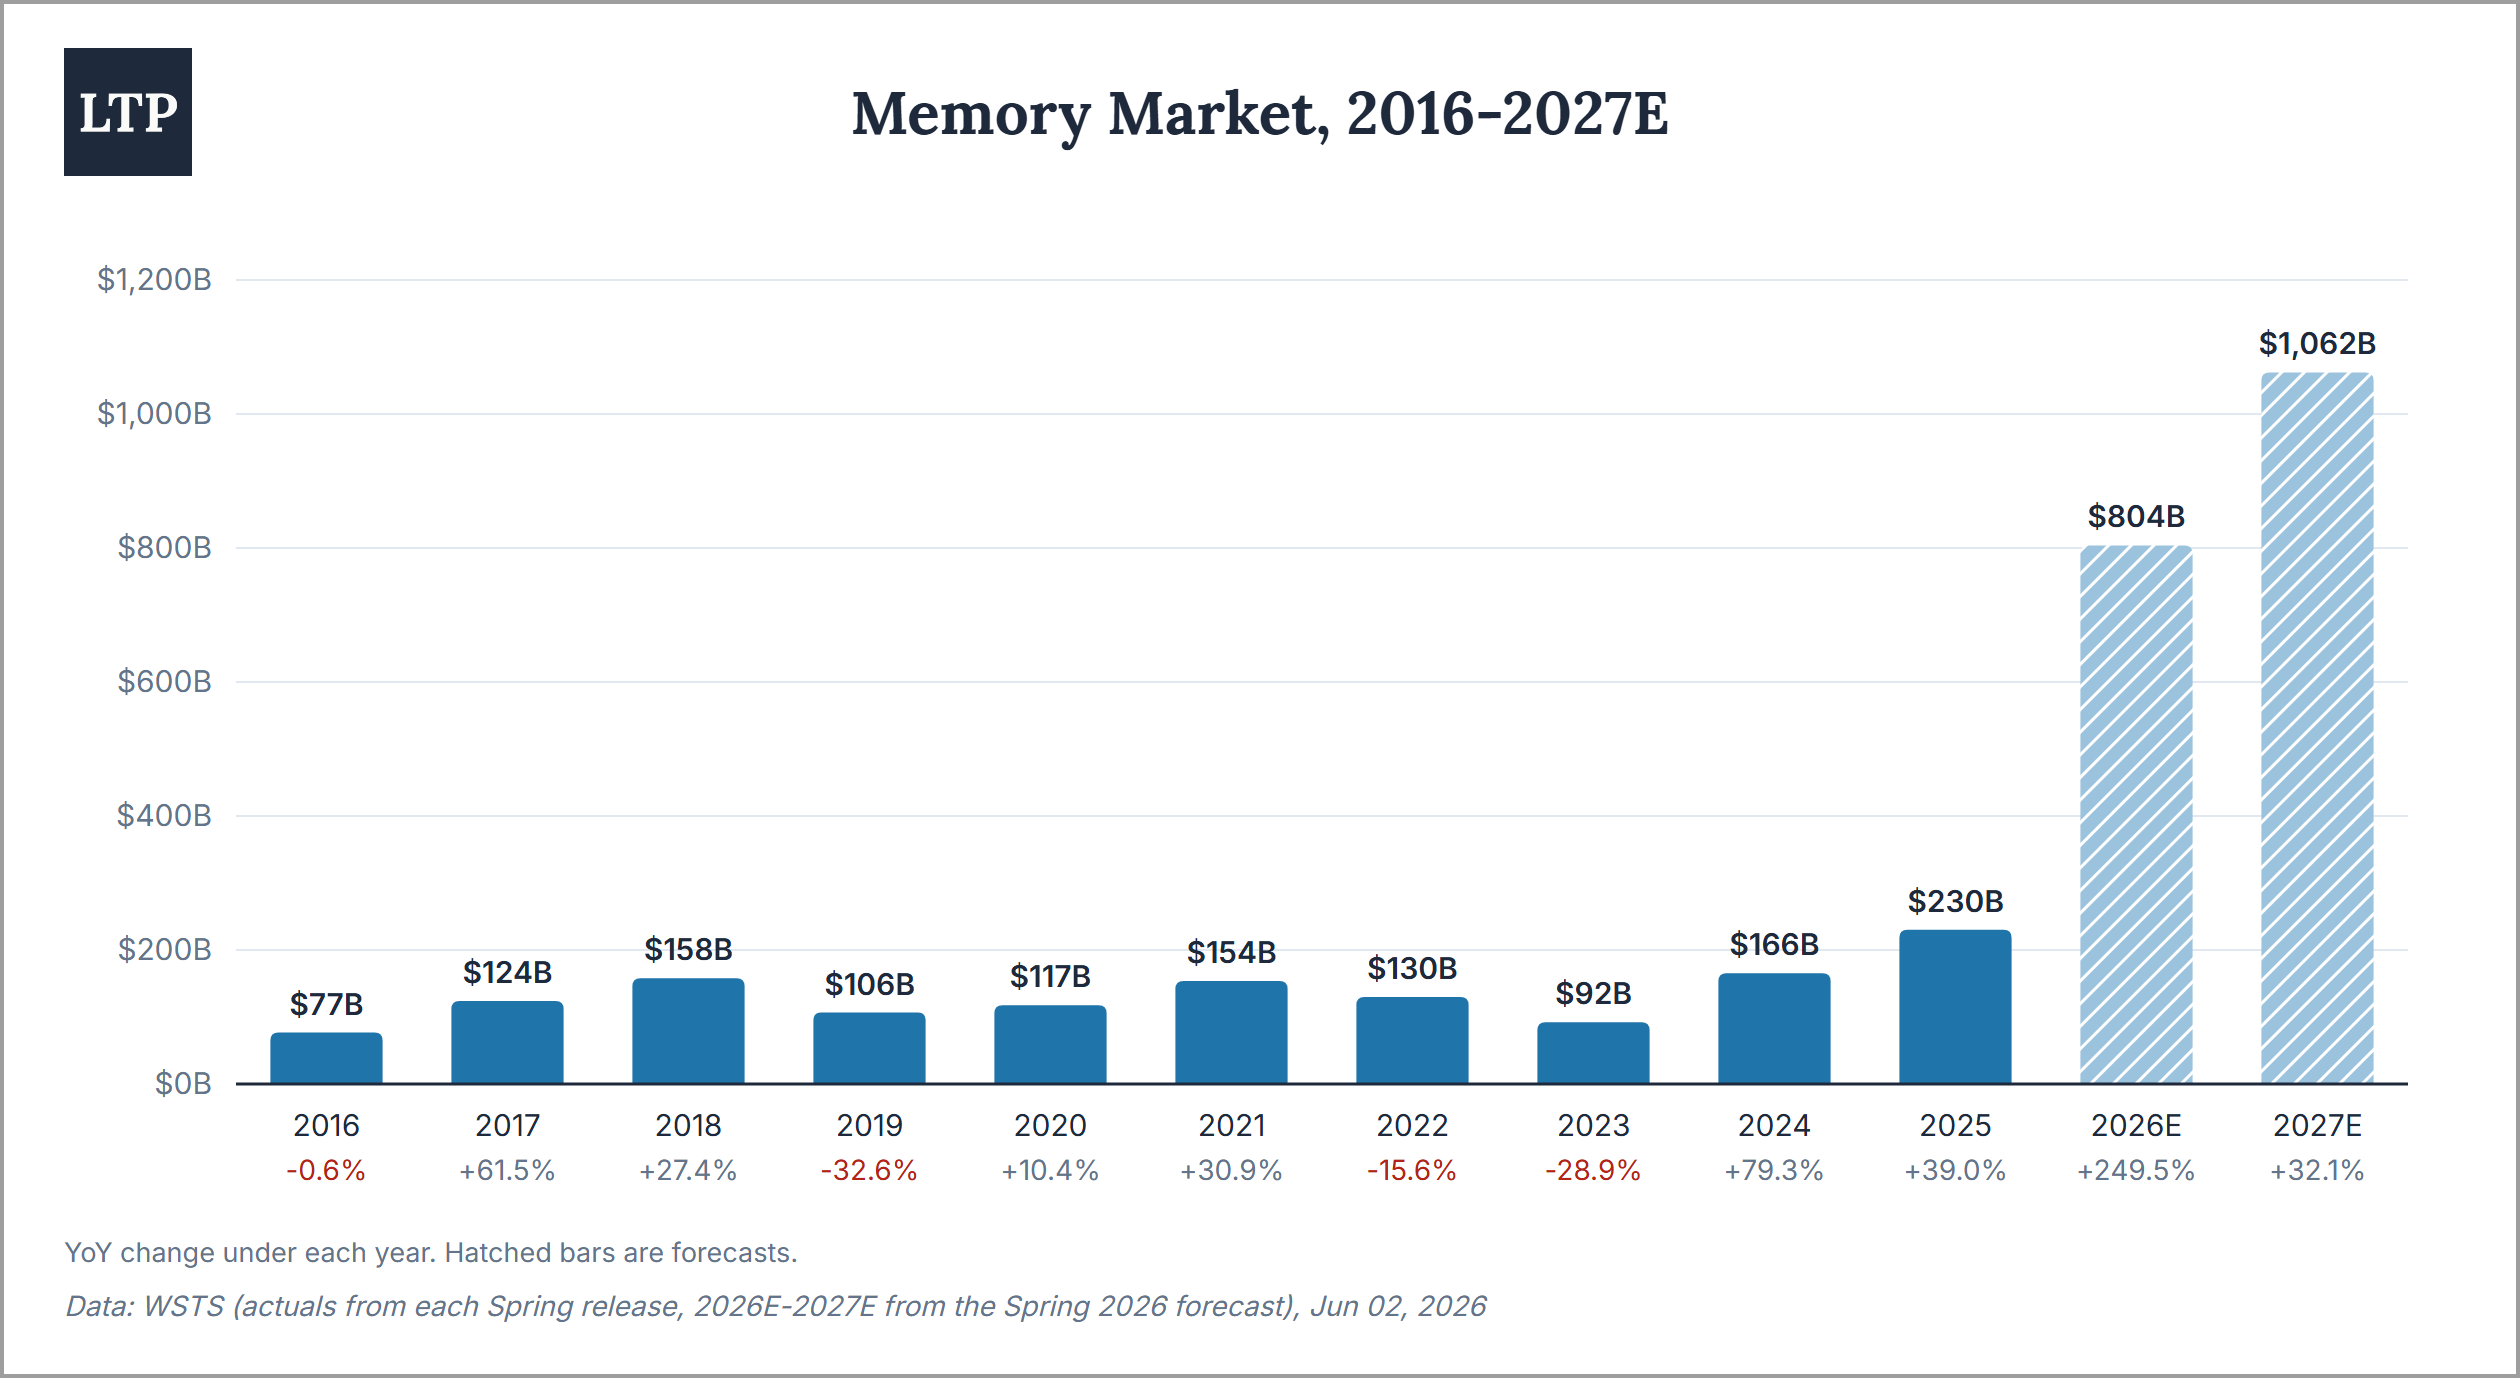
The memory market is set to grow ~4.6x in 2 years. In its June 2026 forecast, World Semiconductor Trade Statistics (WSTS) expects the memory market to grow from $230B in 2025 to $804B in 2026 (+250%) and $1,062B in 2027 (+32%). To compare, the market was $158B at the peak of the 2018 cycle. The same chart also shows what this market does after a peak: -33% in 2019, -16% in 2022, followed by -29% in 2023.
Most of the growth is price, not volume. In Q3 FY2026, Micron’s DRAM revenue increased 343% YoY. In its 10-Q, the company explains it by a “low-260% range” increase in average selling prices and a “low-20% range” increase in bit shipments. In Q4, DRAM prices increased again by a high-teens percentage QoQ, NAND prices by ~30%, while bit shipments grew by a mid-single-digit percentage and ~10%, in a quarter with one extra week. So the revenue growth depends on prices that continue to rise.
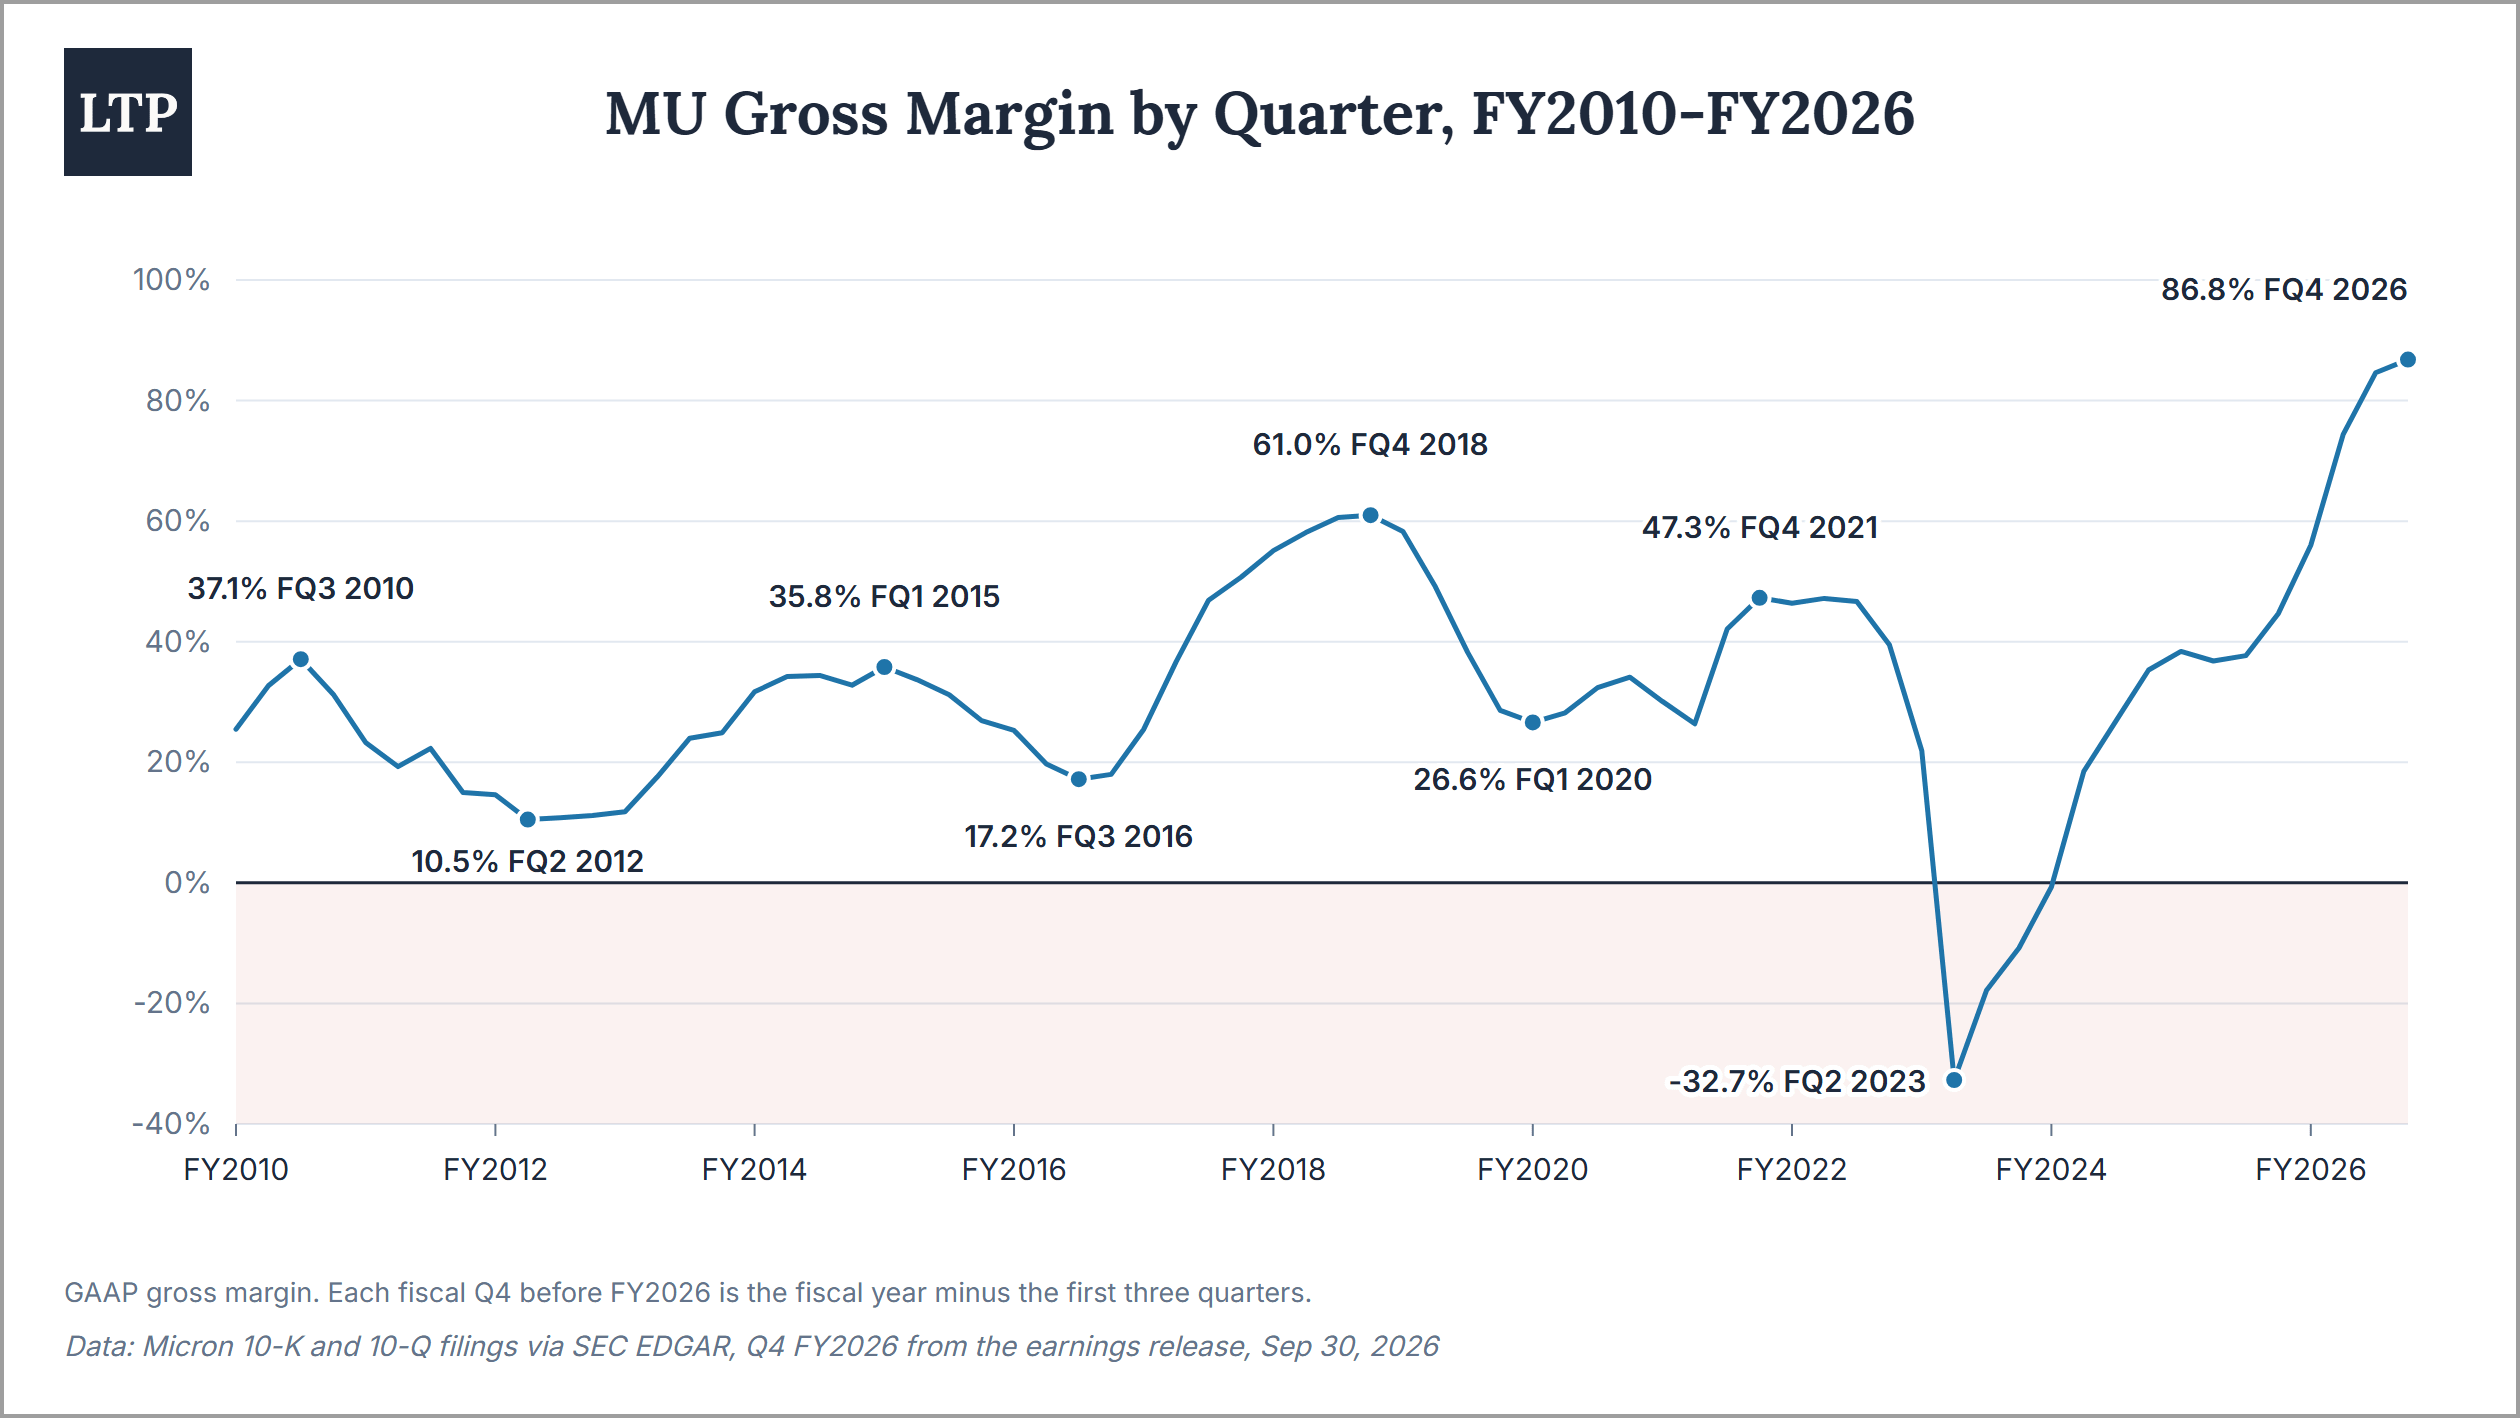
Micron’s margin history shows what happened after every previous price peak. GAAP gross margin reached 61.0% in FQ4 2018, then fell to 26.6% in 5 quarters. It reached 47.3% in FQ4 2021, then fell to -32.7% in FQ2 2023, when Micron sold chips below their cost. Today it is 86.8%, 25.8 points above the previous record.
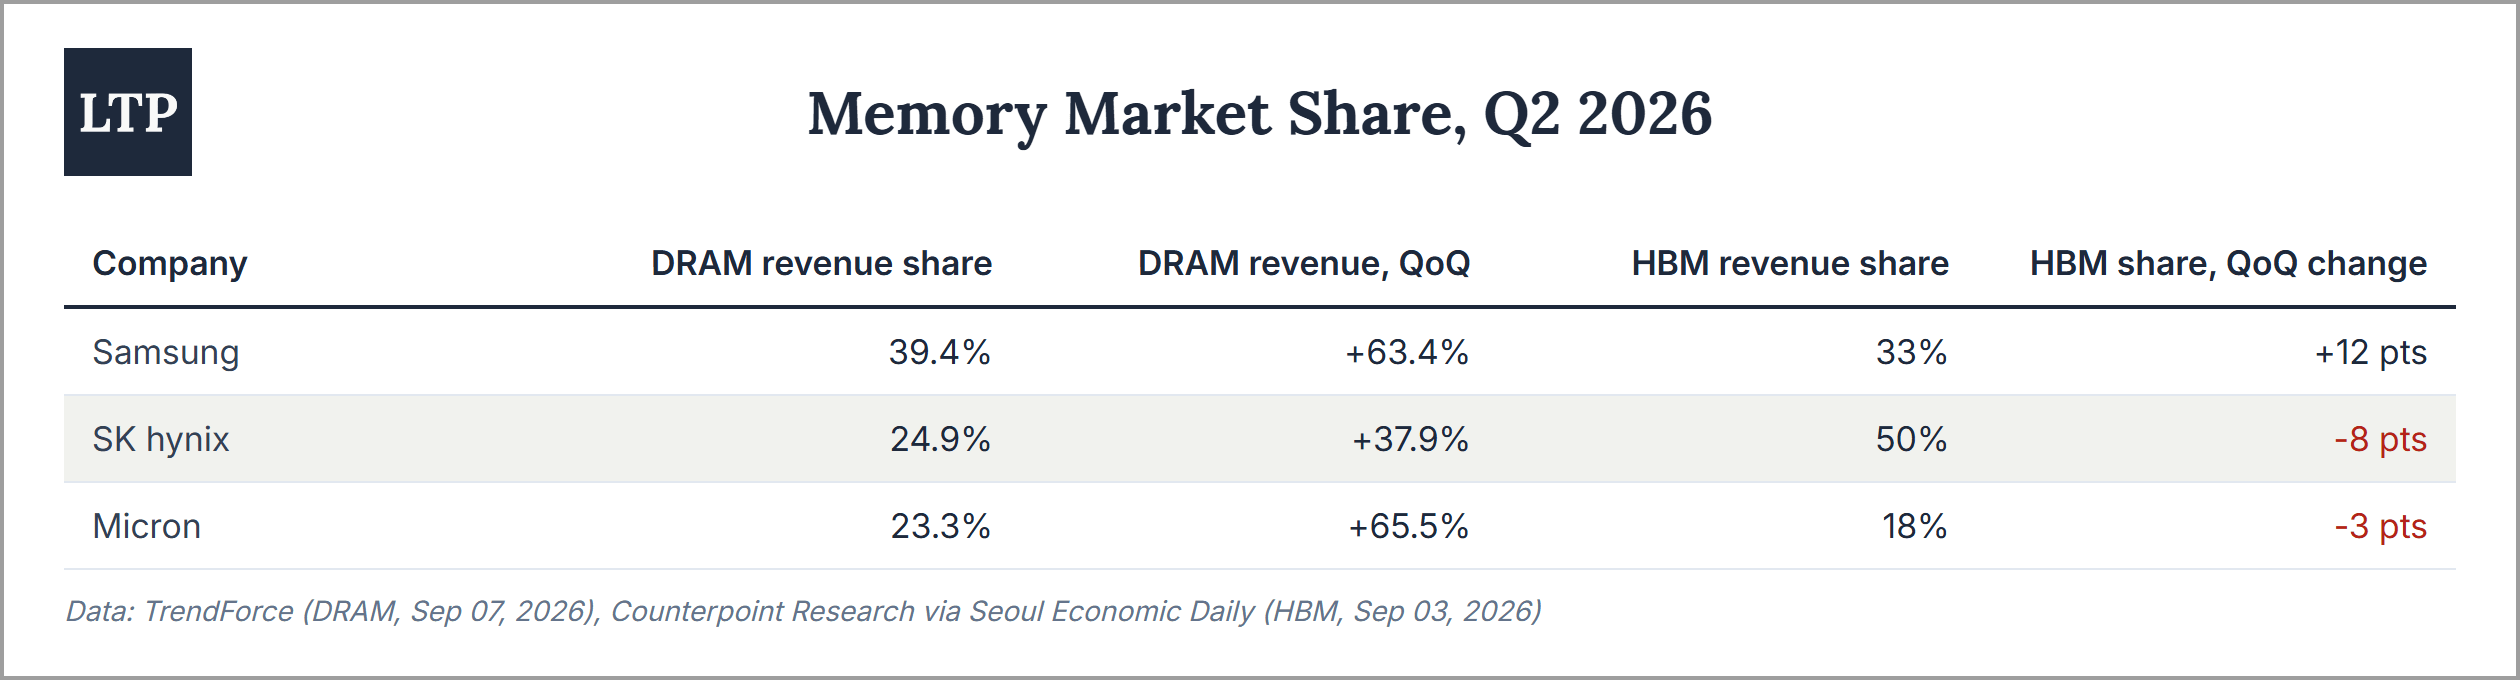
The structure is an oligopoly. In Q2 2026, Samsung, SK hynix, and Micron had 87.6% of DRAM revenue, according to TrendForce. Micron's share was 23.3%, 1.6 points behind SK hynix. In HBM, Micron is the smallest of the three with 18%, down 3 points in one quarter, while Samsung, the first to ship HBM4, increased its share from 21% to 33% (Counterpoint Research data). The fourth DRAM producer is China's CXMT. Its revenue grew 716% YoY in Q2 2026, and Counterpoint expects it to use its recent IPO to expand capacity.
Supply is tight until 2028, and then new capacity arrives. Micron expects industry DRAM bit shipments to grow in the low-20s percentage range in 2027 and 2028, with the industry supply constrained in both years. TrendForce agrees for DRAM - new fabs ramp in the second half of 2027, and “substantial output contributions are not expected to materialize until 2028”. On NAND, the two disagree. Micron expects the NAND industry to stay supply constrained in 2027 and 2028. TrendForce expects NAND supply to become looser in the second half of 2027, with “downward pressure on prices”. NAND was 26% of Micron’s Q4 revenue.
The demand risk is the price itself. TrendForce estimates that DRAM and NAND will take 47% of the total capex of large cloud service providers (CSPs) in 2026 and 68% in 2027. Its suggestion is that CSPs may reduce memory capacity per system. This is already happening. CSPs and server makers reduced server DRAM capacities in the first half of 2026, and NVIDIA (NVDA) is evaluating lower HBM configurations for its next-generation Rubin Ultra. Micron also expects server units to grow in the high teens in 2026 and 2027, with “a modestly lower rate of content growth” per server. In my view, the market here is not limited by demand for AI, but by what customers are ready to pay for memory.
Economic Moat
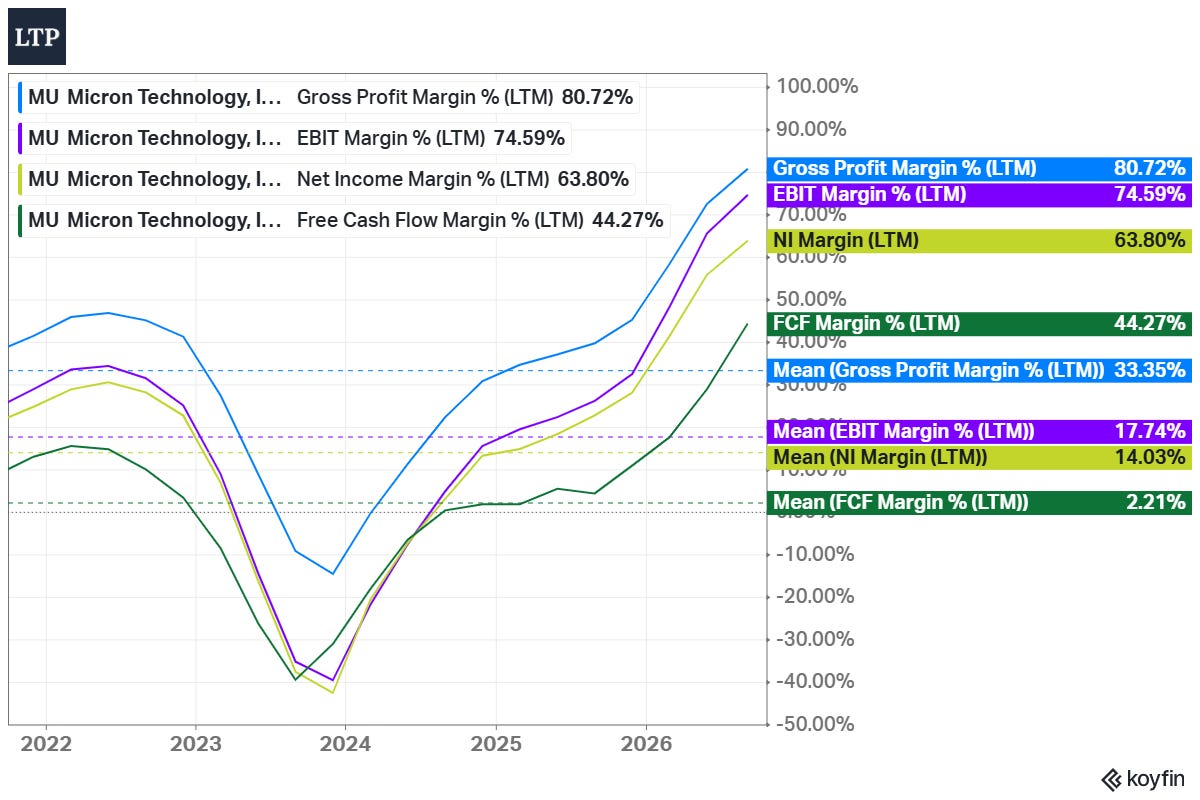
Every LTM margin is a record. Gross margin is 80.72% (5Y mean: 33.35%), EBIT margin 74.59% (17.74%), net margin 63.80% (14.03%), and FCF margin 44.27% (2.21%). A year ago, non-GAAP gross margin for the full year was 40.9%. Nothing in Micron’s products changed this much in one year. The price of memory did.
Let’s see what protects these margins. Scale and technology are real barriers. Only three companies produce leading-edge DRAM at scale, and a new fab takes years and billions of dollars before it gives meaningful output. Micron’s 1-gamma DRAM and G9 NAND nodes are now its largest. HBM adds qualification - each stack is designed and tested together with the customer’s chip. Micron ships HBM4 designed for NVIDIA Vera Rubin and is working with NVIDIA on a custom HBM4E. Once a product is qualified, it is hard to replace within that GPU generation.
The weak point is that the product is still interchangeable. DRAM follows industry standards, so a DDR5 module from Micron and one from Samsung do the same job, and price decides who sells. Pricing power appears in shortages and disappears in gluts. The 10-year record shows it. From FY2016 to FY2025, Micron spent $91.4B on capex and earned $46.0B of net income, so it invested ~2x what it earned. In FY2023, it lost $5.8B.
The new element is the contracts. Strategic customer agreements (SCAs) are take-or-pay contracts with committed volumes, and most of them have a floor price. Management says that even at floor prices, gross margins will be “well above our peak quarterly margins in any past cycle”. If that is true, the next downturn should be much smaller than the last ones. As I see it, this can make Micron’s cycle shallower, but it is not a moat yet - the contracts are less than a year old and have never been tested in a downturn.
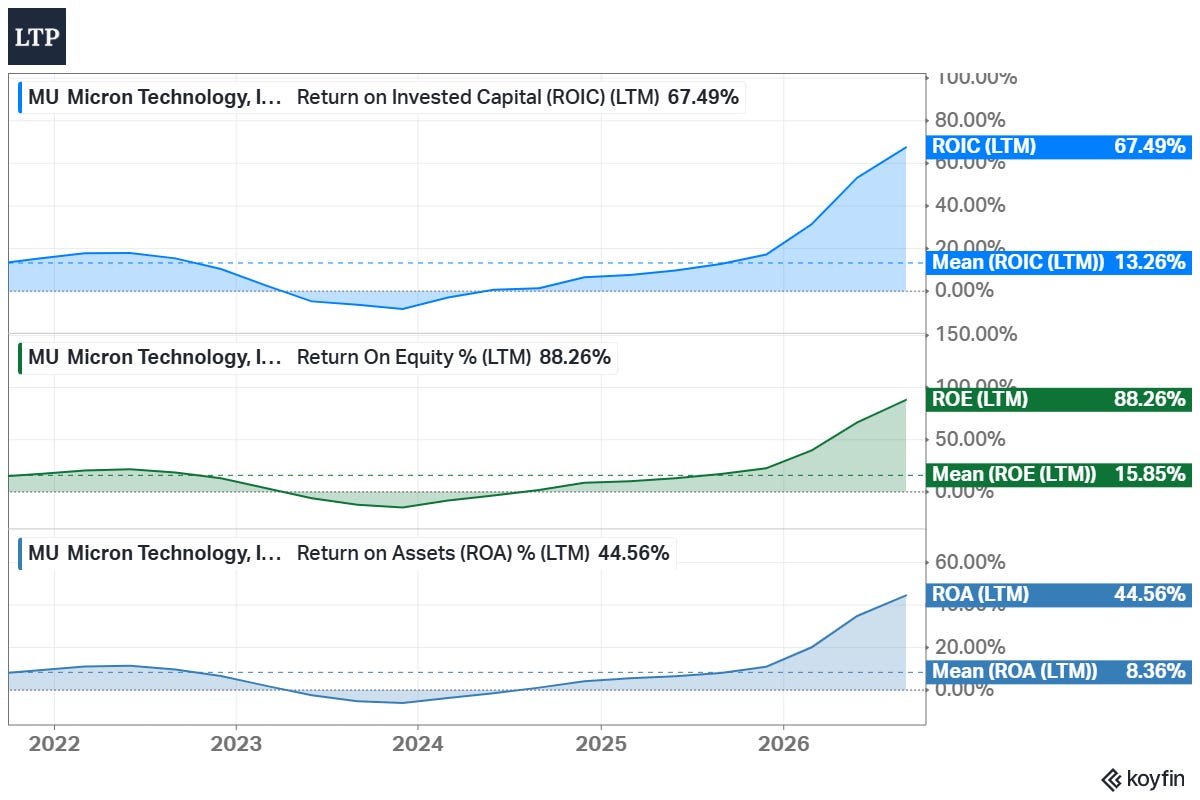
Returns on capital tell the same story. ROIC is 67.49% (5Y mean: 13.26%), ROE 88.26% (15.85%), and ROA 44.56% (8.36%). The 5Y means include the boom of 2026 and are still far below today's levels. In my view, Micron has no durable moat - it has an excellent position in an oligopoly, but its excess returns appear only at the top of each cycle.
Business Strategy
Contracts before the next downturn. Micron has signed 26 SCAs and estimates them at more than 35% of its revenue through 2030. Three-quarters of this revenue has a defined pricing framework, mostly a floor and a ceiling, and one-quarter is negotiated at market prices. Customers committed $32B, mostly as cash deposits, and $12.7B of deposits are already on the balance sheet. Remaining performance obligations (RPO) increased from ~$5B at the end of May to ~$150B. As management explained on the earnings call, RPO counts only committed volumes at minimum prices, so it is a floor, not a forecast.
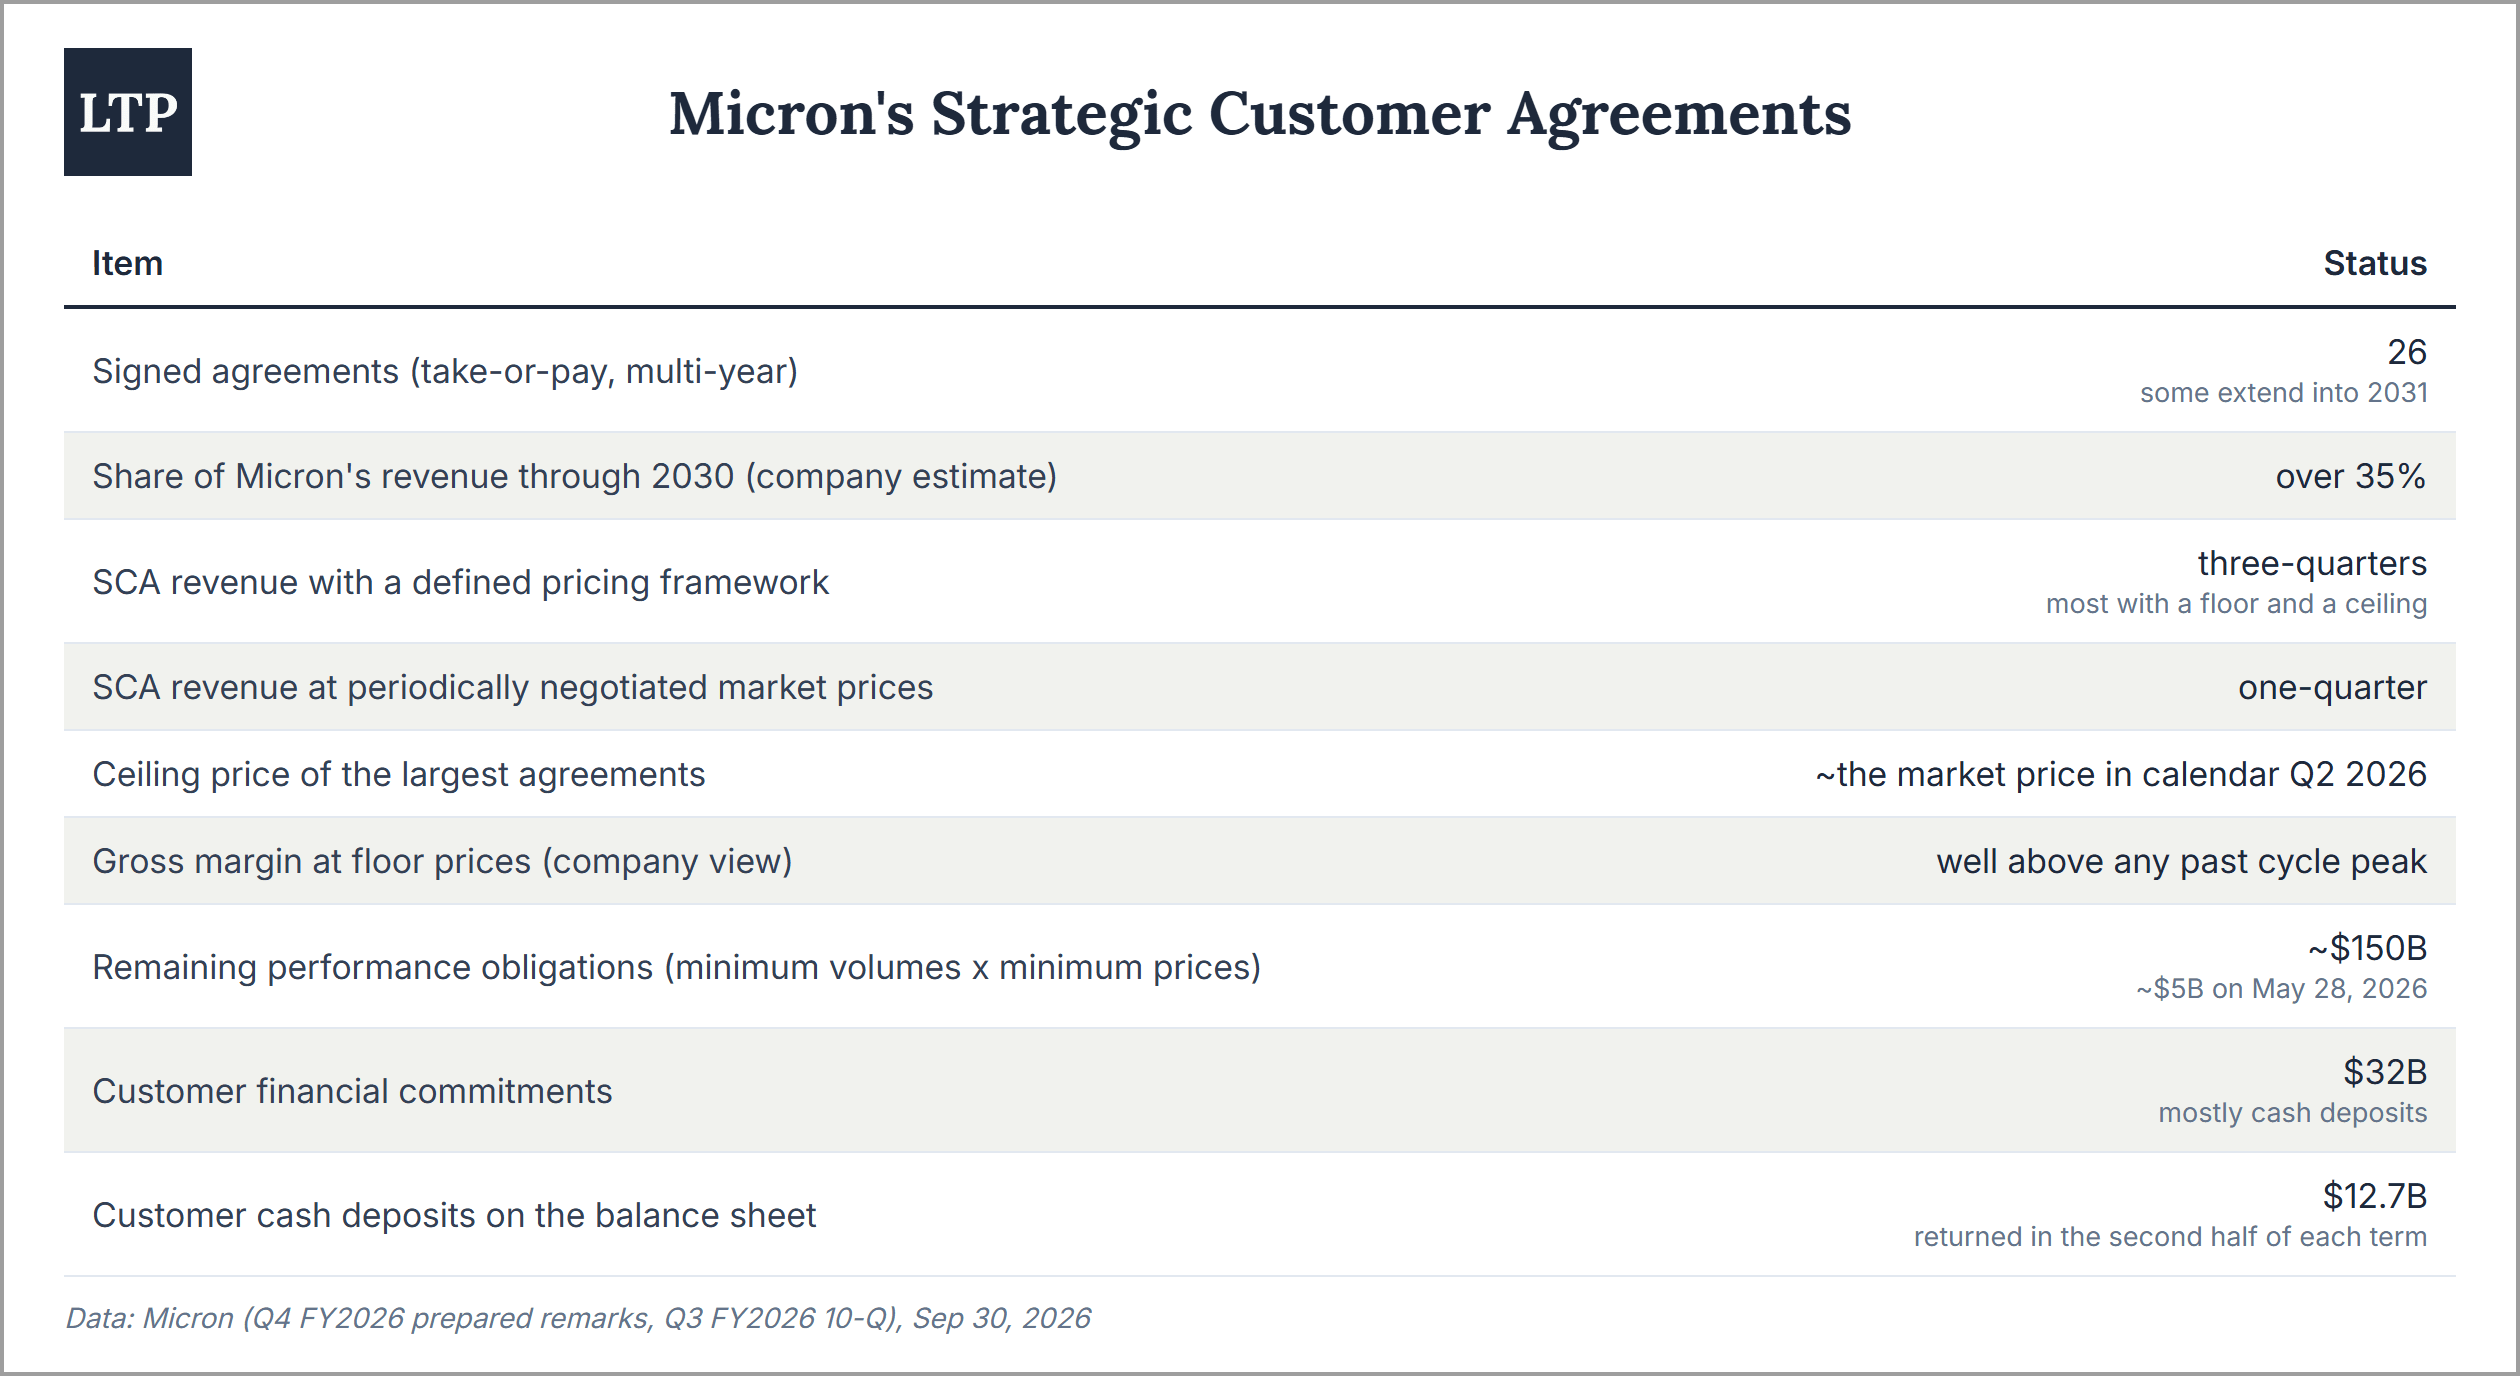
Here, I would like to put these numbers in proportion. 35% of revenue times three-quarters is ~26% of revenue through 2030 at a defined price. The other ~74% is sold at market prices. And $150B of RPO spread over the contracts until 2030-2031 is ~$29-35B a year, or 10-13% of the FY2027 consensus revenue. There is also a cost. The largest agreements have a ceiling price close to the market price in calendar Q2 2026. Counterpoint notes that SK hynix signed long-term agreements earlier than its competitors and lost DRAM share in a rising market, partly because its prices were fixed below current levels. The contracts protect the floor, and they also limit the upside.
HBM: price up, share down. Micron's HBM revenue grew faster than total revenue in Q4. The company has agreed on the vast majority of its calendar 2027 HBM supply "with significant price increases" and expects HBM demand to grow faster than conventional DRAM through 2028. At the same time, its HBM share decreased to 18% in Q2 2026, while Samsung reached 33%. In my view, Micron chooses margin over share in HBM for now.
Storage for AI inference. Data center SSD revenue was nearly $10B in Q4, more than 10x the year-ago quarter and over two-thirds of NAND revenue. AI models now keep part of their working data (the KV cache) on fast SSDs, and Micron expects its fifth year in a row of record share in data center SSDs. It is also NAND, the product where TrendForce expects prices to weaken first.
Cleanrooms first, equipment later. Net capex was $27.4B in FY2026, 20.5% of revenue against 36.9% in FY2025. For FY2027, Micron guides ~$25B for the first half alone and more in the second half, so the full year will likely be above $50B. Most of the increase is construction. ID1 in Idaho starts wafer output in mid-2027, the Tongluo facility in Taiwan ships meaningful volumes in mid-2027, ID2 and the Japan expansion start in late 2028, the Singapore NAND fab in the second half of 2028, and the first New York fab in 2030. Management promises to add equipment "appropriately with our demand and the market environment". In my view, this is the right approach, and it is also exactly the supply that will decide the next downturn, since Samsung and SK hynix build at the same time.
A new structure under the CEO. In August, Manish Bhatia became President and COO, with responsibility for the operating P&L, capital investment, and pricing. Scott DeBoer became President and Chief Technology and Products Officer, and the Chief Business Officer moved to an advisory role. Sanjay Mehrotra stays as Chairman and CEO.
Capital Allocation
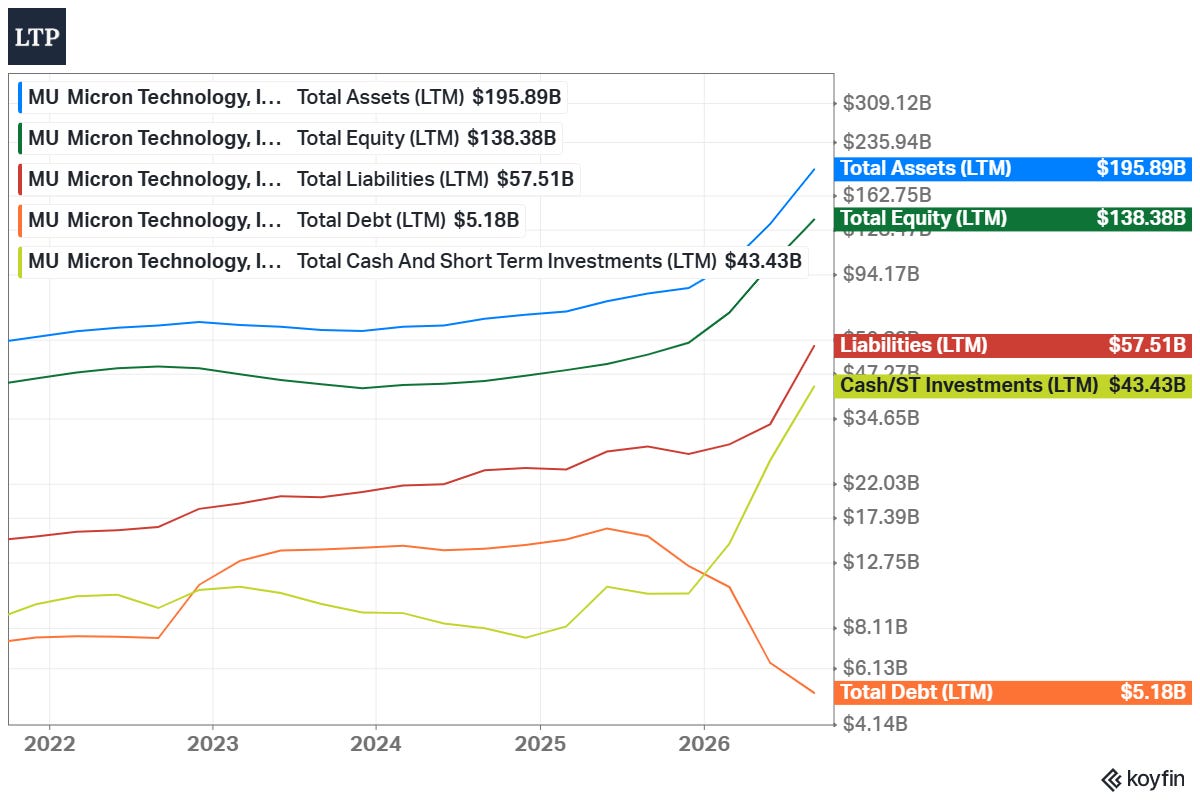
Net debt of $2.6B became net cash of $68.3B in one year. Cash and investments reached $73.5B, including $30.0B of long-term marketable investments, and debt decreased from $14.6B to $5.2B, as Micron prepaid most of its notes. All three rating agencies now rate it BBB+ or equivalent. Worth noting that $12.7B of the cash is customer deposits, which Micron returns in the second half of each contract. Without them, net cash is $55.6B, still ~4.5% of the market cap.
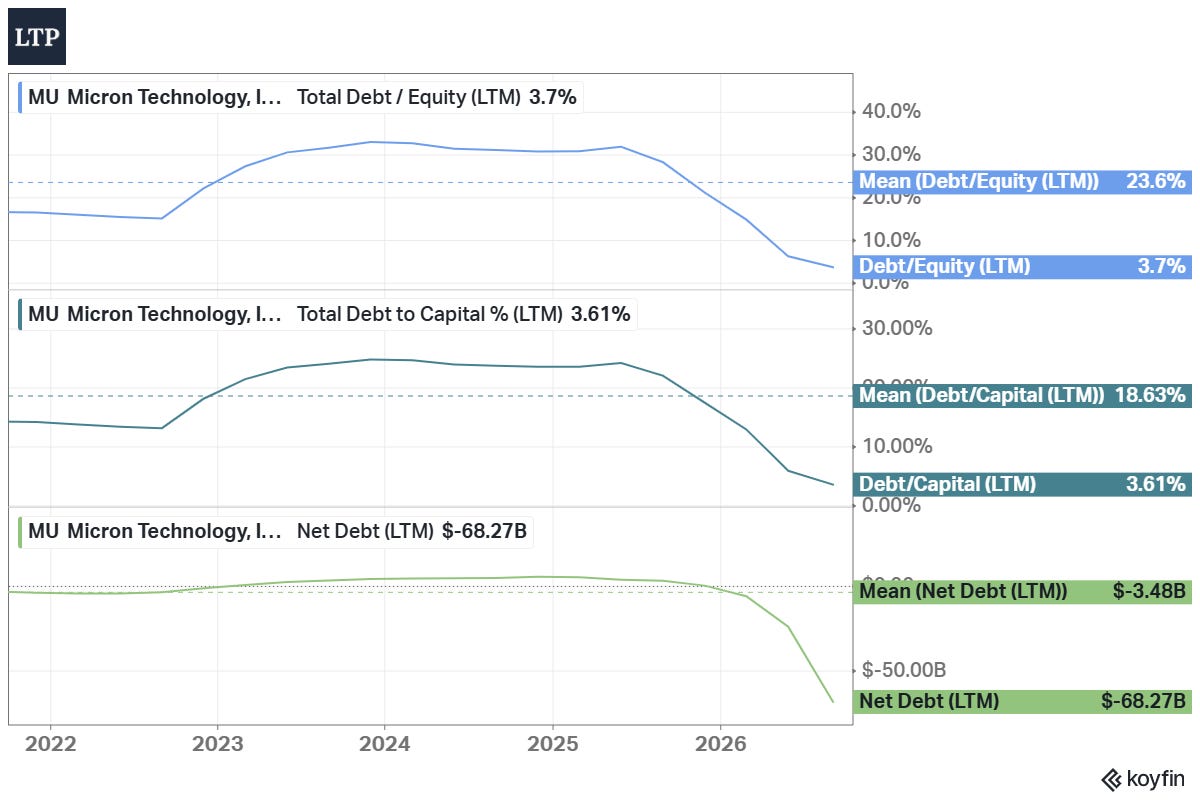
Debt/Equity is 3.7% and Debt/Capital 3.61%, against 23.6% and 18.63% 5Y means. Interest expense was $106M in FY2026 against $99.3B of GAAP operating income, and funds from operations (FFO) cover interest 846x.
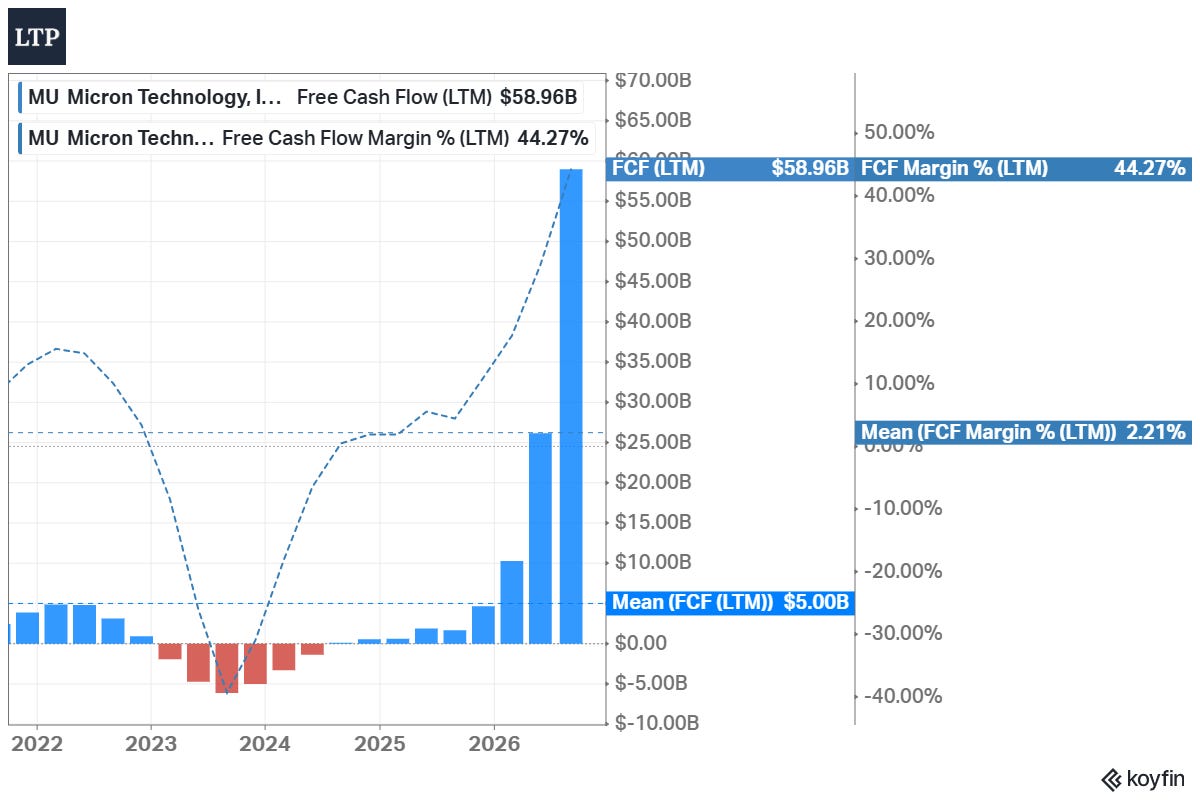
FCF reached $59.0B in FY2026, 44.27% margin, after $30.7B of gross capex. In Q4 alone, adjusted FCF was $33.2B. The CFO expects Q1 FY2027 FCF to be "significantly higher" than that, even with ~$11.5B of capex. Customer deposits ($12.3B in Q4) are reported as financing cash flow, so they are not part of FCF.
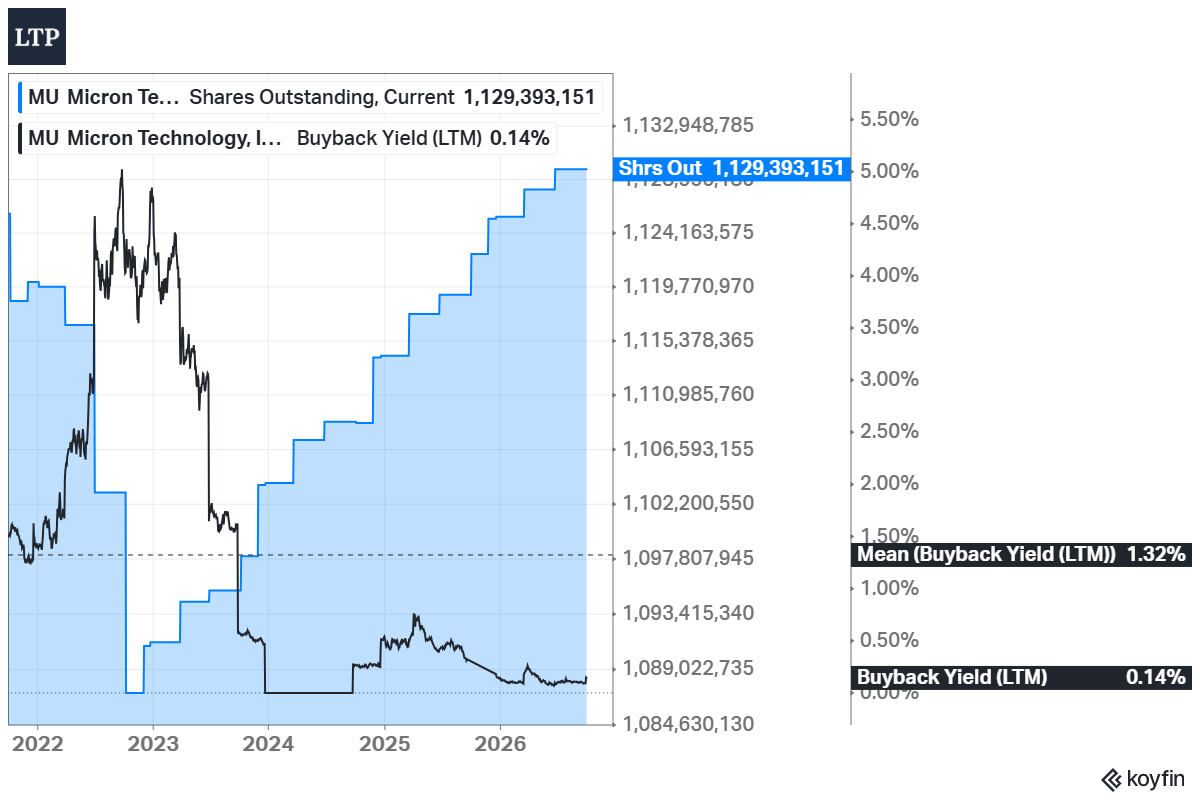
Almost none of this cash was returned yet. In FY2026, Micron bought back 2.5M shares for $650M and paid $610M of dividends, together 2% of adjusted FCF. The diluted share count increased 1.6%, and the buyback yield is 0.14% against a 1.32% 5Y mean. The reason is the CHIPS Act. Under its funding agreements from December 2024 (up to $6.1B of grants, later $6.4B with Virginia), buybacks in the first two years were limited mostly to offsetting dilution. From Dec 09, 2026, Micron plans to increase capital returns and, "over time," to return 100% of excess cash. Only $2.2B remains under the current authorization, and the CFO said the company will seek more. The dividend is $0.15 per quarter, a 0.05% yield.
The shareholder yield is even slightly negative, -0.03%. The reason is the -0.22% debt paydown yield, which is equal to $12.7B of customer deposits minus $10.0B of debt repayments in FY2026.
In my view, the coming buybacks are the most important capital allocation decision in Micron’s history. Since repurchases started in FY2019, Micron never spent more than $2.66B on them in one year. Now it can spend tens of billions per quarter. At 9.0x book value, every dollar of buybacks is a bet that peak earnings last. The other options are limited - the same CHIPS agreements restrict special dividends until December 2029. So a slower buyback pace and more cash are the cautious choice.
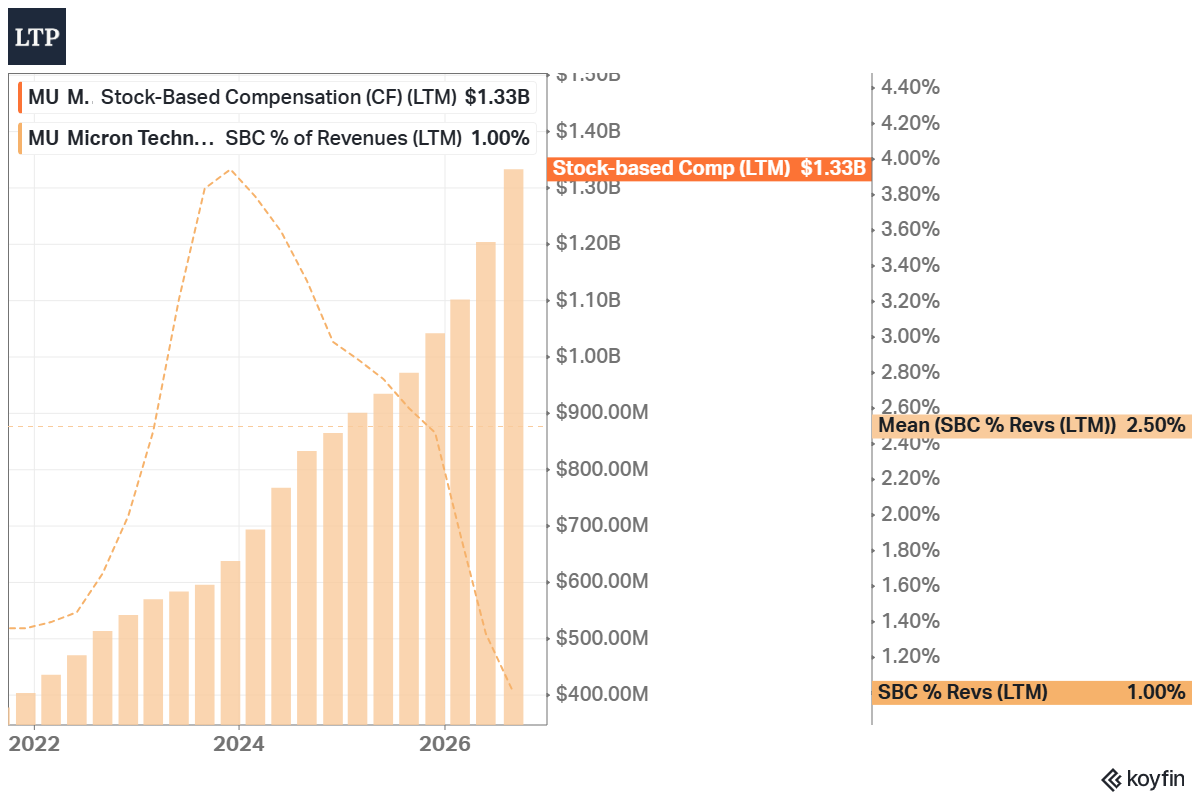
SBC was $1.33B, only 1.0% of revenue against a 2.5% 5Y mean. Costs are a different matter. Micron raised FY2026 incentive compensation for every employee and contributed $300M to community investments, so non-GAAP opex increased by $1.05B QoQ. For FY2027, it expects opex to increase another ~$2.5B (+37%), mostly R&D and incentive compensation, and ~$1B of higher costs will reduce the Q1 gross margin. In a downturn, part of these costs disappears with the bonuses, but R&D does not.
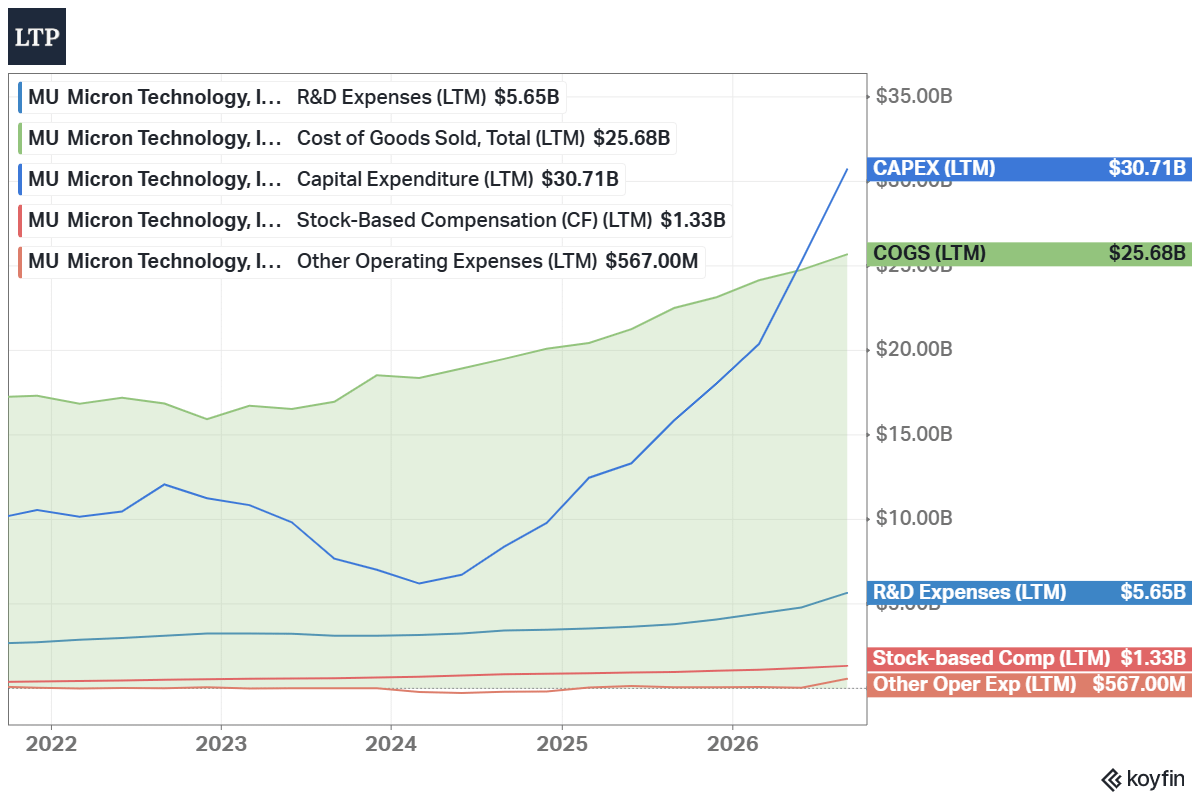
In my view, the capital allocation has been disciplined so far: debt was repaid, cash was built, and capex grew slower than revenue. The real test starts on Dec 09, when Micron decides how much of the peak cash flow to spend on its own stock at a peak price.

Advantages
Record economics with net cash. 87% gross margin in Q4, $59.0B of FCF in FY2026, and $68.3B of net cash. Even a deep downturn would not threaten the balance sheet.
Contracts that change the next downturn. 26 take-or-pay agreements with $32B of customer commitments and floor prices that, as Micron says, still give margins above any previous peak. A year ago, Micron’s remaining performance obligations were “not material”.
The data center mix. 63% of Q4 revenue came from the two data center units, and data center SSDs reached nearly $10B a quarter. AI servers are the part of demand that still grows in units, while Micron expects PC and phone units to decline, potentially by double digits, this year.
US supply. Micron is the only large DRAM producer with DRAM fabs in the US, supported by up to $6.4B of CHIPS Act grants and a 35% investment tax credit. Management lists “DRAM made in the U.S.” among its differentiation opportunities.
A huge earnings yield if the peak lasts. At 6.2x FY2027 consensus EPS, the earnings yield is 16.1%. Mizuho expects FY2027 FCF above $140B, ~11% of the market cap, and from December, Micron can return much more of it to shareholders.
Disadvantages
No proof of returns through a full cycle. From FY2016 to FY2025, capex was ~2x net income. The GAAP gross margin was negative for four quarters in a row in 2023, and GAAP EPS fell 79% from FY2018 to FY2020.
Supply is coming from everyone at once. Micron’s FY2027 capex will likely be above $50B, and TrendForce notes that all major DRAM suppliers have started expansion plans. It expects new DRAM output to become substantial in 2028 and NAND supply to become looser already in the second half of 2027.
Customers push back. By TrendForce’s estimate, memory will take 68% of large cloud companies’ capex in 2027; some of them already have negative FCF, and NVIDIA is evaluating less HBM per chip. Prices that are this high encourage customers to use less memory.
Lower share in HBM. Micron’s HBM share decreased from 21% to 18% in one quarter, while Samsung’s increased from 21% to 33%. In HBM, the most expensive memory product, Micron is third.
A peak valuation on book value. MU trades at 9.0x book value against a 3.3x 5Y mean. This summer, it fell 39% in 34 days, from $1,213.56 to $739.00, without any decline in earnings. The CEO sold shares every month from May to August, other executives sold too, and there were no insider buys.
What the bears get right: this upcycle is driven by price, and the price increases are slowing. Management itself expects "a more moderate rate of price increases" after Q1, and TrendForce expects conventional DRAM contract price growth to slow to 13-18% QoQ in Q3. In the last two cycles, the stock peaked before earnings: in 2018, MU peaked in May, three months before the quarter with the record gross margin ended, and in 2022, it peaked in January, before the record revenue quarter that ended in June. If FY2032 EPS ends up 50% below the FY2027 consensus, my model gives $301 at 6x and $602 even at 12x. As I see it, the main risk is not that AI demand disappears, but that supply catches up in 2028 while the price is still set for peak earnings. A small position is the only protection I see against being wrong in either direction.
Competitors
I compare Micron with 4 listed memory competitors. Samsung Electronics (SSNLF) is the DRAM leader with 39.4%, and it also sells phones, TVs, and foundry services. SK hynix (SKHY) is the HBM leader with 50%. Sandisk (SNDK) and Kioxia (KXIAY) are NAND companies, so they compete only with Micron’s storage business. CXMT is the fastest-growing DRAM producer, but I treat it as a risk for the others, not as an investment alternative.
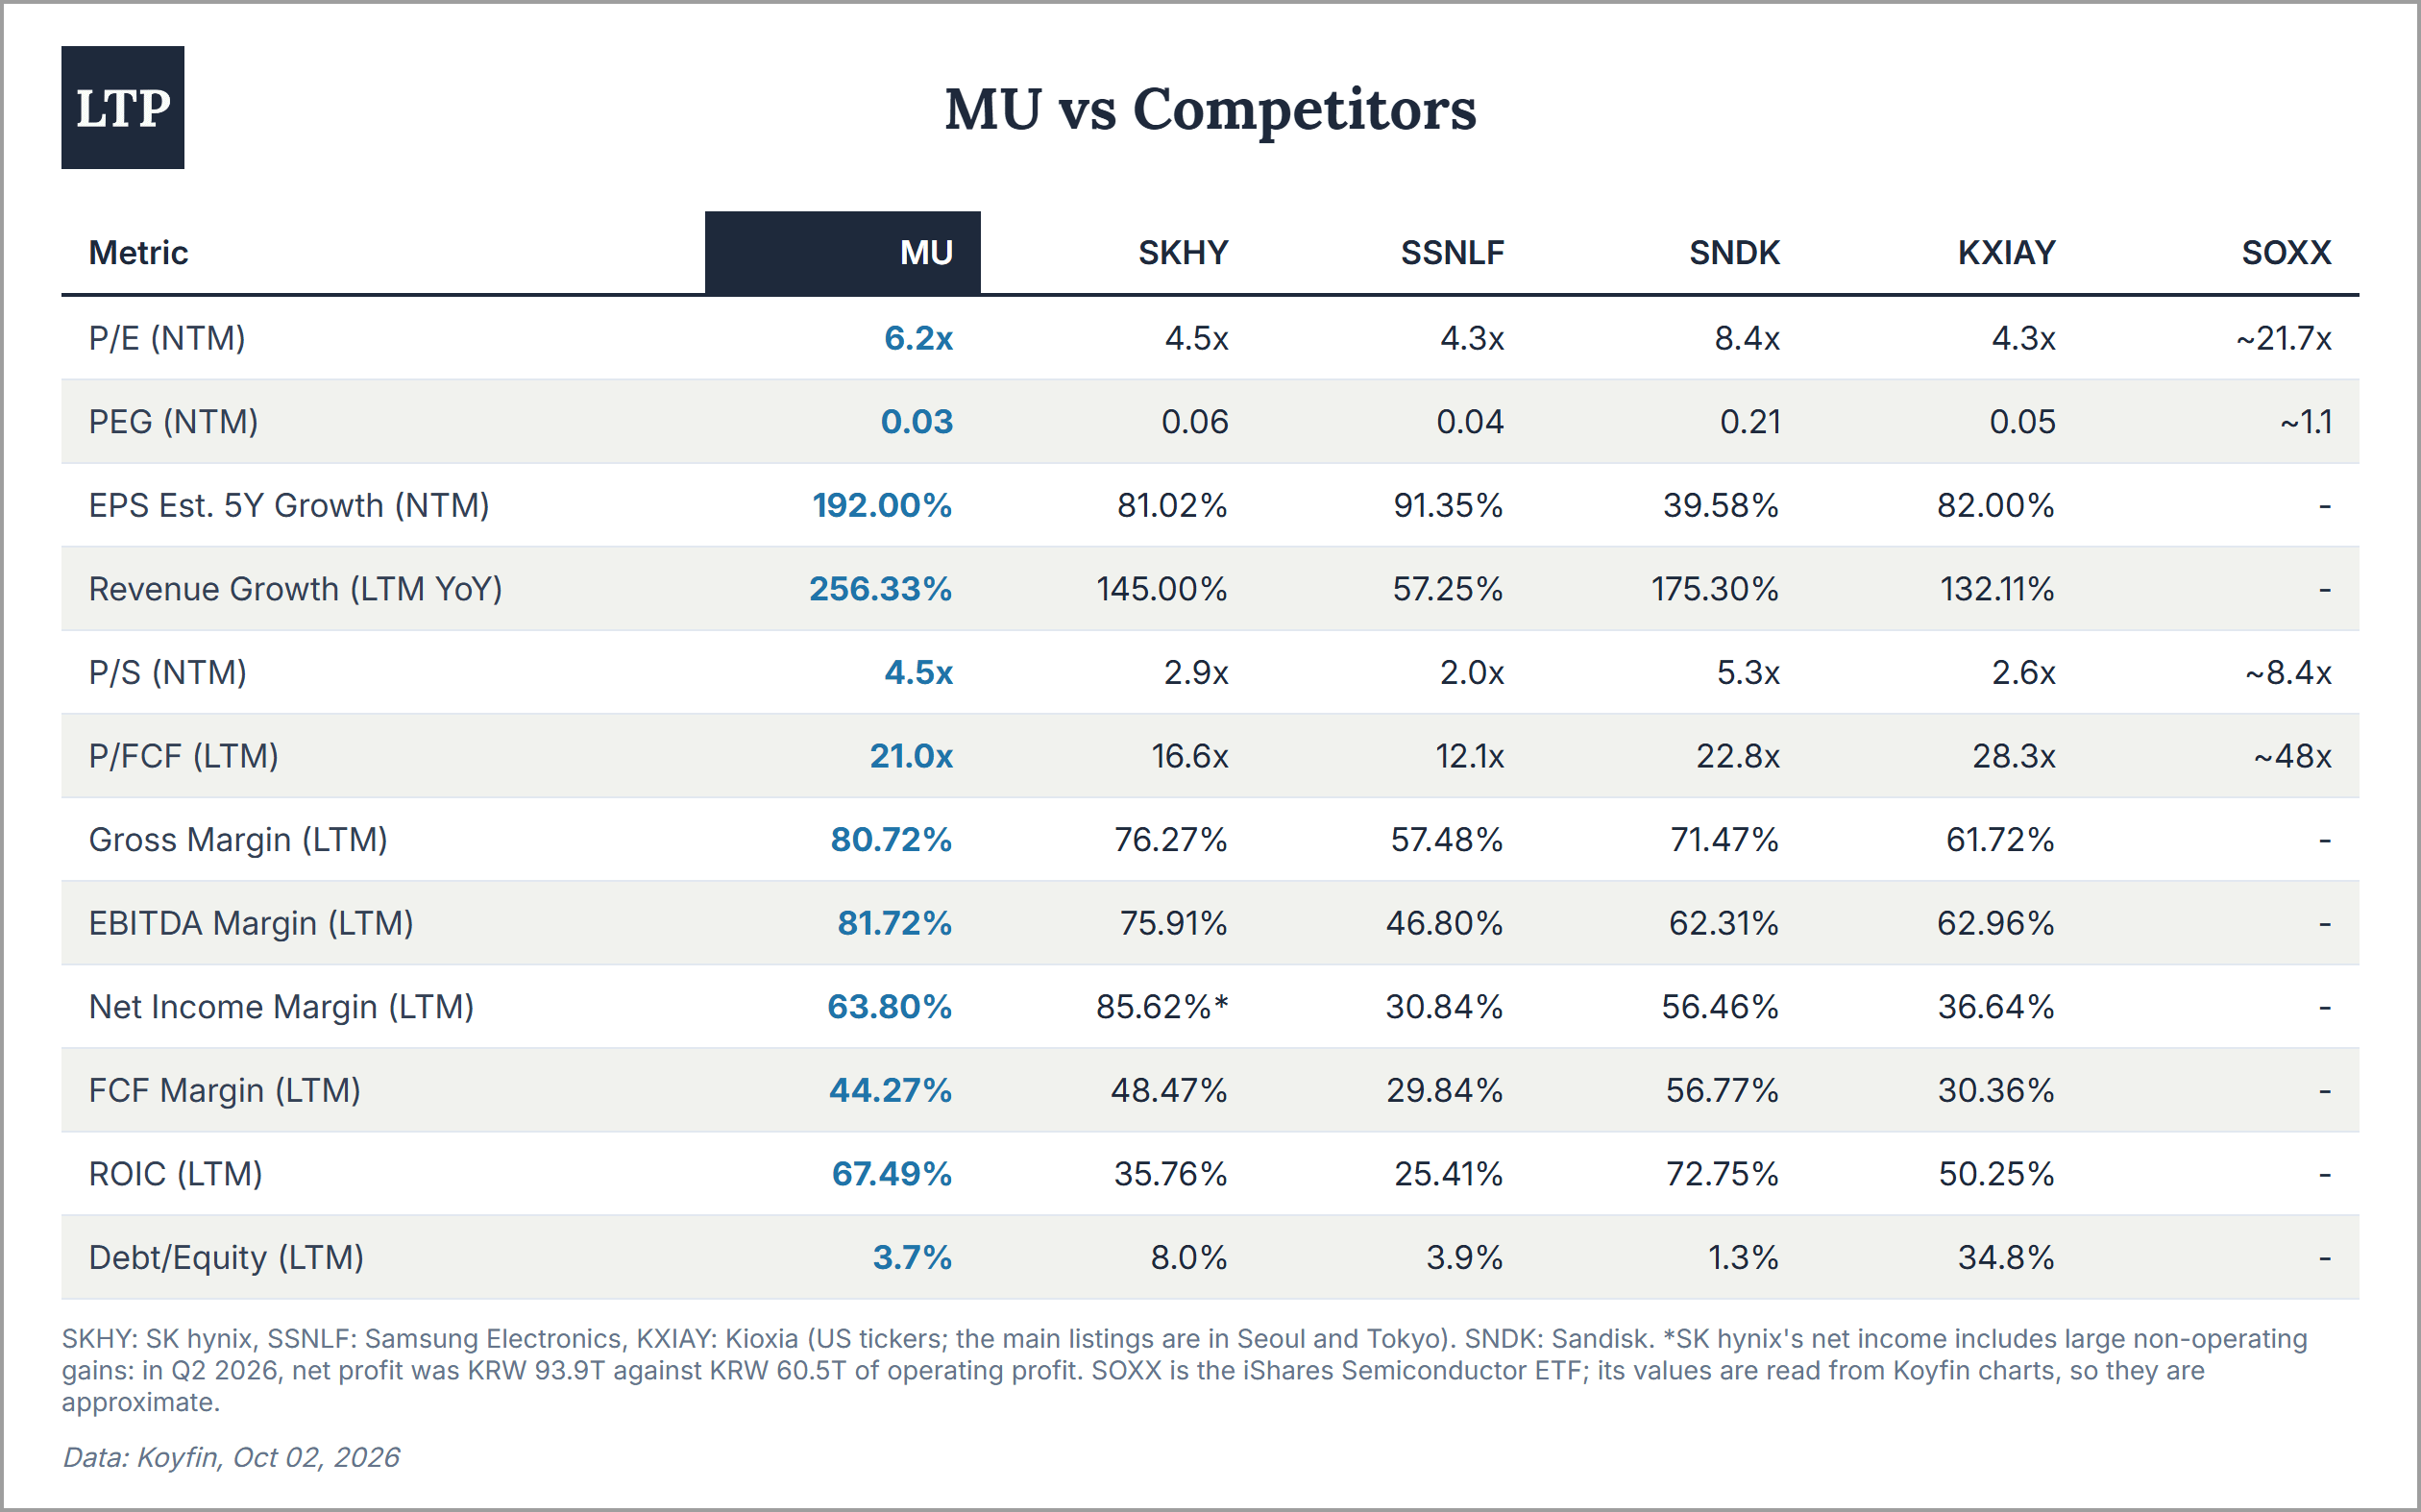
The market prices the whole group as if the peak is near. The forward P/E is 4.3x for SSNLF and KXIAY, 4.5x for SKHY, 6.2x for MU, and 8.4x for SNDK, against ~21.7x for the iShares Semiconductor ETF (SOXX). Every PEG ratio in the group is 0.21 or lower. In other words, the market applies the same rule to all memory producers - these earnings are not normal. Within the group, MU is the second most expensive on P/E and P/S, after SNDK.
On gross margin and ROIC, Micron is the best of the three DRAM producers. Its LTM gross margin is 80.72% against 76.27% for SK hynix and 57.48% for Samsung, and its ROIC is 67.49% against 35.76% and 25.41%. Only on FCF margin is SK hynix ahead, at 48.47% against 44.27%. Samsung’s numbers include phones and foundry, so they understate its memory business. Its chip division earned KRW 89.2T of operating profit on KRW 127.5T of revenue in Q2 2026, a 70% margin, and this division also includes foundry and chip design. SK hynix reported a 76% operating margin for Q2 2026 and ~10 long-term agreements with key customers. Its net margin is above its EBITDA margin only because of large non-operating gains. Sandisk leads the group in ROIC (72.75%) and in FCF margin (56.77%).
SK hynix is the next-best alternative, as I see it. The HBM leader with a slightly lower gross margin, and SKHY trades at 4.5x forward earnings against 6.2x for MU. Micron’s advantages over it are higher ROIC, US fabs, and a US primary listing. At the same time, SK hynix signed its long-term agreements earlier, and as Counterpoint notes, part of its prices were fixed below current levels. Micron’s disadvantage is its third place in HBM. None of the five escapes the price cycle, so the choice between them is less important than the decision to own memory at this point of the cycle.
Past
Q4 FY2026 (ended September 3, 14 weeks, all USD, YoY):
Revenue +379% to $54.23B (+345% on a 13-week basis); +31% QoQ
DRAM +343% to $39.77B; NAND +526% to $14.10B
Non-GAAP gross margin 87.0% against 45.7% a year ago; operating margin 82.3%
Non-GAAP EPS $33.42 against $3.03 a year ago; GAAP EPS $32.87
Operating cash flow $43.97B, adjusted FCF $33.20B, customer deposits received $12.3B
FY2026: revenue $133.19B (+256%), non-GAAP EPS $75.52 (+811%), GAAP net income $84.97B, LTM ROIC 67.49%
Why did MU barely move after such a report? Revenue was 8.5% above the midpoint of the company’s own guidance and ~7% above consensus, and EPS was 5-7% above consensus, depending on the source. The Q1 revenue guidance was ~9% above consensus, and EPS guidance 6-9% above. At the same time, MU fell 0.8% after hours (to $1,056.75), and on Oct 01, it closed only 3.0% higher (at $1,097.39). The reasons, ranked by importance:
It was already in the price. MU rose 15% in the two weeks before the report, from $926.55 on Sep 16 to $1,065.11.
Capex. ~$25B in the first half of FY2027 alone, and more in the second half. This is the supply that the bears wait for.
Costs. ~$1B of higher costs in Q1 (incentive compensation and startup costs), and +$2.5B of opex in FY2027. As a result, the Q1 gross margin guidance of ~86.25% is below Q4’s 87.0%.
Slower price increases. Management expects “a more moderate rate of price increases” after Q1.
The extra week. On a 13-week basis, Q4 revenue grew ~22% QoQ, not 31%.
At the same time, nothing in the report was weak. In my view, the reaction makes sense. The market no longer pays for beats in the current quarter. It pays for how long the cycle lasts, and the report did not change that question.
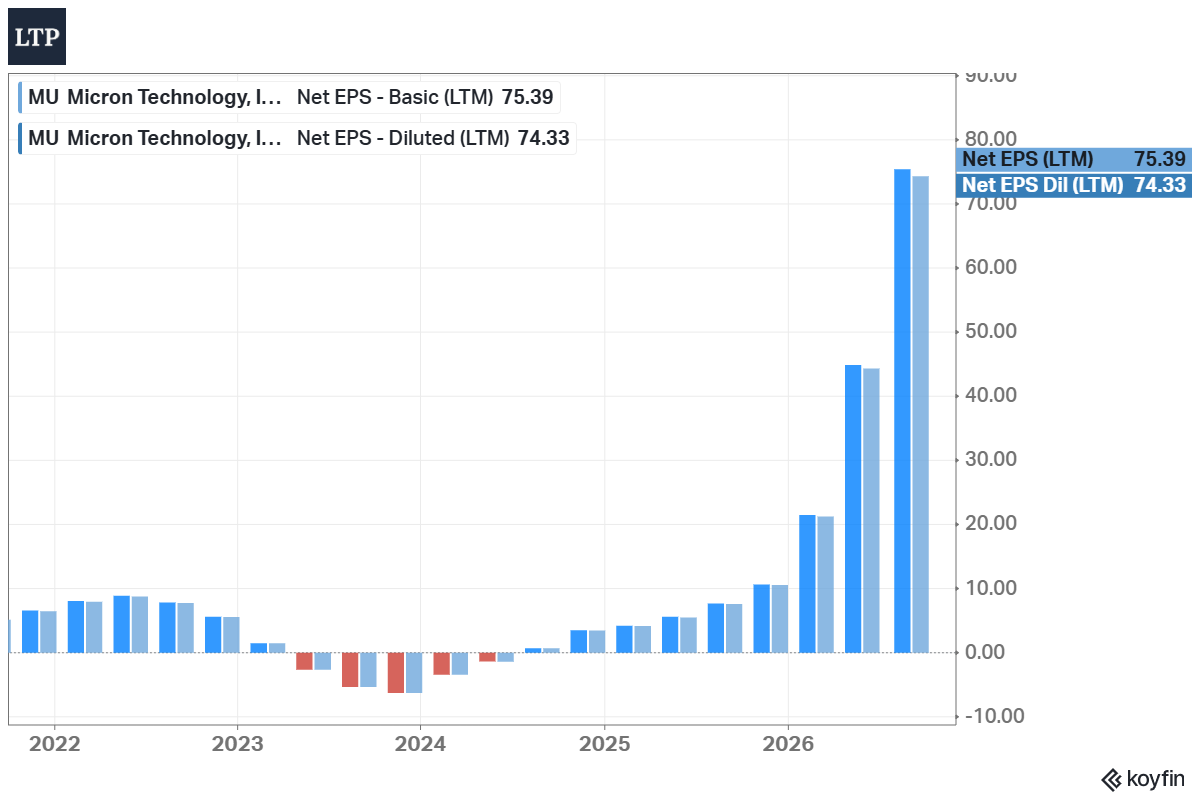
The longer history is a history of cycles. GAAP EPS was $11.51 in FY2018, $2.37 in FY2020, $7.75 in FY2022, -$5.34 in FY2023, and $74.33 in FY2026. FY2026 net income was 6.0x the previous record from FY2018. The stock followed the same pattern - in each memory downturn since 2000, MU fell ~50% or more from peak to low, and in two of them, ~90%.
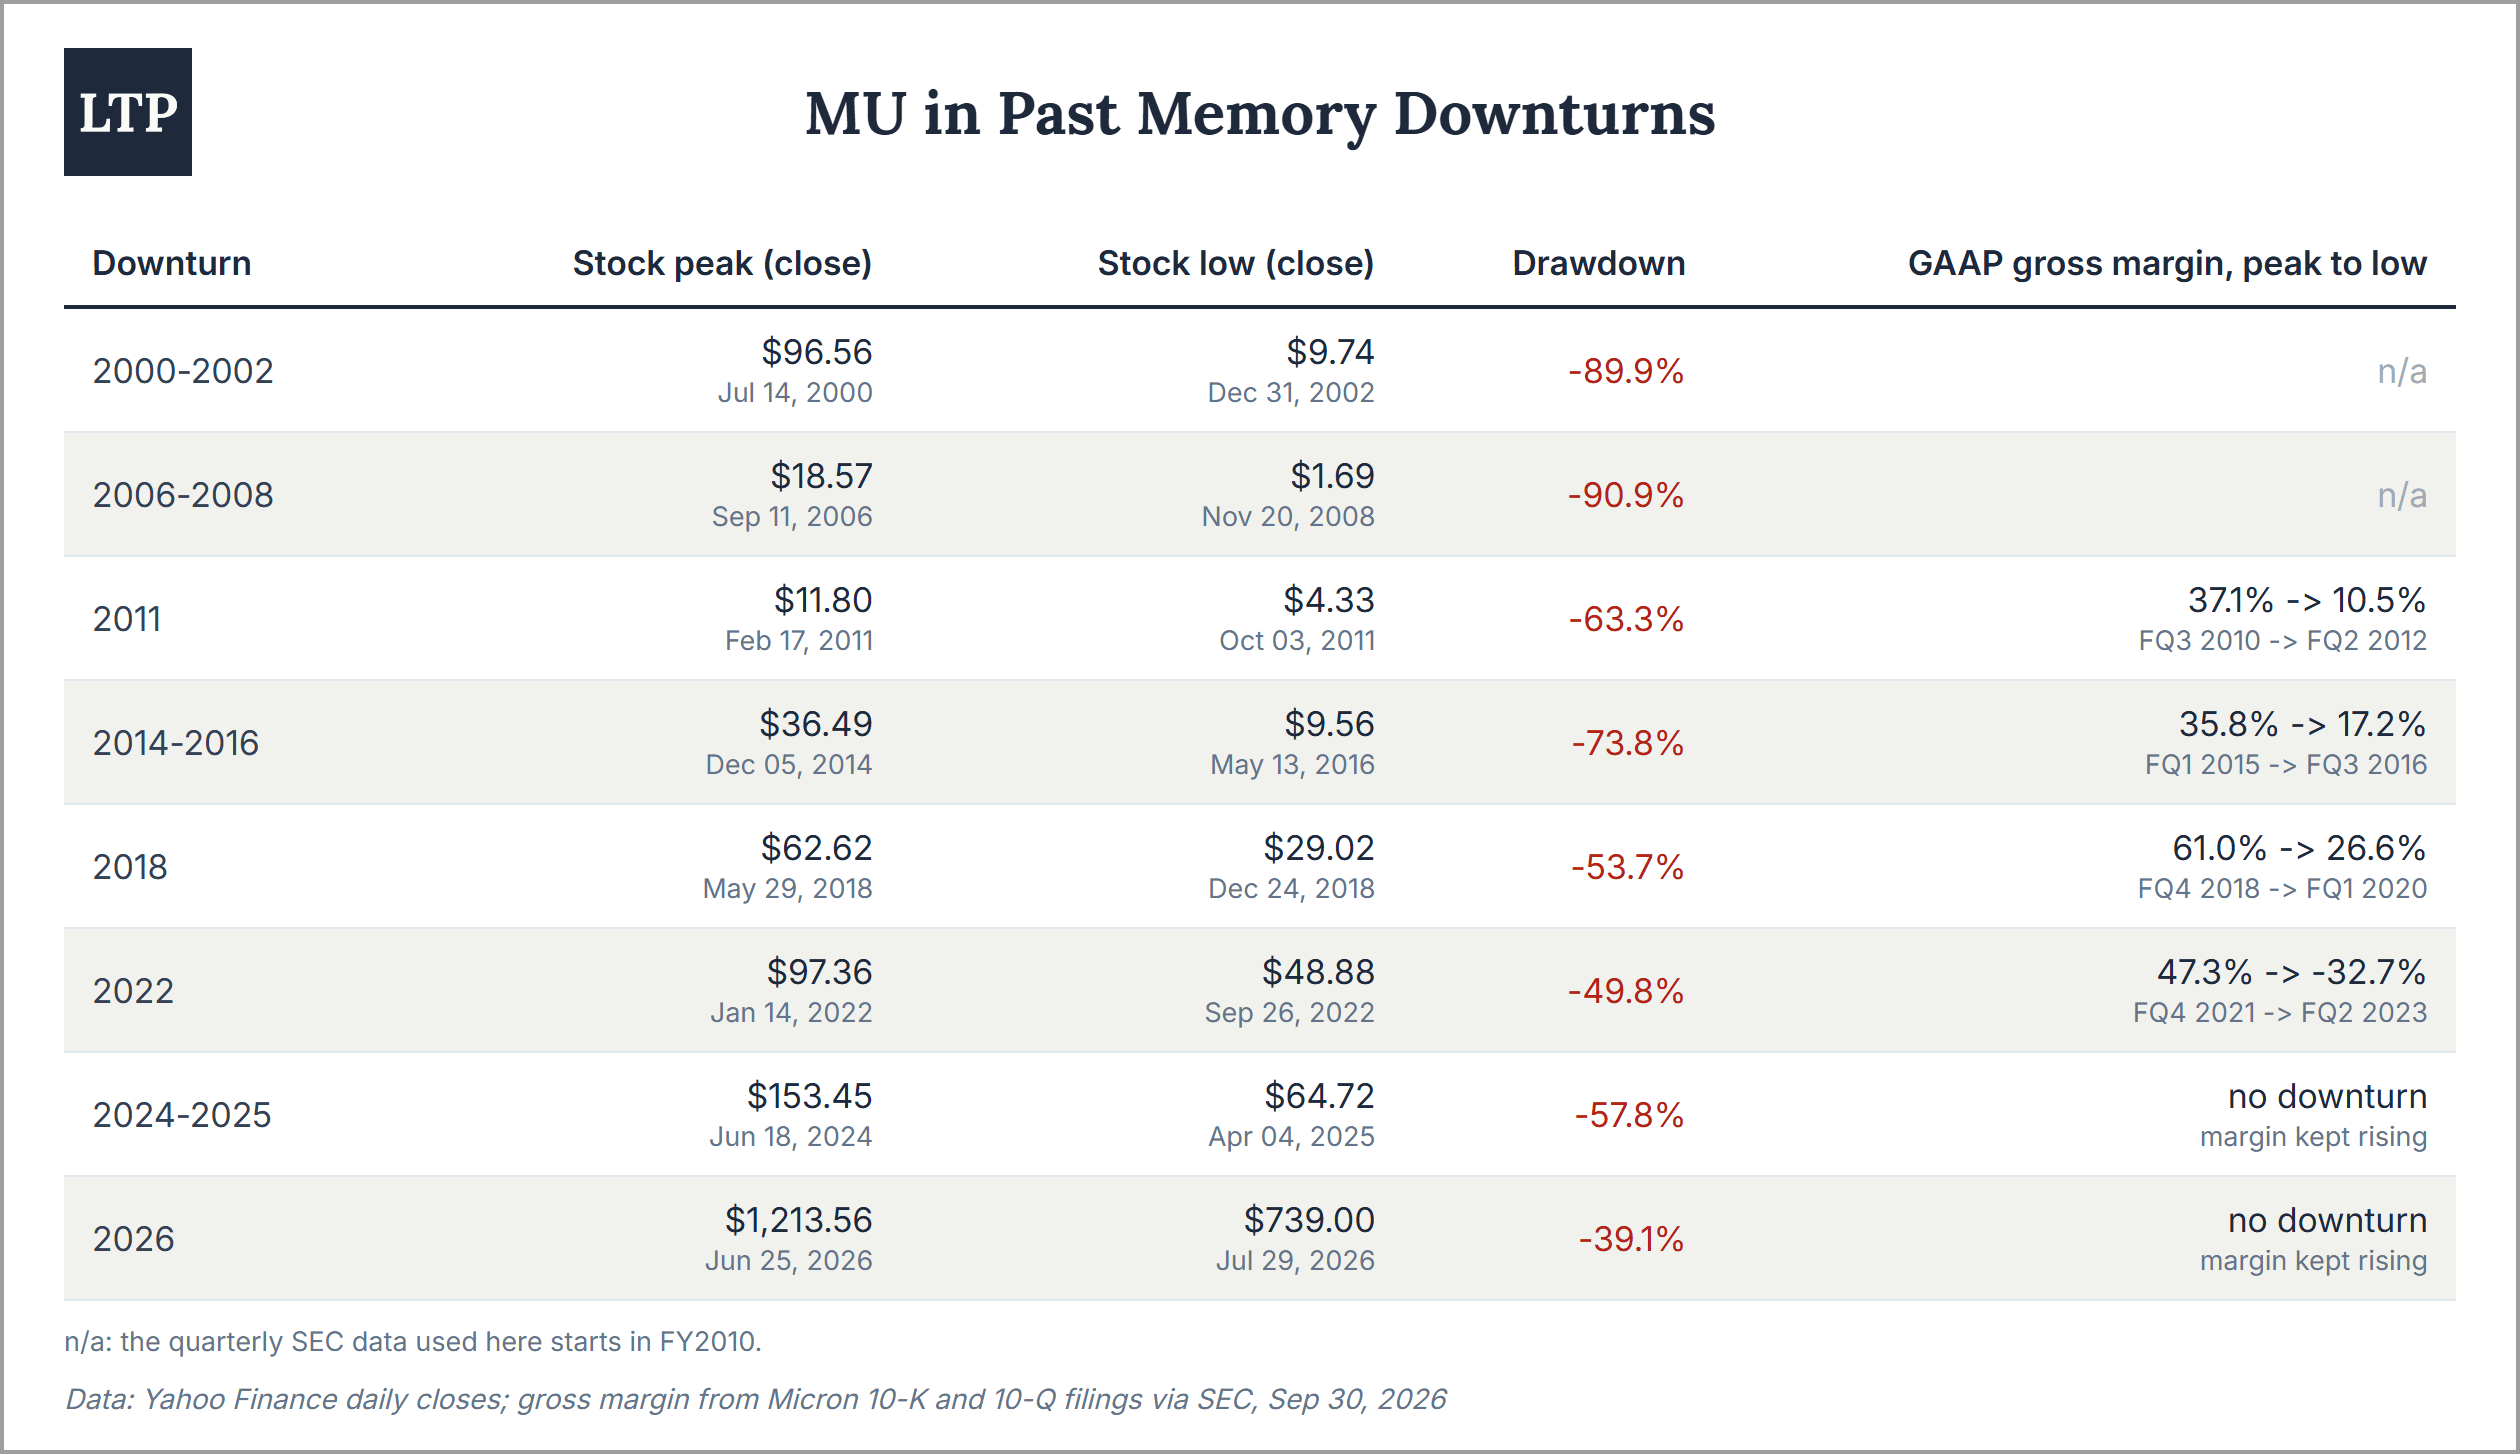
Worth noting the last two rows. In 2024-2025 and again this summer, MU fell 58% and 39% while the gross margin kept rising. The stock trades on fear of the next downturn, not only on the downturn itself.
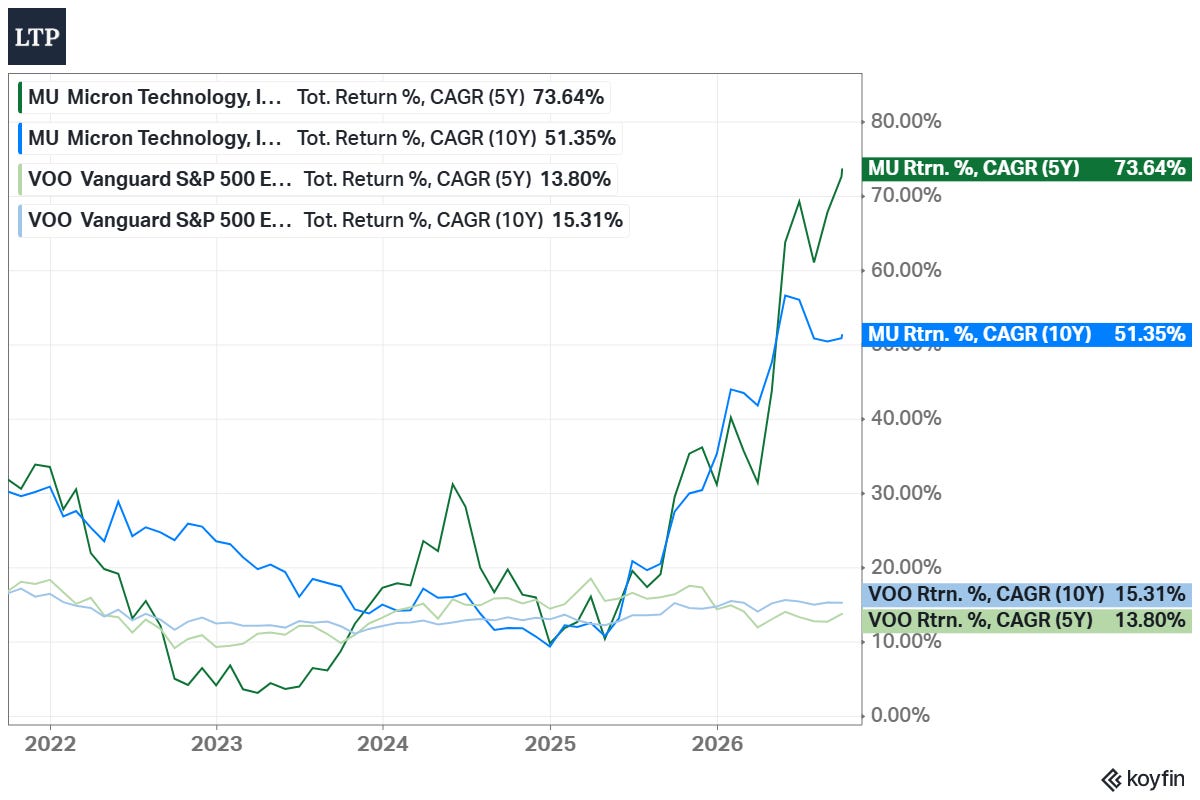
At the same time, the long-term result is excellent. With dividends, MU returned 73.64% a year over 5 years, while the S&P 500 (VOO) returned 13.80%. Over 10 years, it is 51.35% a year against 15.31%. MU is up 285% this year alone.
Future

Consensus revenue: FY2027 $274.71B (+106.26%), FY2028 $313.35B (+14.07%), FY2029 $317.34B (+1.27%)
Consensus EPS: $176.69 -> $205.30 -> $204.29 (FY2027-FY2029), so consensus itself expects EPS to stop growing in FY2029
Revisions: FY2027 EPS +10.7% in 7 days and +17.8% in 90 days (from $150.01), FY2028 EPS +14.5% in 7 days, according to Yahoo Finance data
5Y forward EPS growth estimate: 192.00% (5Y mean: 9.82%); from FY2027 to FY2029, consensus EPS grows only ~7.5% a year, so the 5Y number is not useful here, and Micron’s own history has no stable growth rate to compare with (GAAP EPS was negative in FY2023 and grew 879% in FY2026)
Analysts: 9 Strong Buy, 36 Buy, 3 Hold, 0 Sell, 1 Strong Sell (49 analysts); average target $1,520.02, 38.51% from here (the range is $361-2,200)
Company guidance: Q1 FY2027 revenue $61.5B ± $1.5B, gross margin ~86.25%, opex ~$2.06B, EPS $38.15 ± $1.00; FY2027 another record with sequential revenue growth each quarter, Q1 as the floor for the gross margin, opex +$2.5B, tax rate ~15.5%
The estimates go up faster than the targets. In July, the average target was $1,489.57. It increased only 2% since then, while the stock increased 25% and the FY2027 EPS estimate increased ~18%. In my view, analysts accept higher earnings, but not a higher multiple for them.
What has to happen for the thesis to work. FY2027 consensus EPS of $176.69 means ~$46 per quarter after the Q1 guidance of $38.15. That is ~21% above the Q1 level on average, or ~10% QoQ growth in each of the next three quarters. Management guides sequential revenue growth in every quarter of FY2027, so FY2027 looks realistic to me, but no longer conservative. The real question is FY2029-FY2032. For today’s price to make sense in my model, three things have to hold: DRAM prices stay high after new cleanrooms start output in 2028, the SCA floors work as management describes (contracted volumes keep margins above the old 61% record in the next downturn), and Micron spends the coming buybacks at prices that do not destroy value. The next checkpoints are capital returns from Dec 09, the Q1 FY2027 report in December, and the 2027 capex plans of Samsung and SK hynix in January.
Current Valuation
Current vs 5Y mean:
Price/Fwd Earnings: 6.2x vs 17.7x
Price/Fwd Sales: 4.5x vs 3.5x
Price/FCF: 21.0x vs 73.6x
Price/Book: 9.0x vs 3.3x
PEG: 0.03 vs 1.06
Forward Earnings Yield: 16.1%
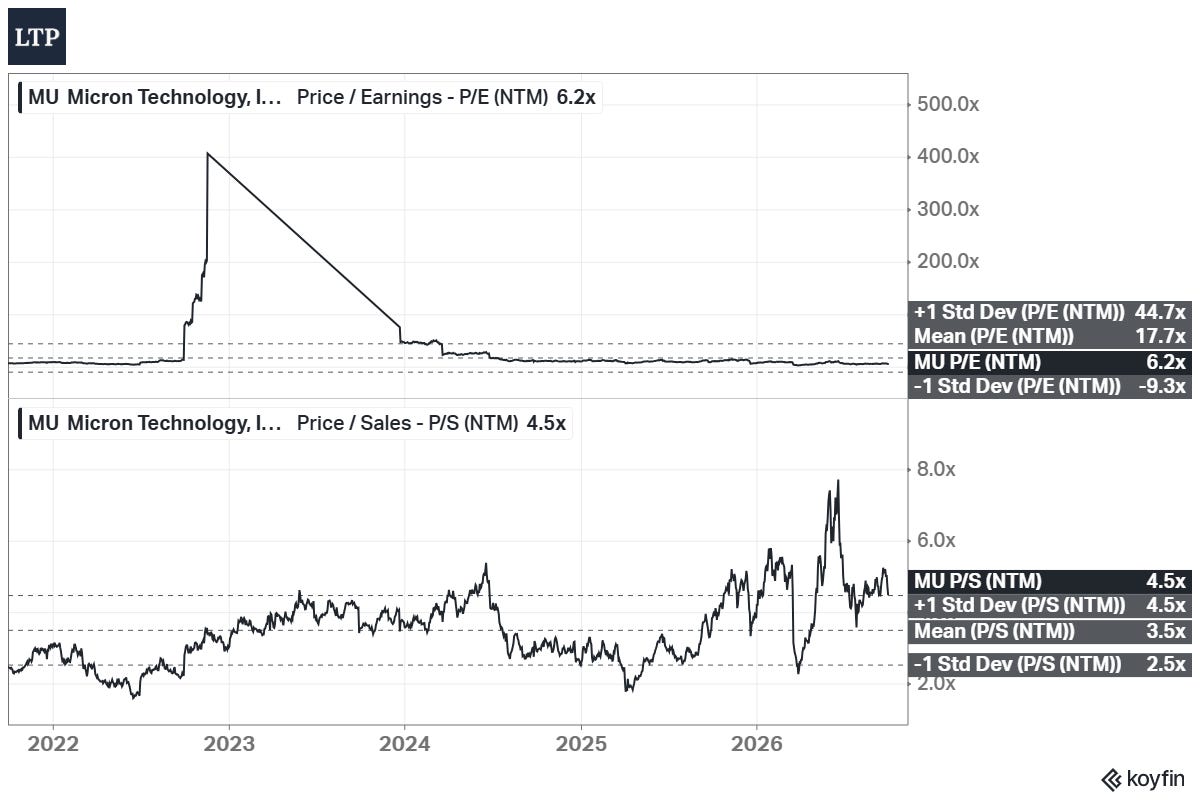
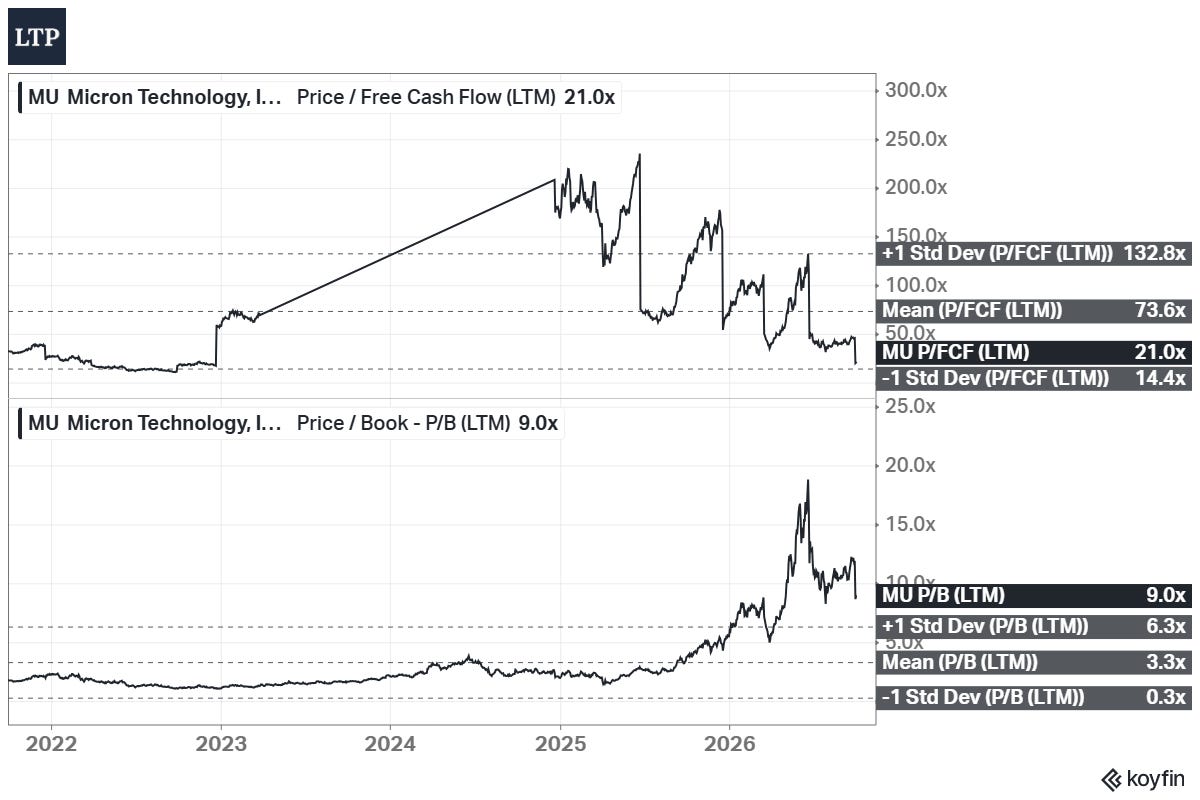
On earnings, MU is cheap. On sales and book value, it is expensive. The forward P/E of 6.2x is far below the 17.7x mean. At the same time, P/S is 4.5x, at its +1 standard deviation (SD) band and above the 3.5x mean, and P/B is 9.0x against a 3.3x mean and a 6.3x +1 SD band. To compare, memory competitors trade at 4.3-8.4x forward earnings, and SOXX at ~21.7x. For a company whose earnings move with prices, I trust sales and book multiples more at the top of a cycle, since they do not include a peak margin.
Analyst’s note:
The 5Y mean P/E includes 2023, when forward EPS was close to zero and the P/E reached ~400x, so even the -1 SD band is negative (-9.3x). For this reason, I do not use the mean anywhere in my model. Instead, I calculated MU’s trailing P/E at each earnings report over the last 10Y from SEC filings and daily closes. The median is 14.6x, excluding 6 quarters with losses and 3 with near-zero earnings. The P/FCF mean of 73.6x is distorted in the same way, since FCF was close to zero or negative in 2023-2024. Koyfin’s forward P/E uses the next 12 months, which are almost entirely FY2027. On FY2026 non-GAAP EPS, the P/E is 14.5x.
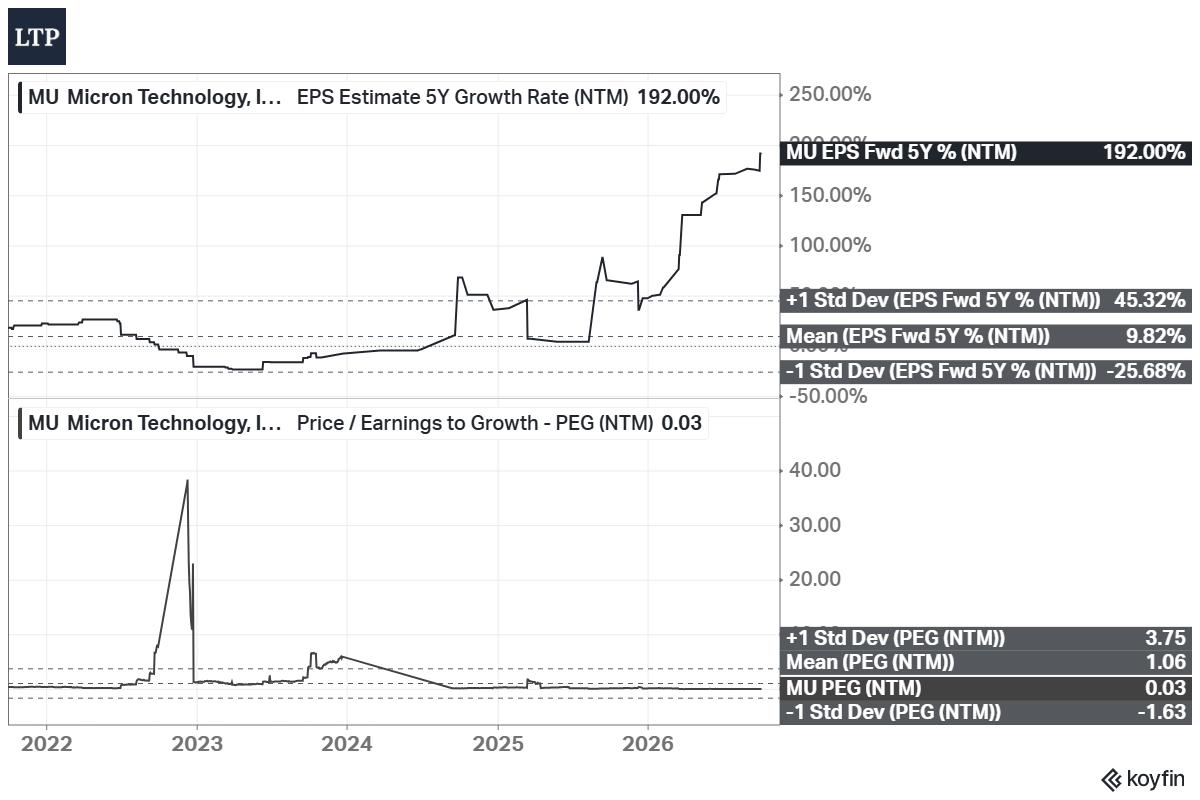
The PEG ratio says nothing here. The 5Y EPS growth estimate is 192.00% against a 9.82% mean, so the PEG of 0.03 is the result of an extreme growth number, not a sign that the stock is cheap.
What does the price already assume? I start from the FY2027 consensus EPS and require 12% a year. Then MU needs ~13% annual EPS growth for 5 years if the multiple stays at 6x. At a 9x exit, ~4% a year is enough. At 12x, EPS can even decline slightly - FY2032 EPS of ~$161 is enough. So the price does not assume more growth. It assumes that the FY2027 level of earnings, 2.3x FY2026, is roughly where Micron stays.
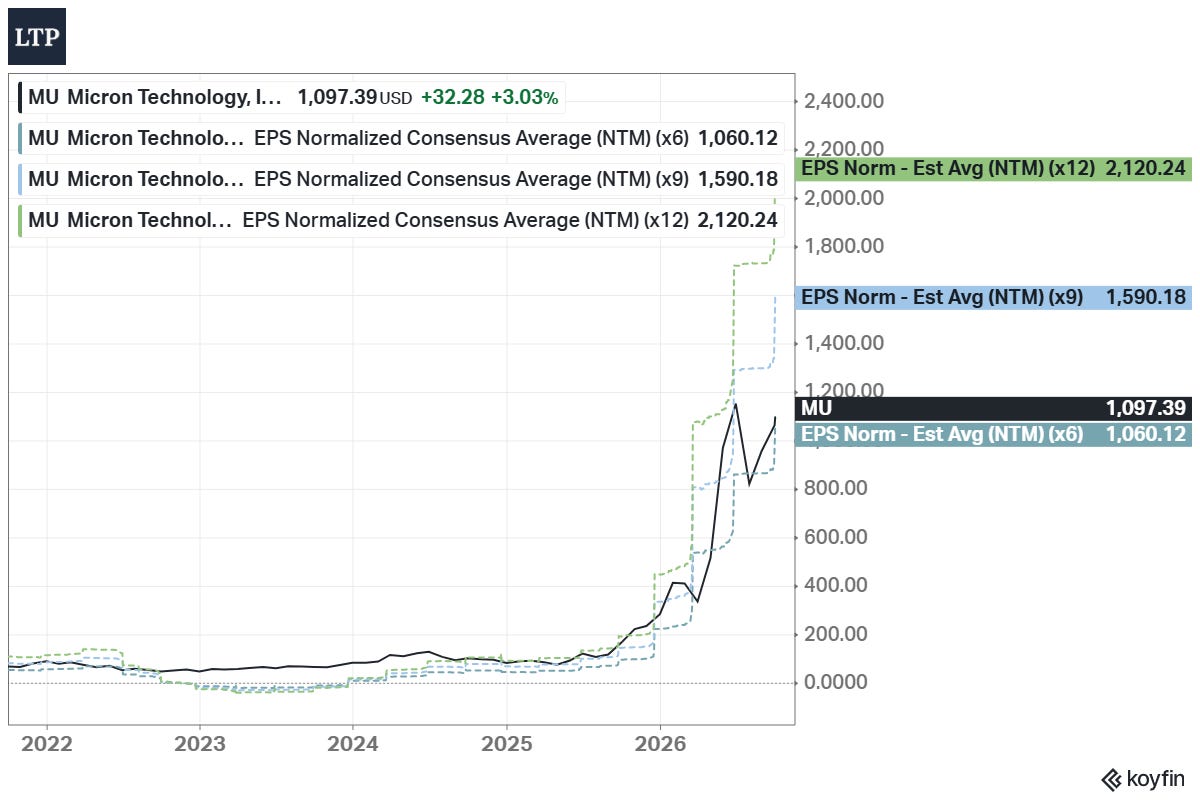
One chart frames this whole section. It compares the price with three lines: consensus forward EPS times 6x, 9x, and 12x. MU is just above the 6x line ($1,060), while 9x would mean $1,590 and 12x $2,120. In 2023, all three lines were below zero. Worth noting that the corridor applies the multiples to today’s forward EPS without discounting, so its lines are higher than my fair prices.
Fair Price
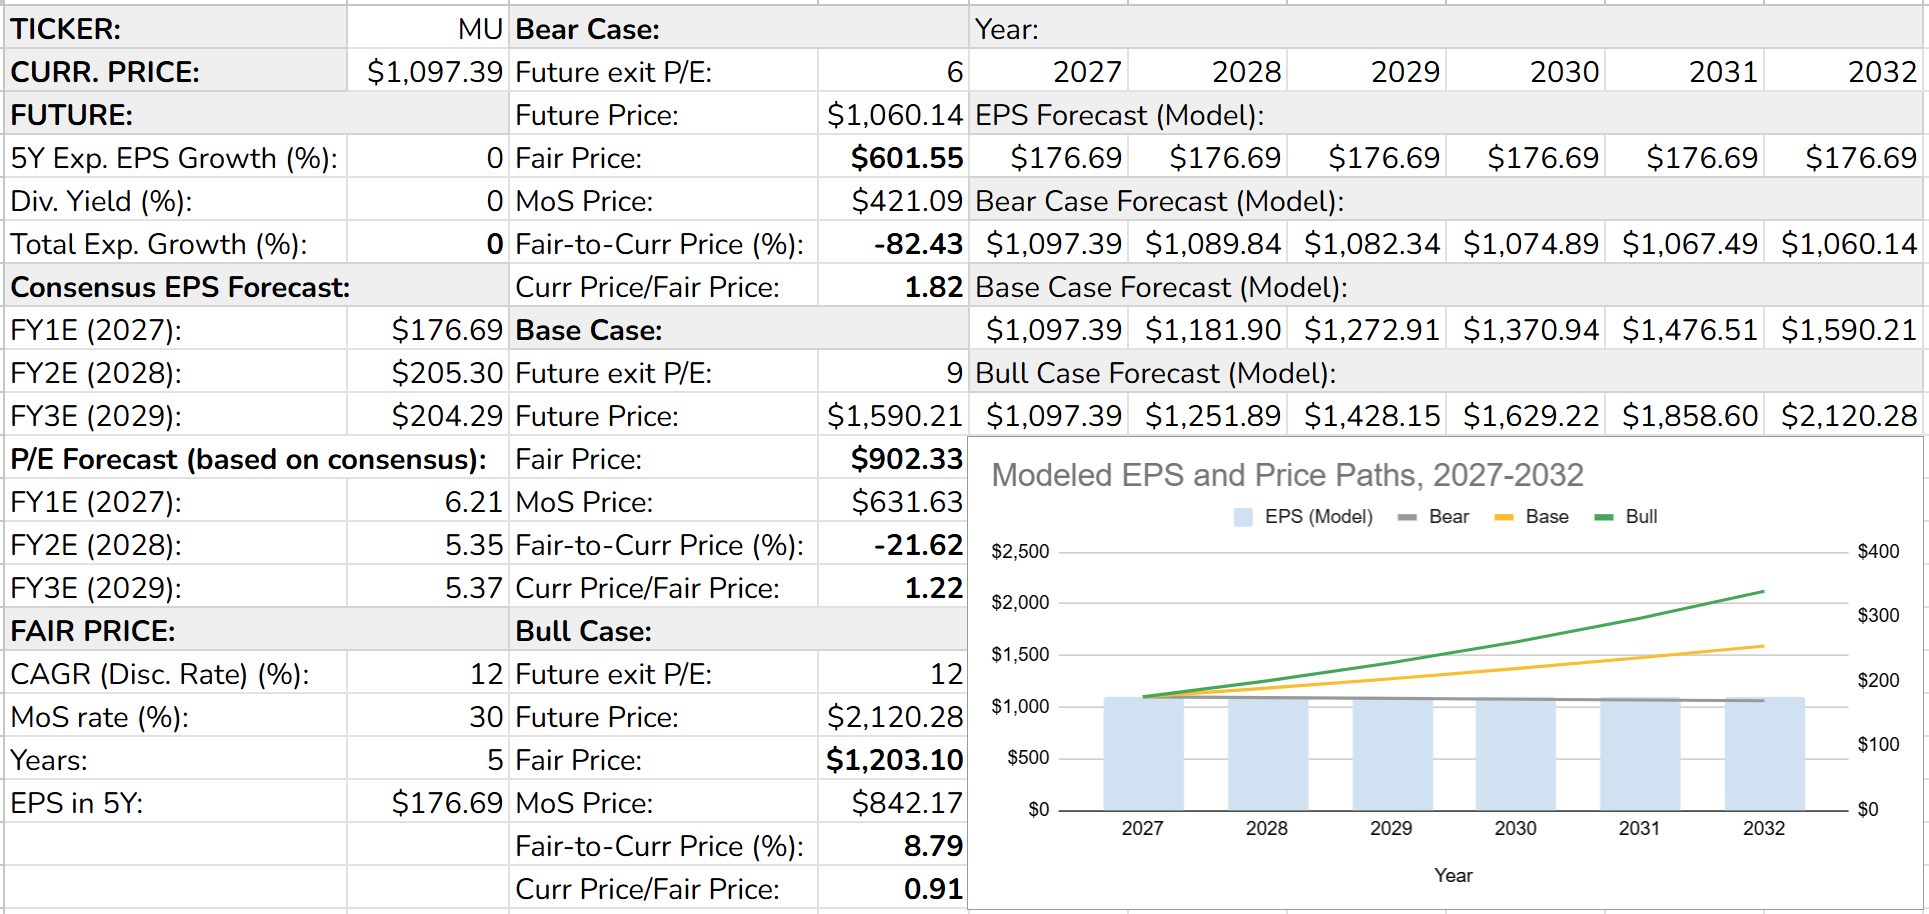
My model normally projects consensus EPS 5 years forward, with future growth capped at 20% per year. For Micron, I do not grow it at all. Starting EPS is the FY2027 consensus of $176.69, the growth rate is 0%, and EPS in FY2032 is also $176.69. The 20% cap is a ceiling, not a target, and at the top of a memory cycle, even flat earnings are an optimistic assumption.
Analyst’s note:
With the usual approach (FY2027 EPS growing at the 20% cap), FY2032 EPS would be $440, and even a 6x exit would give a fair price of $1,497. That is exactly the trap I described in July - the model would call MU cheap at the peak. In July, I used book value for the zone ($180-270, at 2-3x book). Book value per share has increased 37% since then, to $122, and from now on I prefer an earnings model with flat EPS, since it shows directly what the price assumes about the peak.
The discount rate is 12%; the margin of safety is 30%. The exit multiples are 6x, 9x, and 12x, and since my model applies them to peak earnings, they have to be peak multiples. 6x is today’s 6.2x rounded down, and it is also MU’s trailing P/E at the last earnings peak (6.1x in July 2022). In 2018, the multiple at the earnings peak went down to 2.6x, so 6x is not the worst case. 12x is still below the 10Y median trailing P/E of 14.6x. The median includes the recovery years, when the P/E was high because earnings were low, while my model applies the multiple to peak earnings. 9x is in the middle - a market that believes the SCAs only partly. Worth noting that the 30% margin of safety has a simple meaning here - the Bear Case MoS price equals the Bear Case fair price if FY2032 EPS is 30% below the FY2027 consensus.
Bear Case (exit P/E 6x): fair price $602 - MoS price $421
Base Case (exit P/E 9x): fair price $902 - MoS price $632
Bull Case (exit P/E 12x): fair price $1,203 - MoS price $842
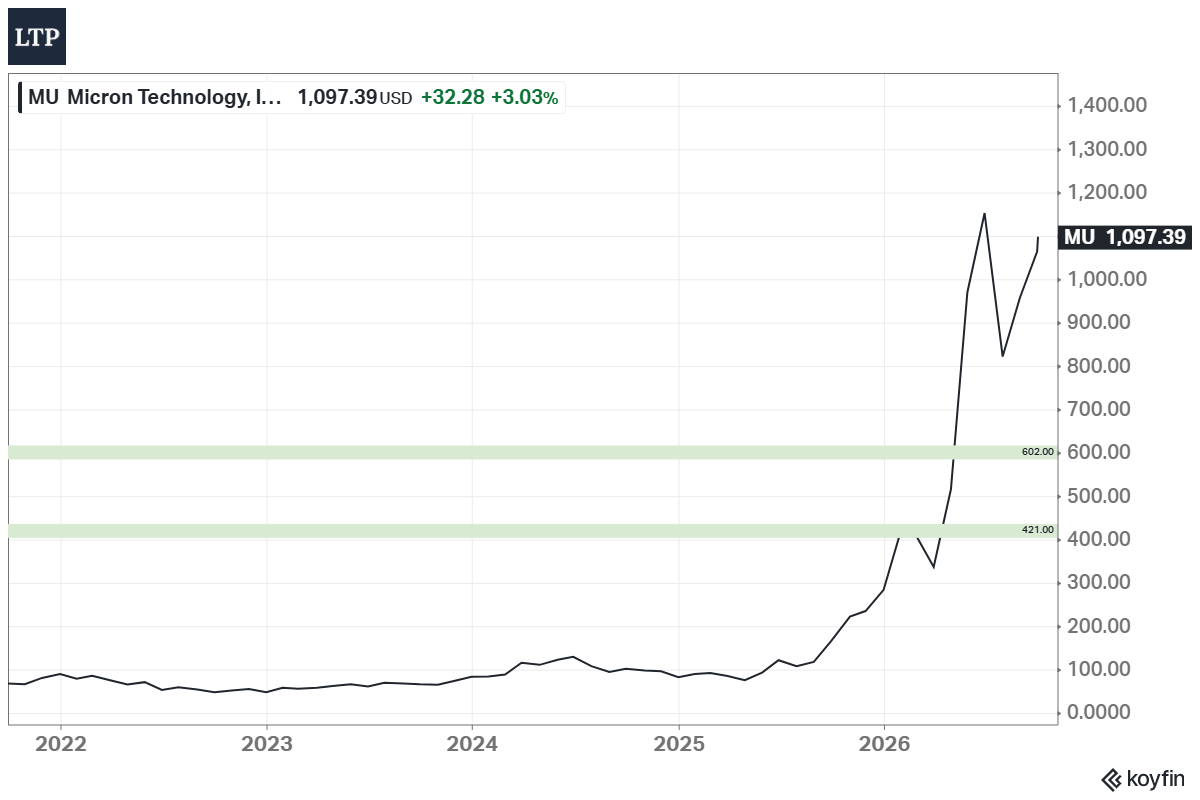
At $1,097, MU is 82% above the Bear Case fair price, 22% above the Base Case, and 9% below the Bull Case. The accumulation zone is $421-602, and MU last closed inside it on May 04, 2026, five months ago. The result depends most on the level of earnings after the peak. If FY2032 EPS is 30% below the FY2027 consensus, the fair prices decrease to $421/$632/$842. If Micron grows EPS 5% a year from that peak, they increase to $768/$1,152/$1,535, and MU would be 5% below the Base Case. Worth noting that the Bull Case of $1,203 is 21% below the average street target of $1,520. The street applies higher multiples to the peak earnings, and my model does not.
Due Diligence
Profitability (12 of 15):
Positive Gross Profit: $107.50B
Positive Operating Income: $99.34B
Positive Net Income: $84.97B
Positive FCF: $58.96B
Gross margin >= 40%: Yes (80.72%)
Net margin >= 10%: Yes (63.80%)
FCF margin >= 10%: Yes (44.27%)
Management (ROIC, ROE, ROA) >= 10%: Yes (67.49%, 88.26%, 44.56%)
Strong 3Y Revenue Growth: Yes (~105% per year, from the FY2023 low)
Revenue Growth Forecast: Yes (~34% per year to FY2029)
ROE is increasing: negative in FY2023 -> 88.26%
ROIC is increasing: negative in FY2023 -> 67.49%
Revenue surprises in the last 5Y in a row: No (a miss in Q1 FY2023)
EPS surprises in the last 5Y in a row: No (a miss in Q1 FY2023)
EPS growth YoY 5Y in a row: No (a GAAP loss in FY2023)
Financial Strength (6 of 6):
Total assets ($195.89B) exceed total liabilities ($57.51B) by 3.41x
Negative Net Debt: Yes ($68.27B of net cash)
Low Debt/Equity: 3.7% (5Y mean: 23.6%)
Debt/Capital: 3.61% (5Y mean: 18.63%)
Interest coverage (FFO): 846.0x (5Y mean: 89.8x)
Piotroski F-Score: 8 of 9 (not passed: more diluted shares YoY)
Valuation and Advantage (1 of 4):
Valuation < 5Y mean: No (P/S 4.5x vs 3.5x and P/B 9.0x vs 3.3x; the P/E and P/FCF means are distorted by the 2023 downturn)
Valuation < the industry: No (6.2x forward P/E vs 4.3-8.4x for memory competitors; SOXX ~21.7x)
Does it have a moat: No (an oligopoly, but no excess returns through the cycle)
Outperformed the S&P 500 over 5Y: Yes (73.64% vs 13.80% CAGR)
Shares (0 of 3):
Insider ownership >= 5%: No (0.24%)
Fewer shares outstanding YoY: No (1,143M vs 1,125M diluted)
Insider buys in the last 6M: No (only sales, including monthly sales by the CEO)
Price (3 of 4):
1Y price forecast > 10%: +38.51%
Next 5Y EPS growth estimate (CAGR) > 10%: Yes (192.00%)
DCF Value: ~$475 (base case: revenue growth -0.7%, net margin from 66.7% to 33.7%, 10.5% discount rate); overvalued by ~56%
Short Interest < 5%: Yes (2.60%)
Verdict
MU is not a buy for me at this price, and if it belongs in a long-term portfolio, then as a small cyclical position, not as a core holding. Micron is one of three producers that matter in DRAM. FY2026 was the best year in its history: 81% gross margin, $59.0B of FCF, and $68.3B of net cash. MU trades at 6.2x FY2027 consensus earnings, which looks cheap, but at 9.0x book value and at a price that is fair only if FY2027 earnings last for 5 years. The SCAs make the next downturn smaller, but they cover only ~26% of revenue with a defined price and cap the upside of the largest contracts. My model holds FY2027 EPS flat, uses exit multiples of 6x/9x/12x, and gives fair prices of $602-1,203 with an accumulation zone of $421-602. At $1,097, MU is 22% above the Base Case and far above the zone. As I see it, the realistic bear case is not a collapse of AI demand but a normal memory downturn after new supply arrives in 2028, with earnings falling by half and the stock falling before them. Watch DRAM contract prices, the size and price of the buybacks from Dec 09, and the 2027 capex plans of Samsung and SK hynix, and judge the thesis on gross margin in the first quarter with falling prices, not on the record quarters.
One-Pager
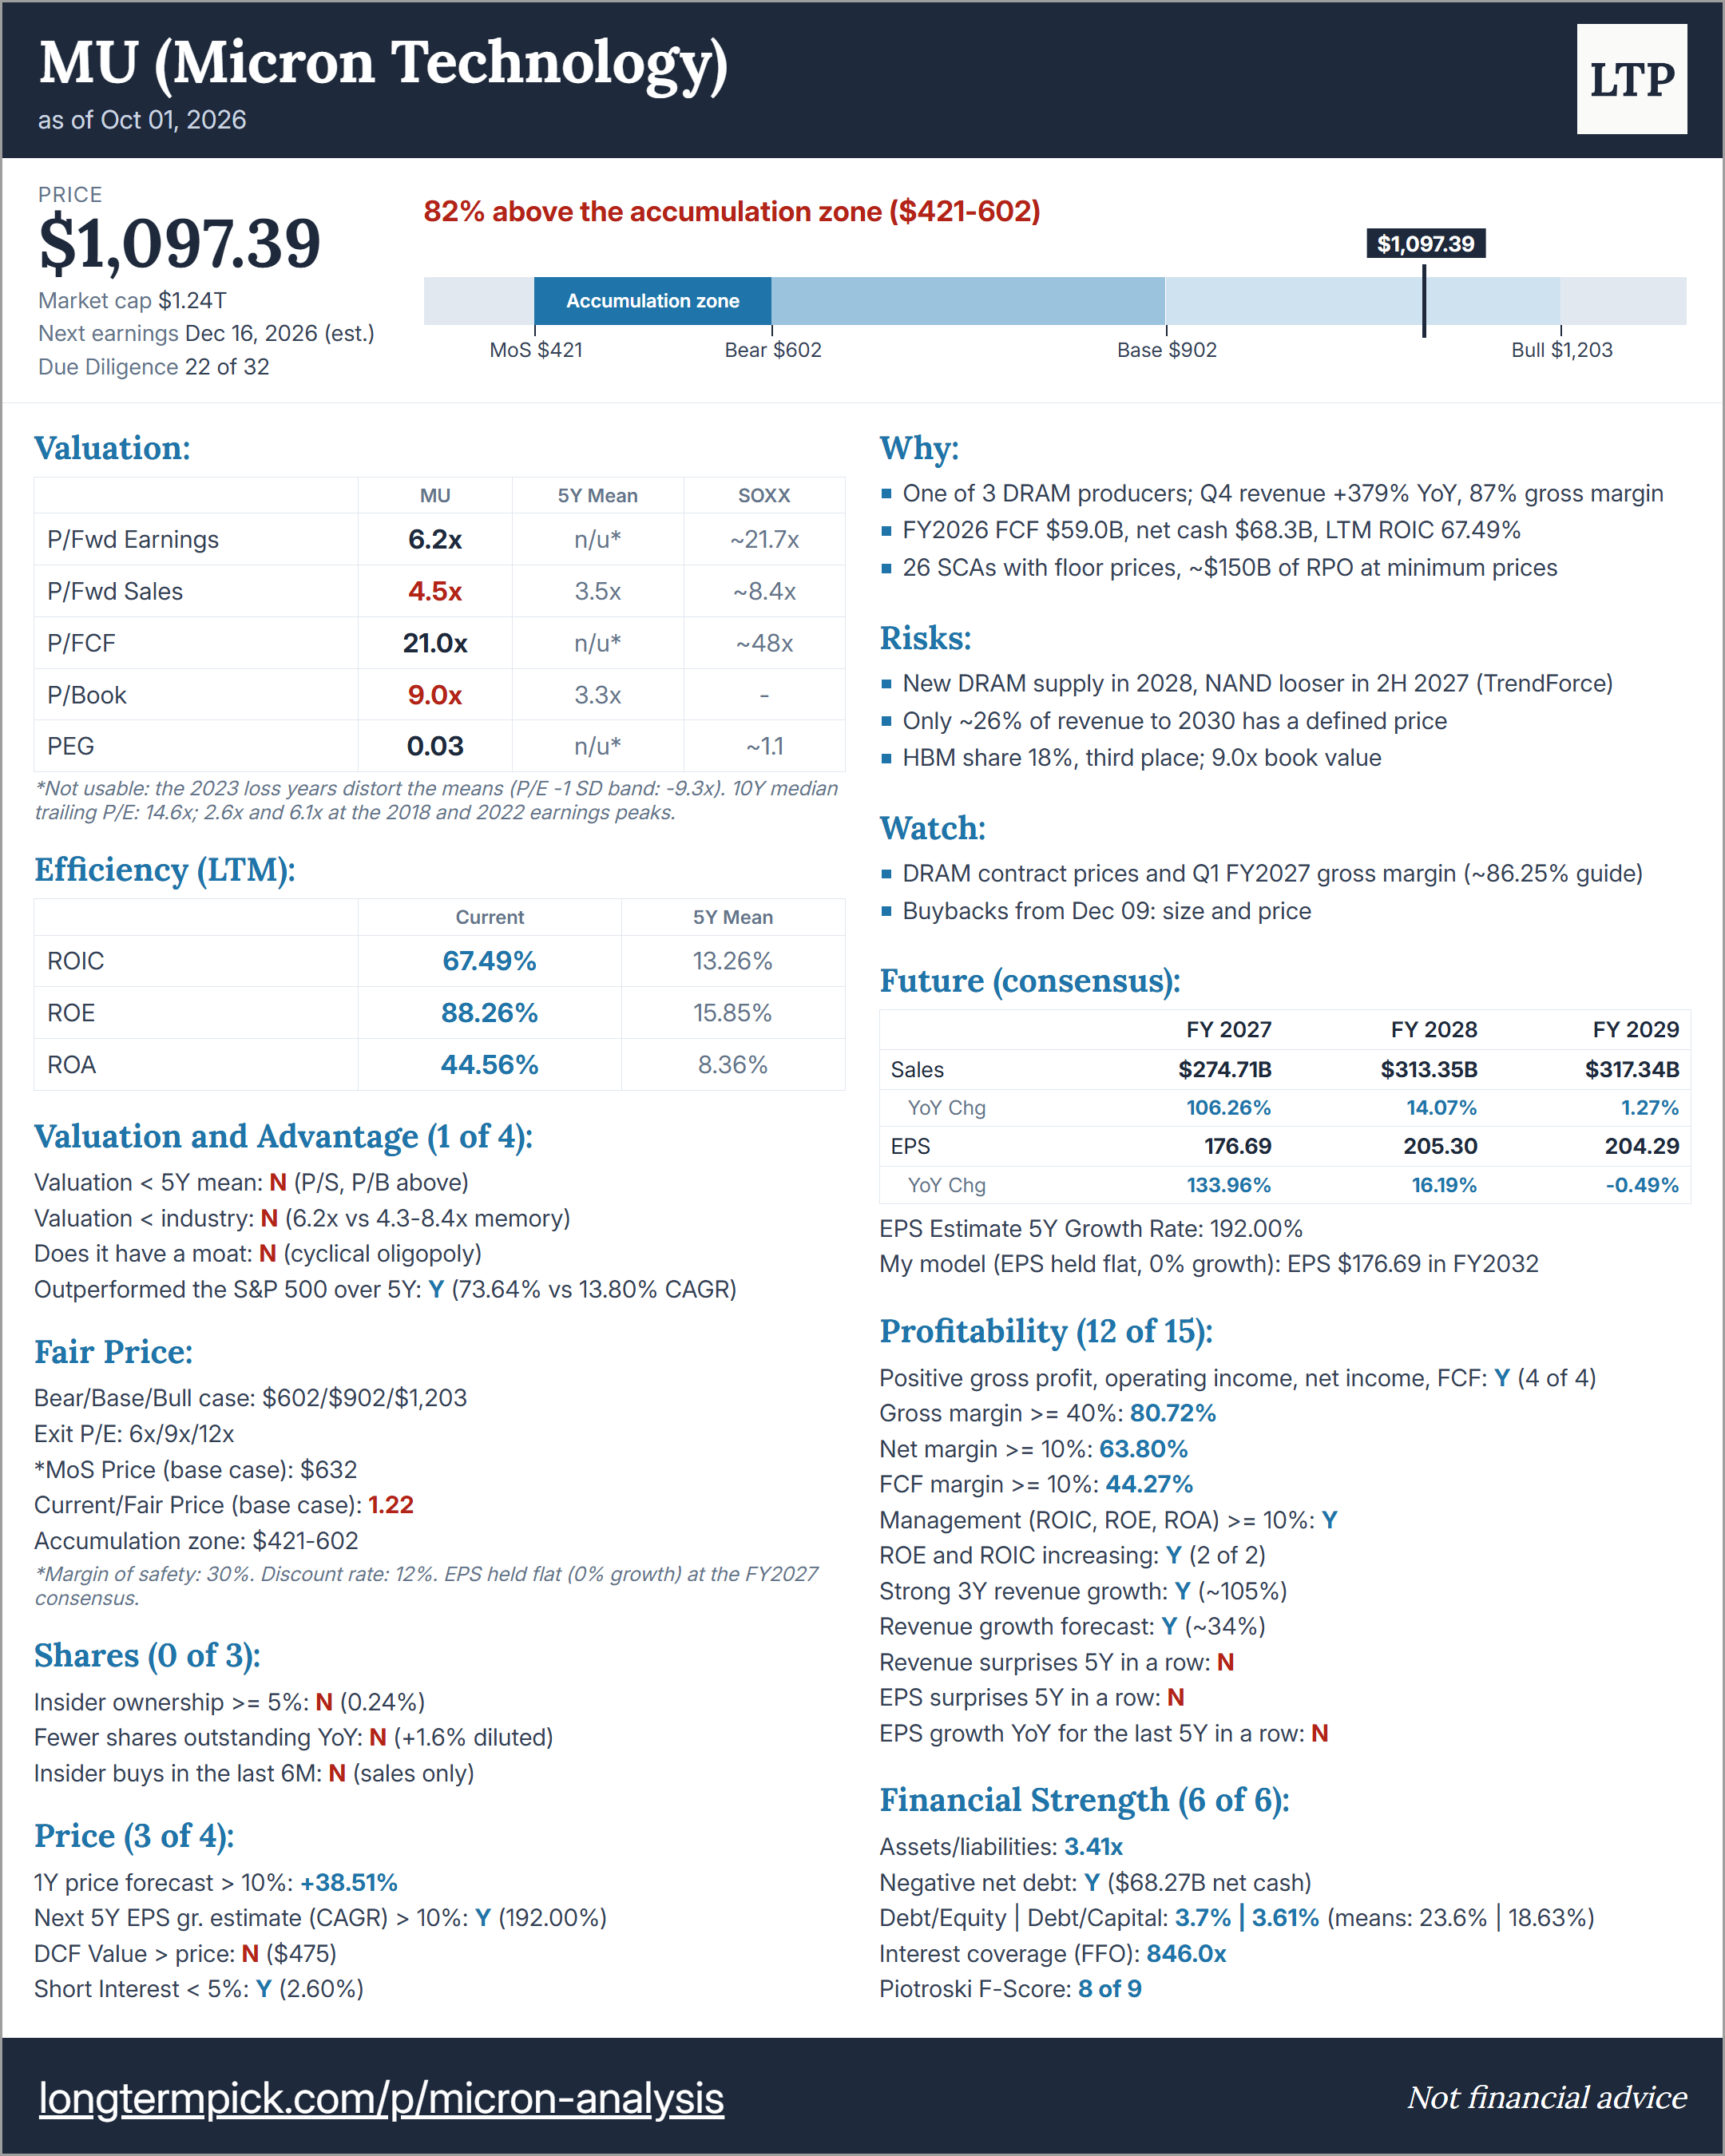
This is not a financial or investing recommendation. It is solely for educational purposes.