

TL;DR: Microsoft is the enterprise software monopoly plus the fastest-growing hyperscaler. The stock is down 11% in a year, yet Azure just crossed $100B in annual revenue growing 43%. Contracted future revenue (RPO) jumped 84% to $678B. At 23.9x forward earnings versus a 29.8x five-year average (below the -1 standard deviation band), the market is pricing one of the highest-quality businesses at roughly a market multiple. The bear case: capex at 35% of revenue has crushed FCF. Verdict: my bear case fair price is $453, and the stock trades right at it. My full fair price math and the accumulation zone are at the end of this post. I have been holding this giant for years and will continue to do so.
Investment Thesis
Microsoft closed fiscal 2026 with revenue up 18%, operating income up 21%, and Azure accelerating to 43% growth. The stock still trades with an 11% decline over the past year. That gap between the business and the price is the reason for this post.
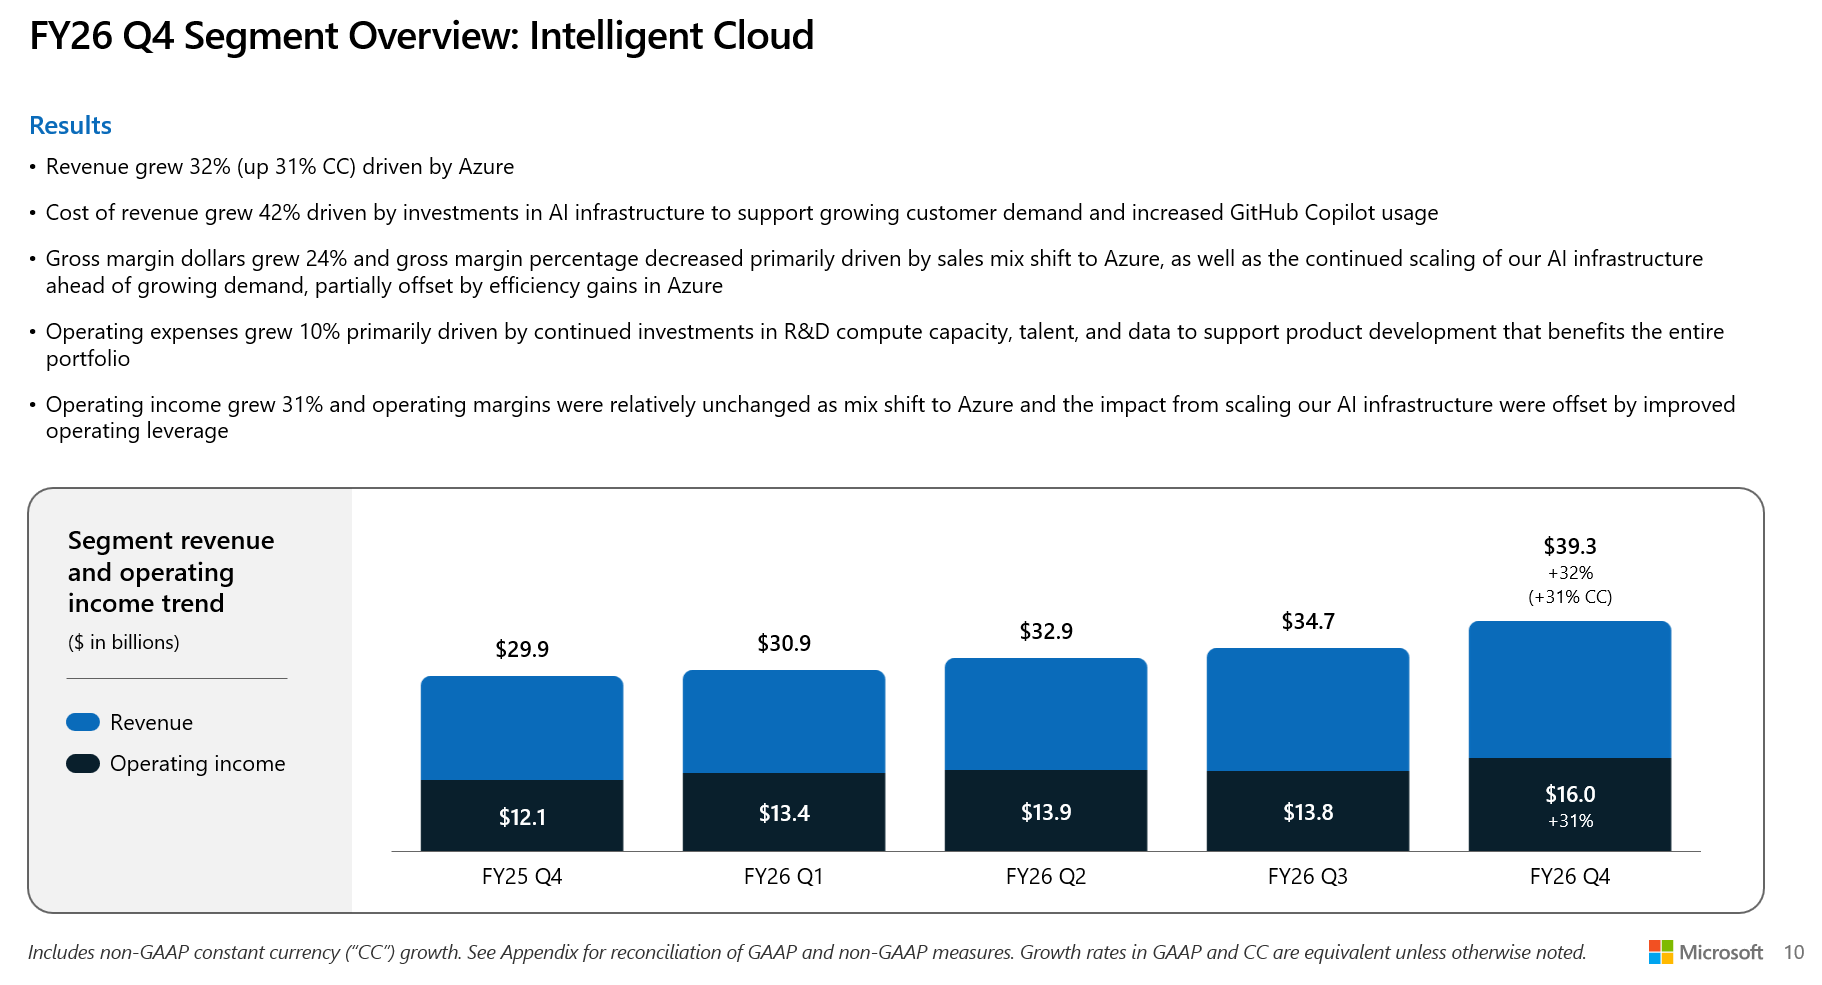
Azure crossed $100 billion in annual revenue and is accelerating. Full-year growth of 41% versus 35% in FY2025, a 43% exit rate in the June quarter, and guidance of ~45% for the next quarter. Management is doubling total data center capacity in two years. And demand still exceeds supply.
Revenue is unprecedented. Commercial remaining performance obligation of $678B, up 84% (up 25% even excluding OpenAI), with a weighted duration of just 2.3 years.
High quality. 68% gross margin, 40% net margin, 23% ROIC, net cash balance sheet, and the 21st consecutive year of dividend increases.
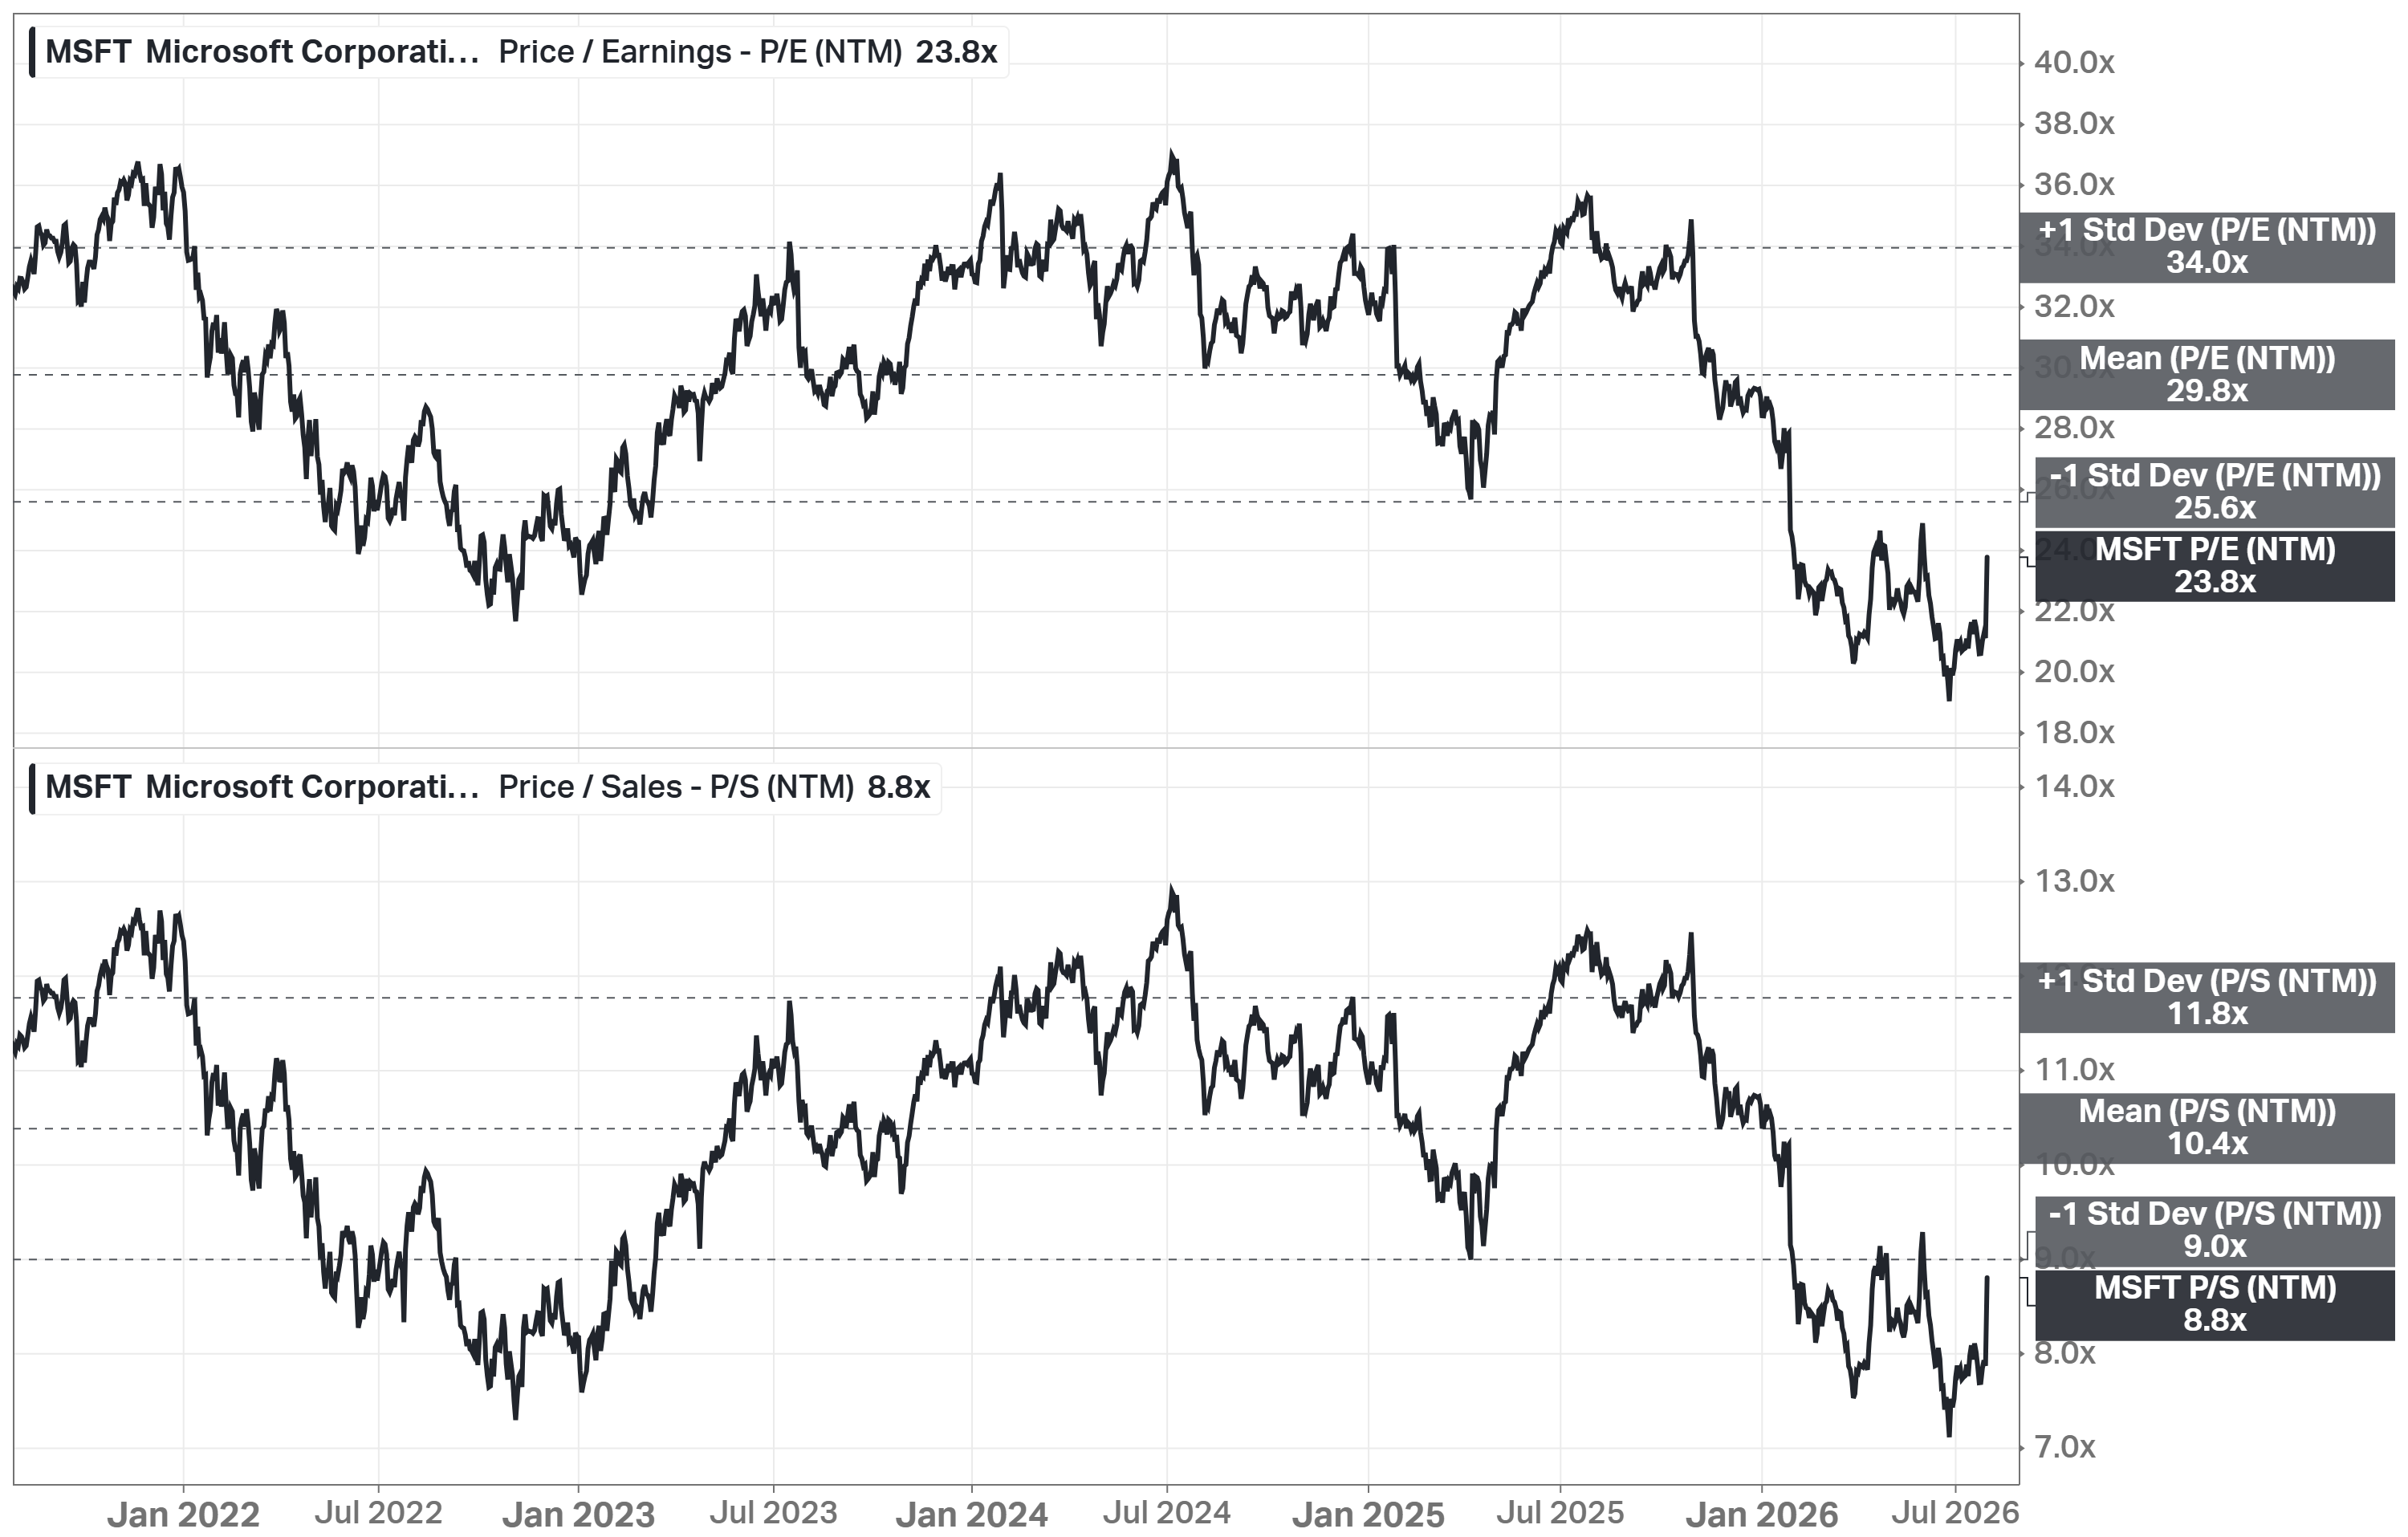
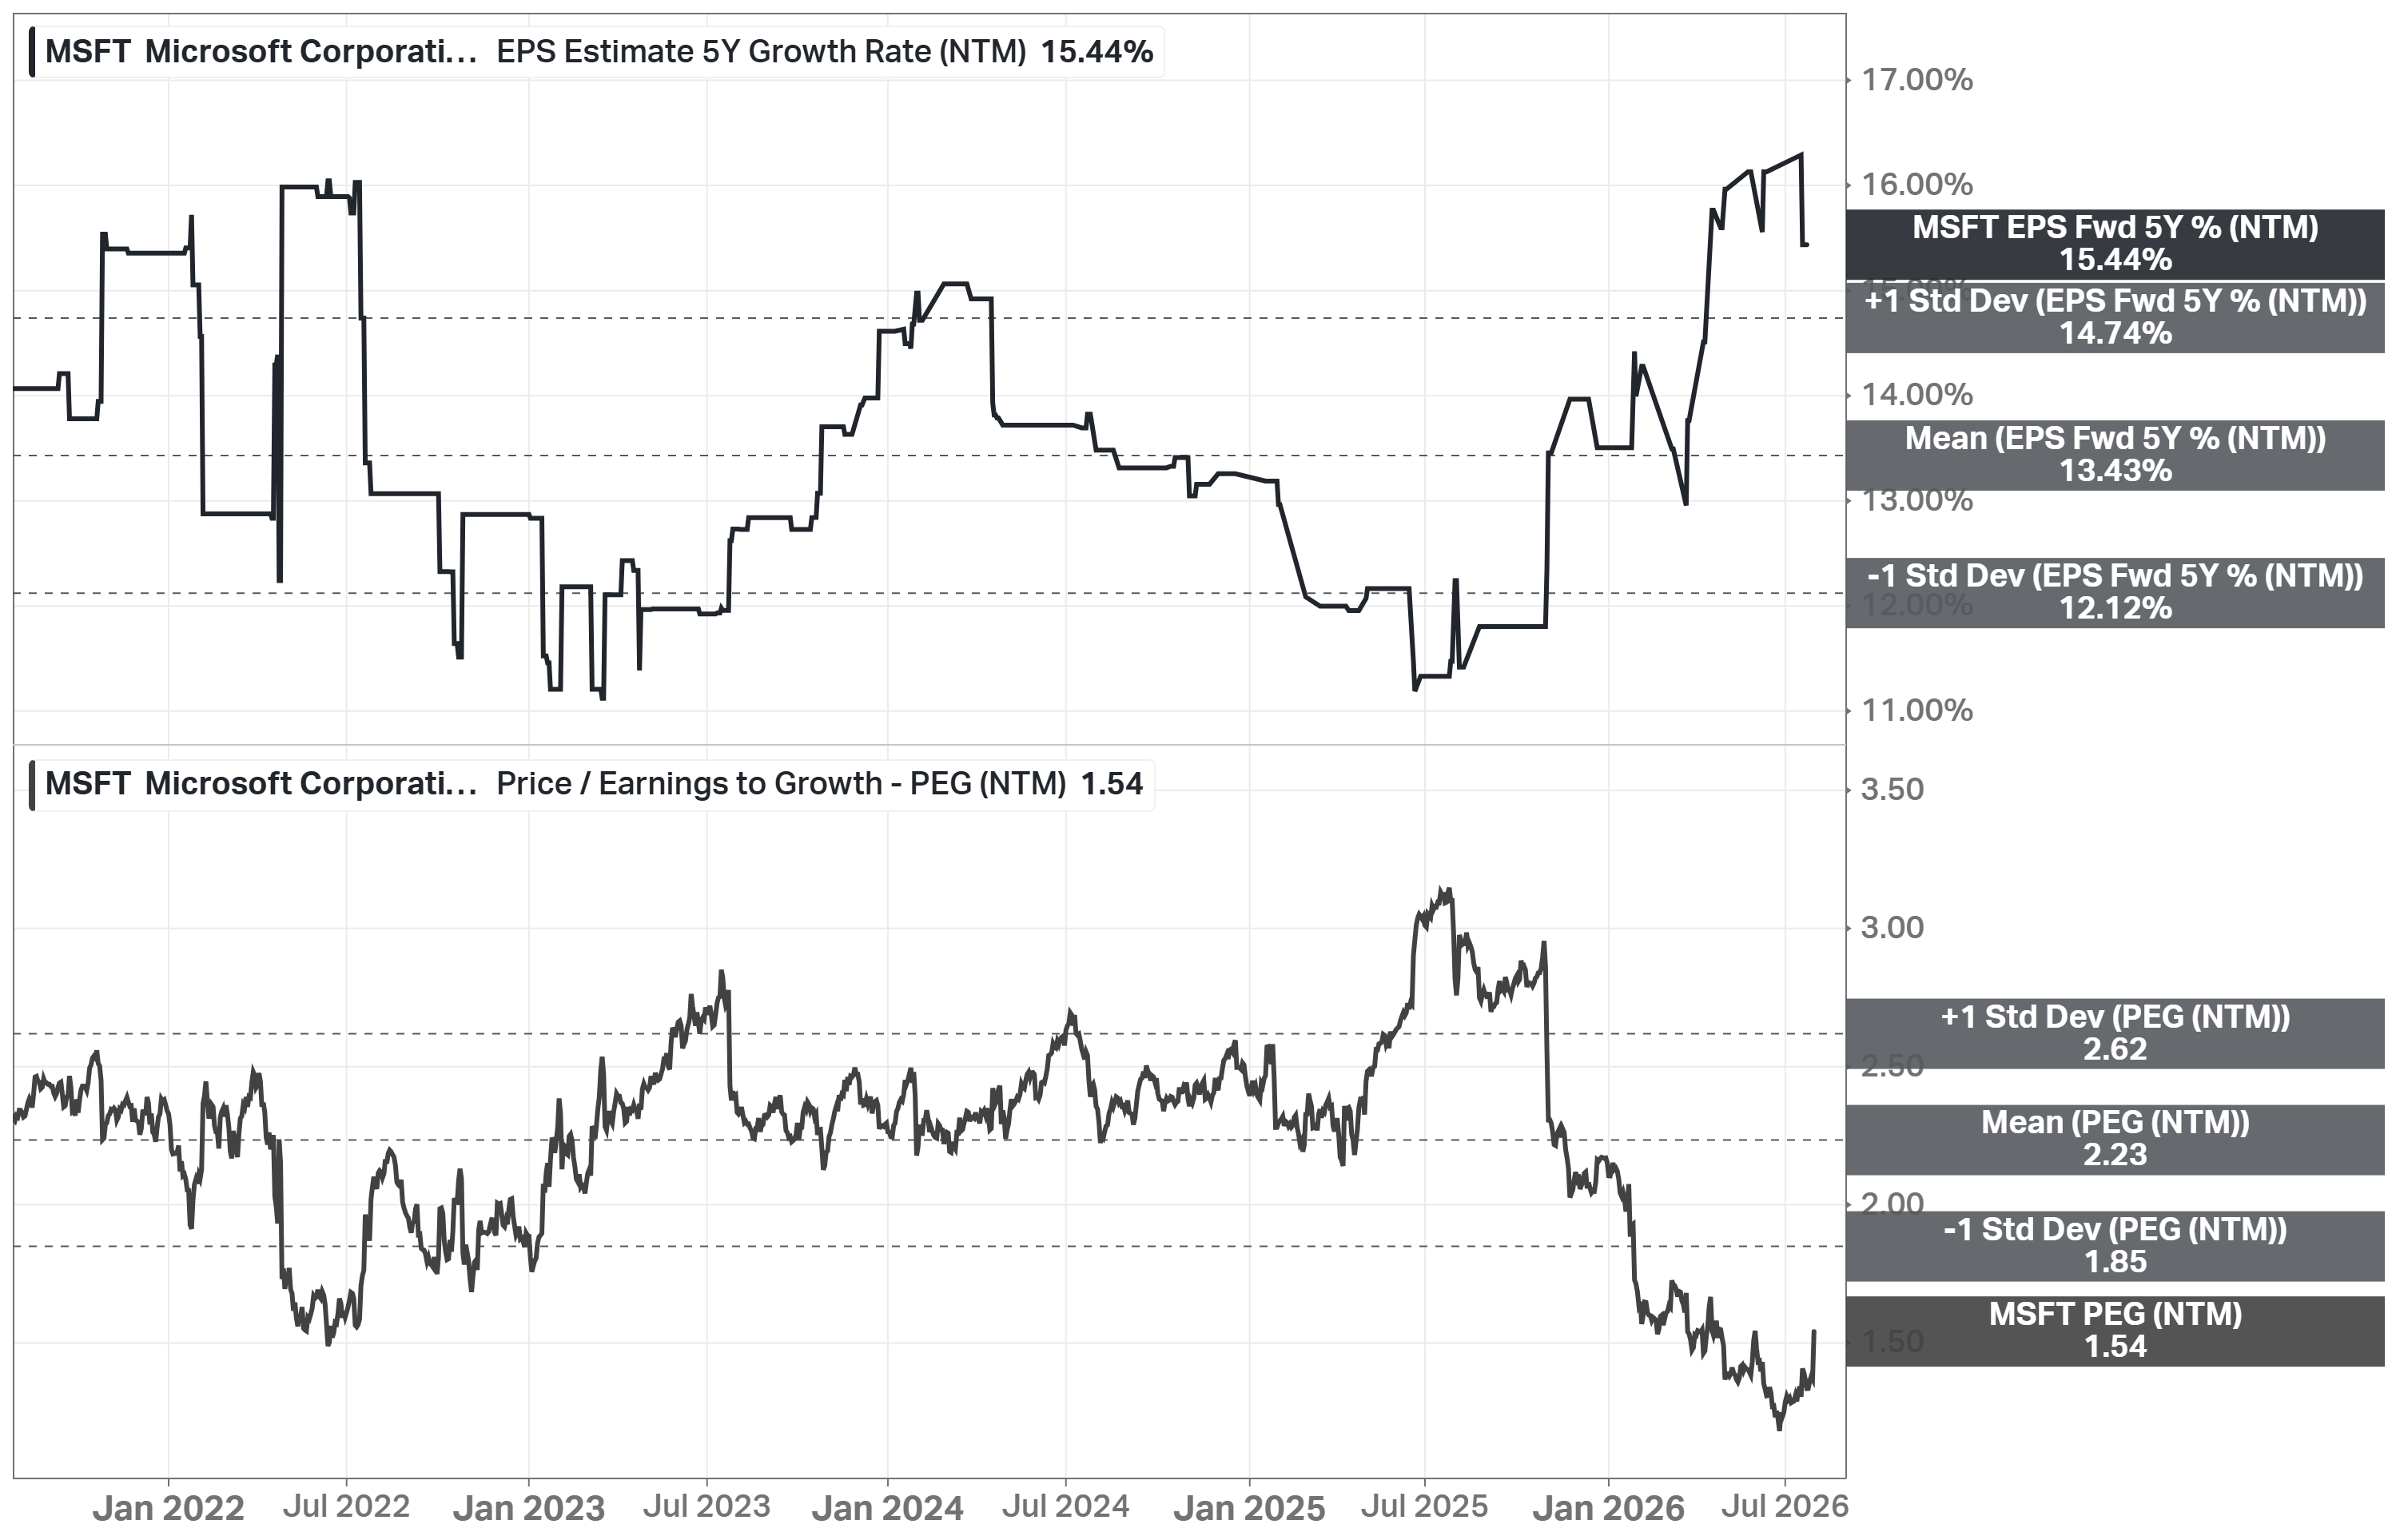
The multiple has already de-rated. 23.9x forward earnings versus a 29.8x five-year mean (below the -1 standard deviation band), while forward EPS estimates rose 23% over the same year.
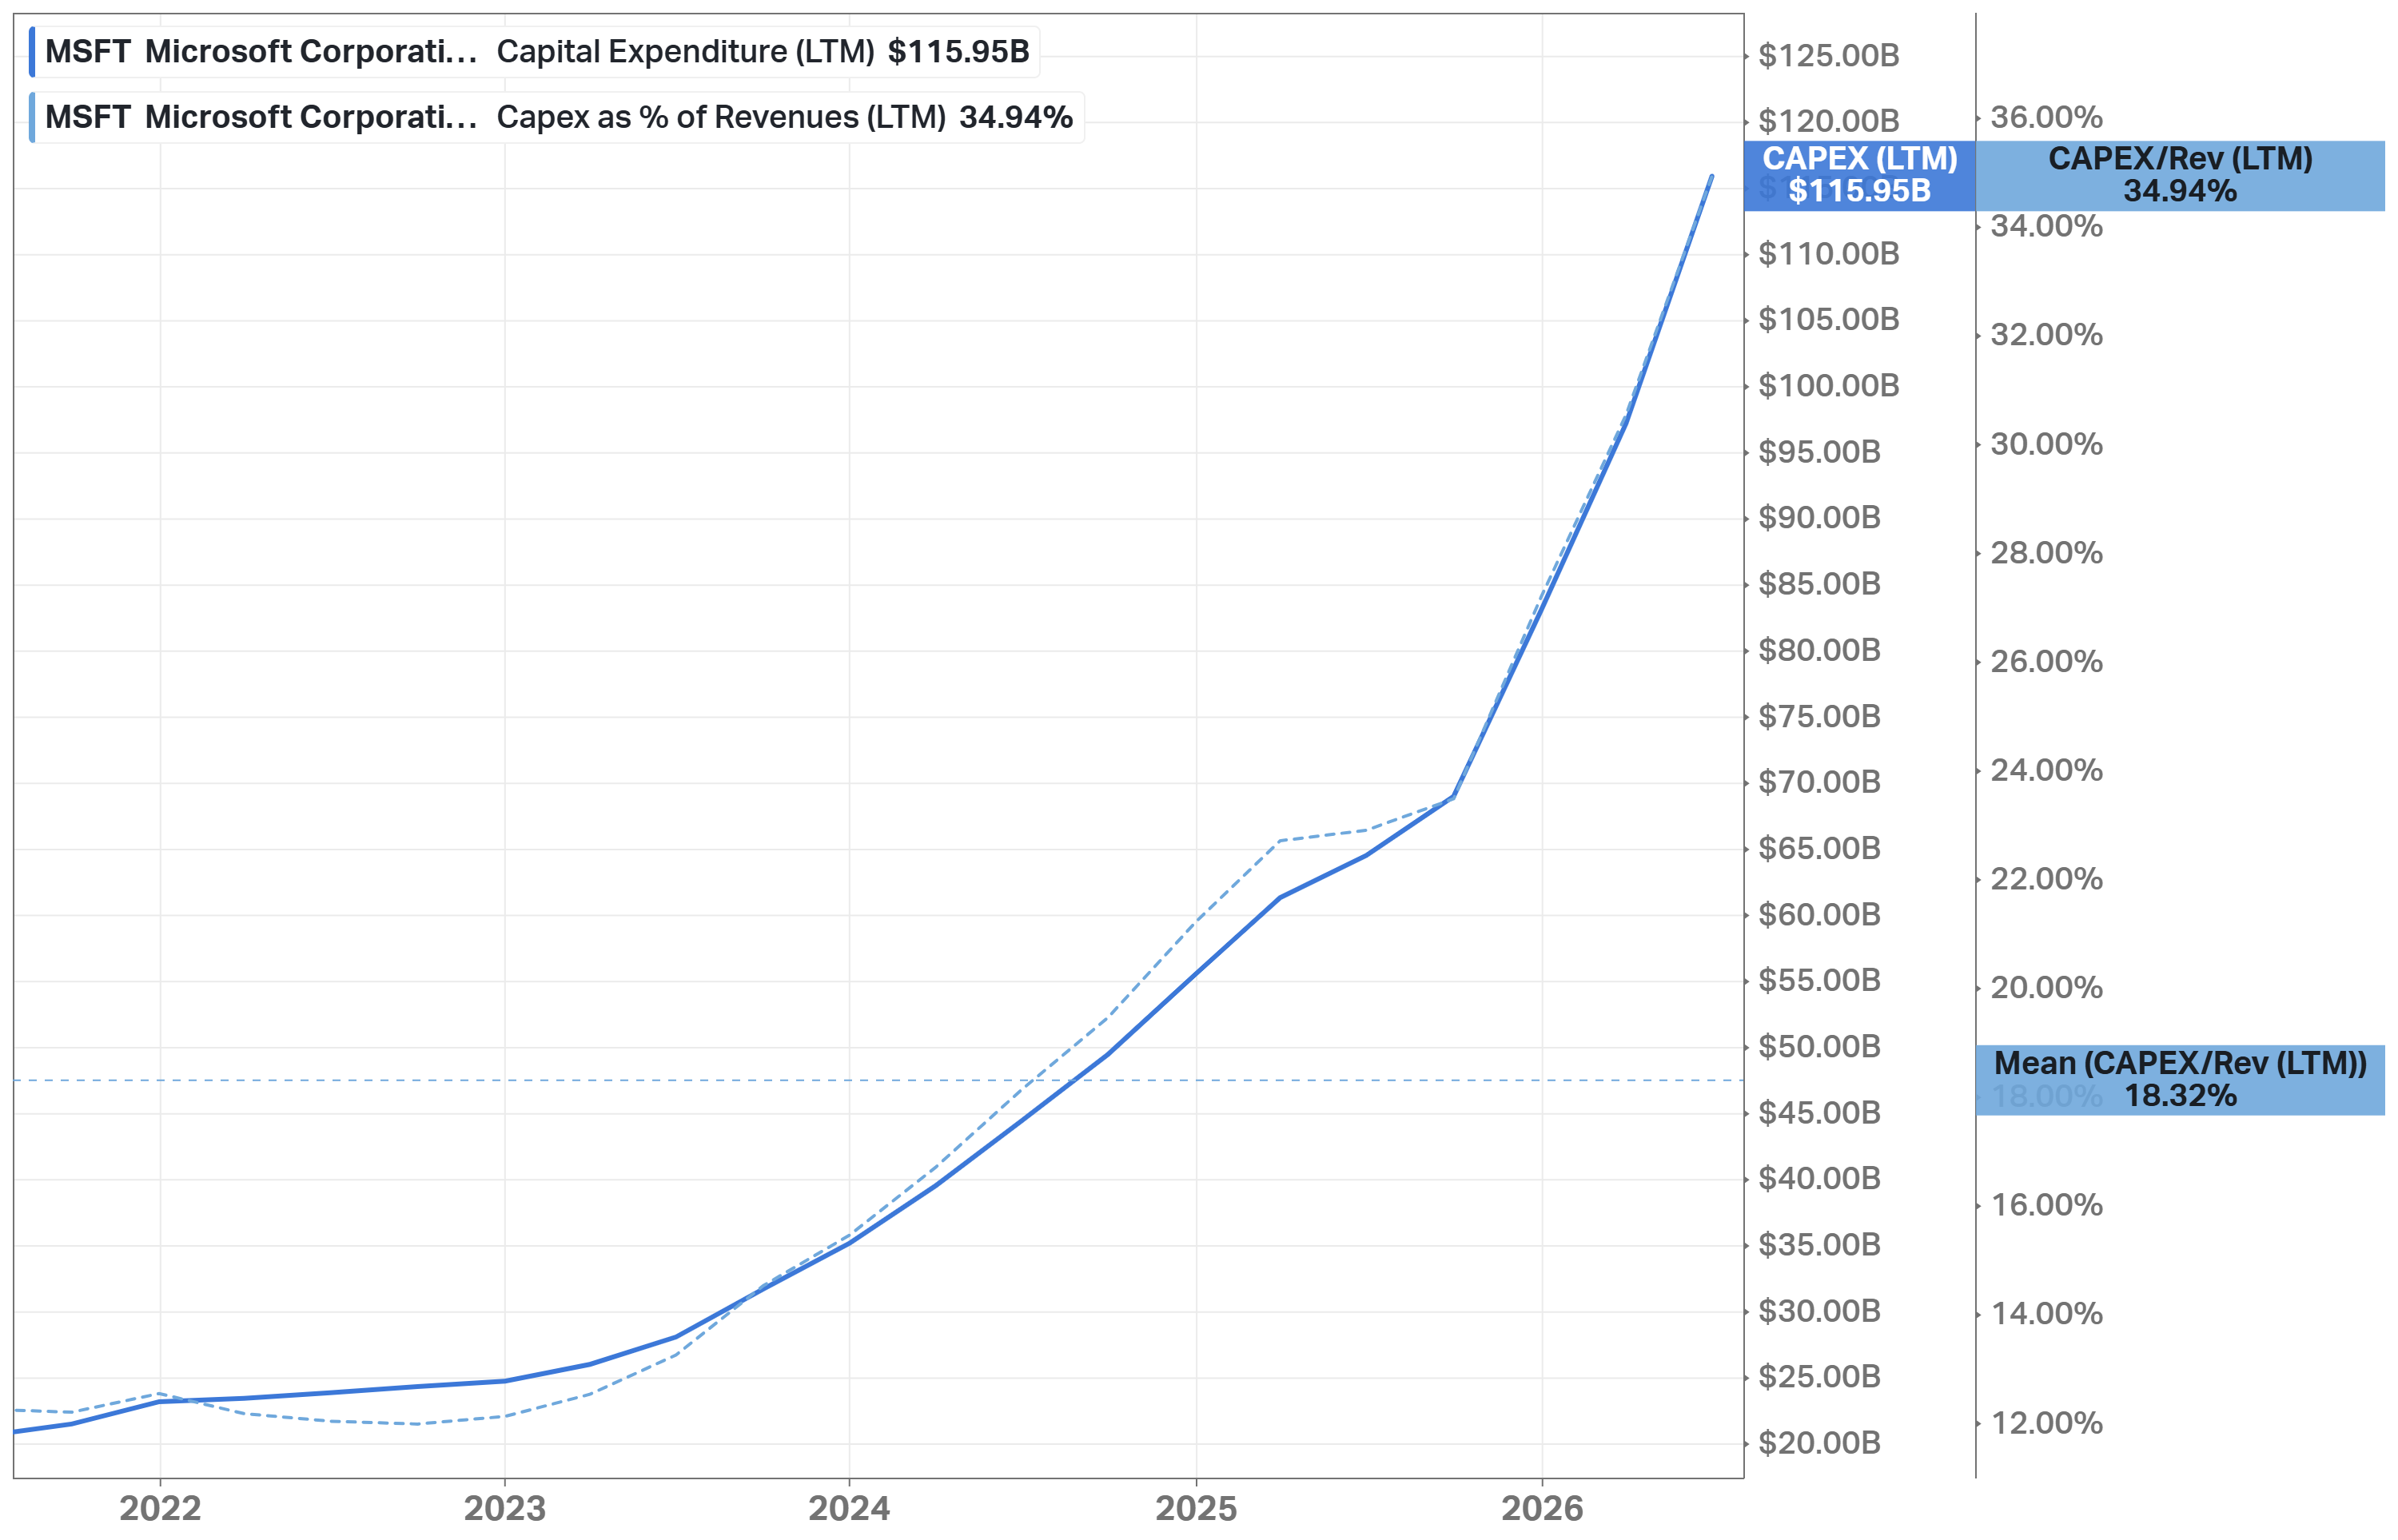
The bear case is the capex supercycle. $116B of capital expenditures (35% of revenue) cut FCF margin from a 29% average to ~20%. My model absorbs that by capping growth at consensus 15% and using a 20x bear exit multiple. And even then, the stock trades right at my bear case fair price.
Company Overview
Next Earnings Date: Oct 29, 2026 (expected)
Market Cap: ~$3.40T
Sector: Information Technology | Industry: Software
Type: Mega Growth
Beta (5Y Monthly): 1.13 | Short Interest: 1.20%
Dividend Yield: 0.80%
Employees: ~223,000
Microsoft is the largest software company in the world and the second-largest cloud provider. Its base is a set of near-monopolies in enterprise computing: Windows, Microsoft 365 (Office, Teams, Outlook), and Entra identity run the day-to-day work of most large organizations on the planet. And every one of those parts is now a distribution channel for AI.
The product stack today: Azure cloud infrastructure and AI services (including Azure AI Foundry with 11,000+ models from OpenAI, Anthropic, Mistral, xAI, and Microsoft’s own MAI family); the Copilot family (Microsoft 365 Copilot, GitHub Copilot, Security Copilot); Microsoft 365 and Office; Dynamics 365 business applications; LinkedIn; GitHub and Visual Studio developer tools; Microsoft Fabric and SQL Server for data and analytics; the Power Platform; the security suite (Defender, Sentinel, Entra, Purview); Windows and Surface devices; Bing and Edge search advertising; Xbox with Activision Blizzard content (Call of Duty, Candy Crush); and first-party silicon (Maia AI accelerators) underneath it all.
Analyst's note:
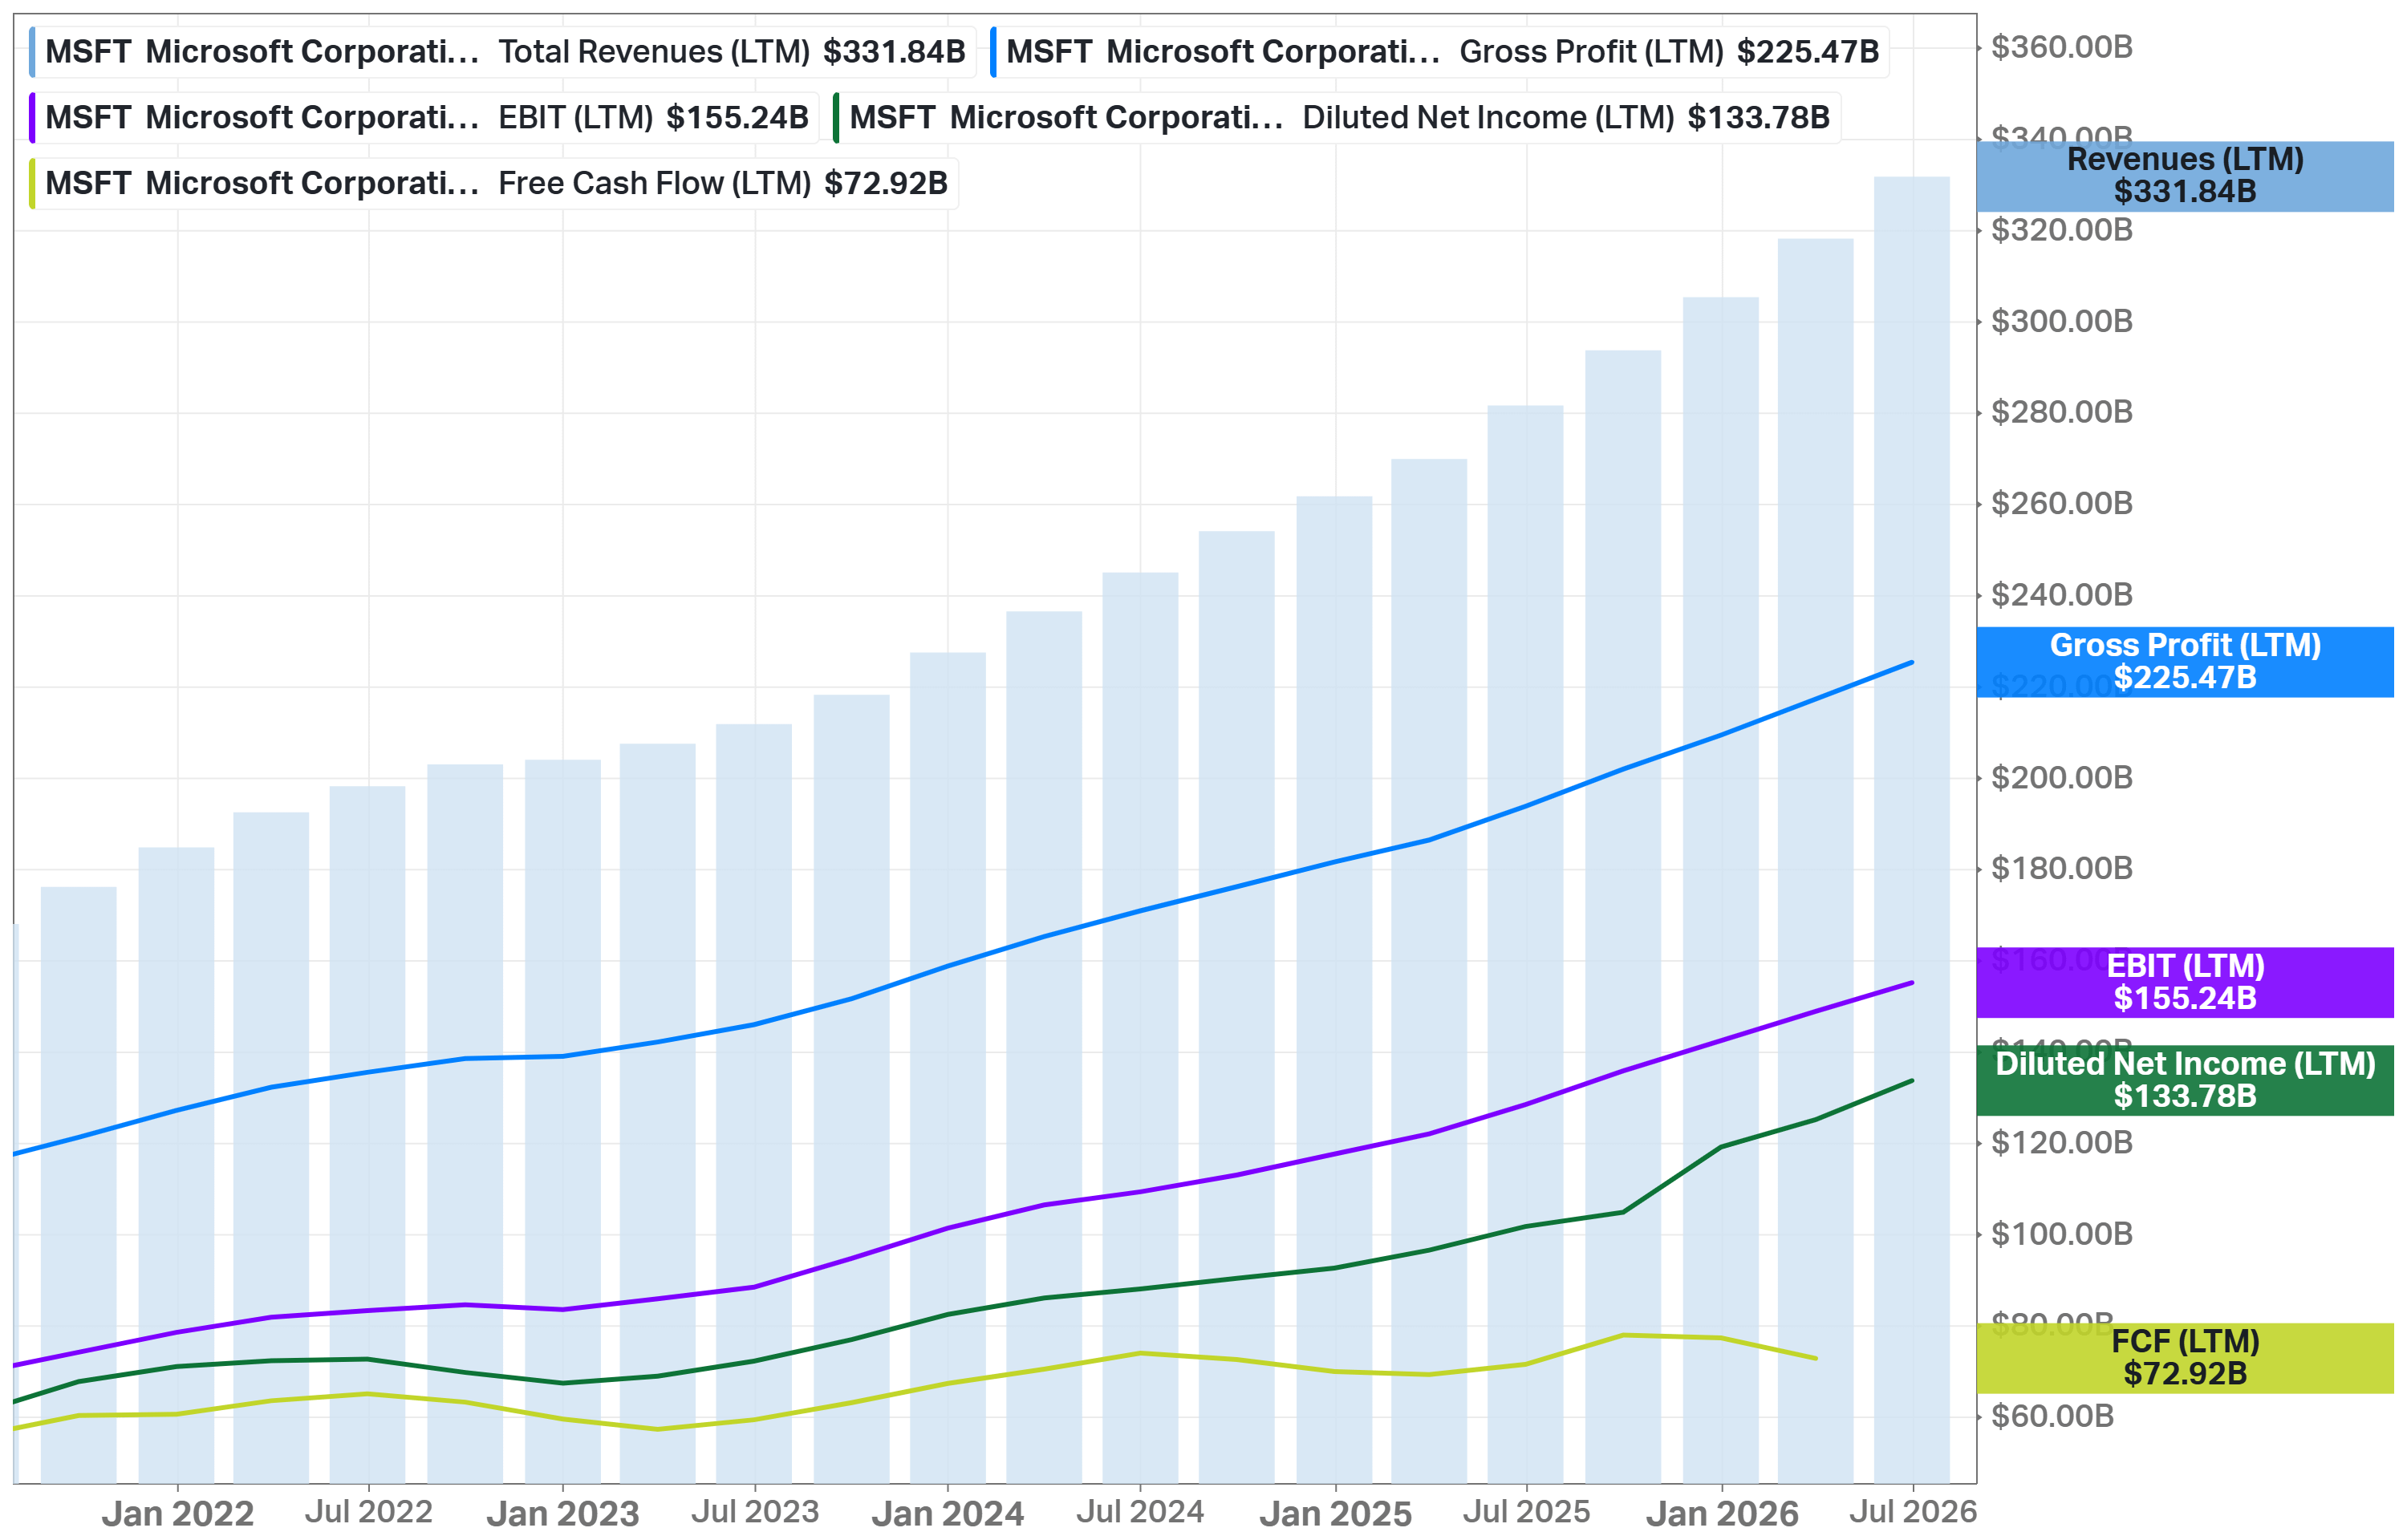
The chart above shows LTM FCF of $72.9B and a 22.9% margin because Koyfin's data does not yet include the June 2026 quarter, where capex stepped up to $41B. On the fresh press-release numbers, FY2026 FCF is $67.0B, and the margin is ~20%.
Market Overview
The core question for Microsoft is the same one hanging over all of AI infrastructure: does the spending continue, and does it pay back? Microsoft’s own numbers are currently the best answer the bulls have:
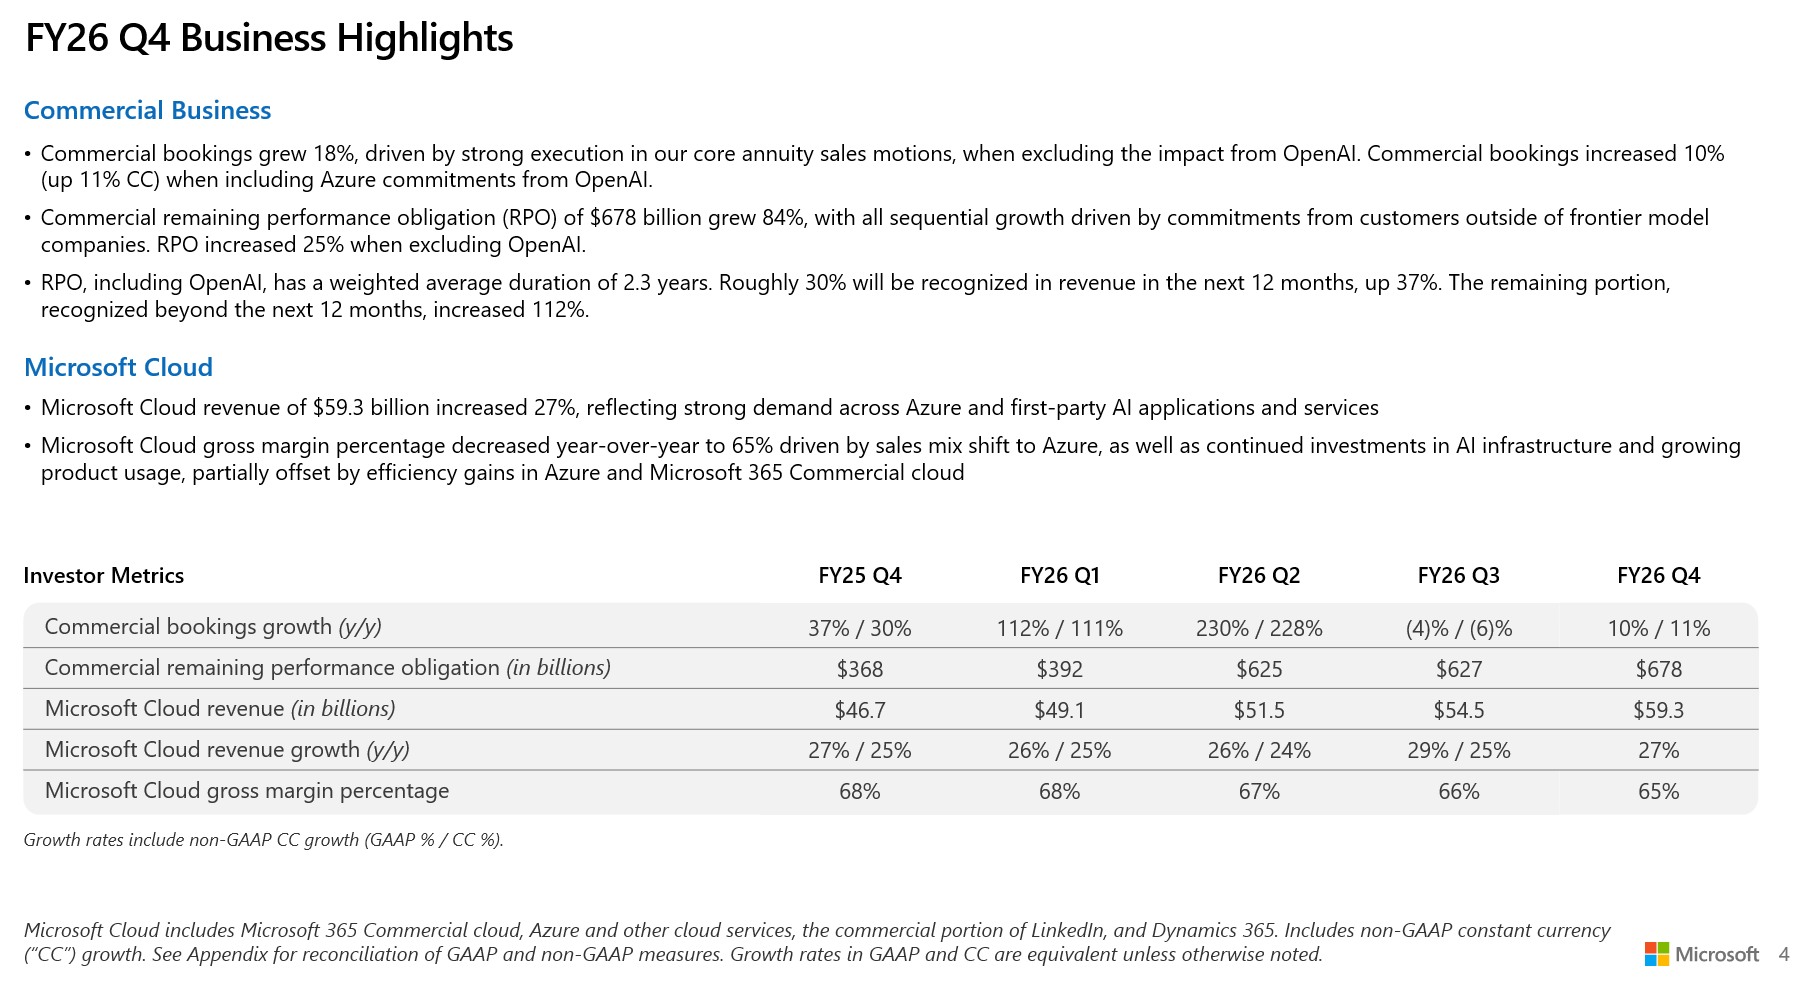
Commercial remaining performance obligation reached $678B, up 84%, and up 25% even excluding OpenAI’s commitments. This is signed, contracted future revenue, and ~30% of it is converting within 12 months.
Microsoft added another gigawatt of data center capacity in the June quarter alone and remains on track to roughly double total capacity in two years, while still being demand-constrained.
Monetization is visible, not hypothetical. Microsoft 365 Copilot passed 30 million paid seats, GitHub Copilot serves millions of developers, Fabric has 40,000+ paid customers (up 60%), and Copilot workload throughput is up 4x since the start of the year.
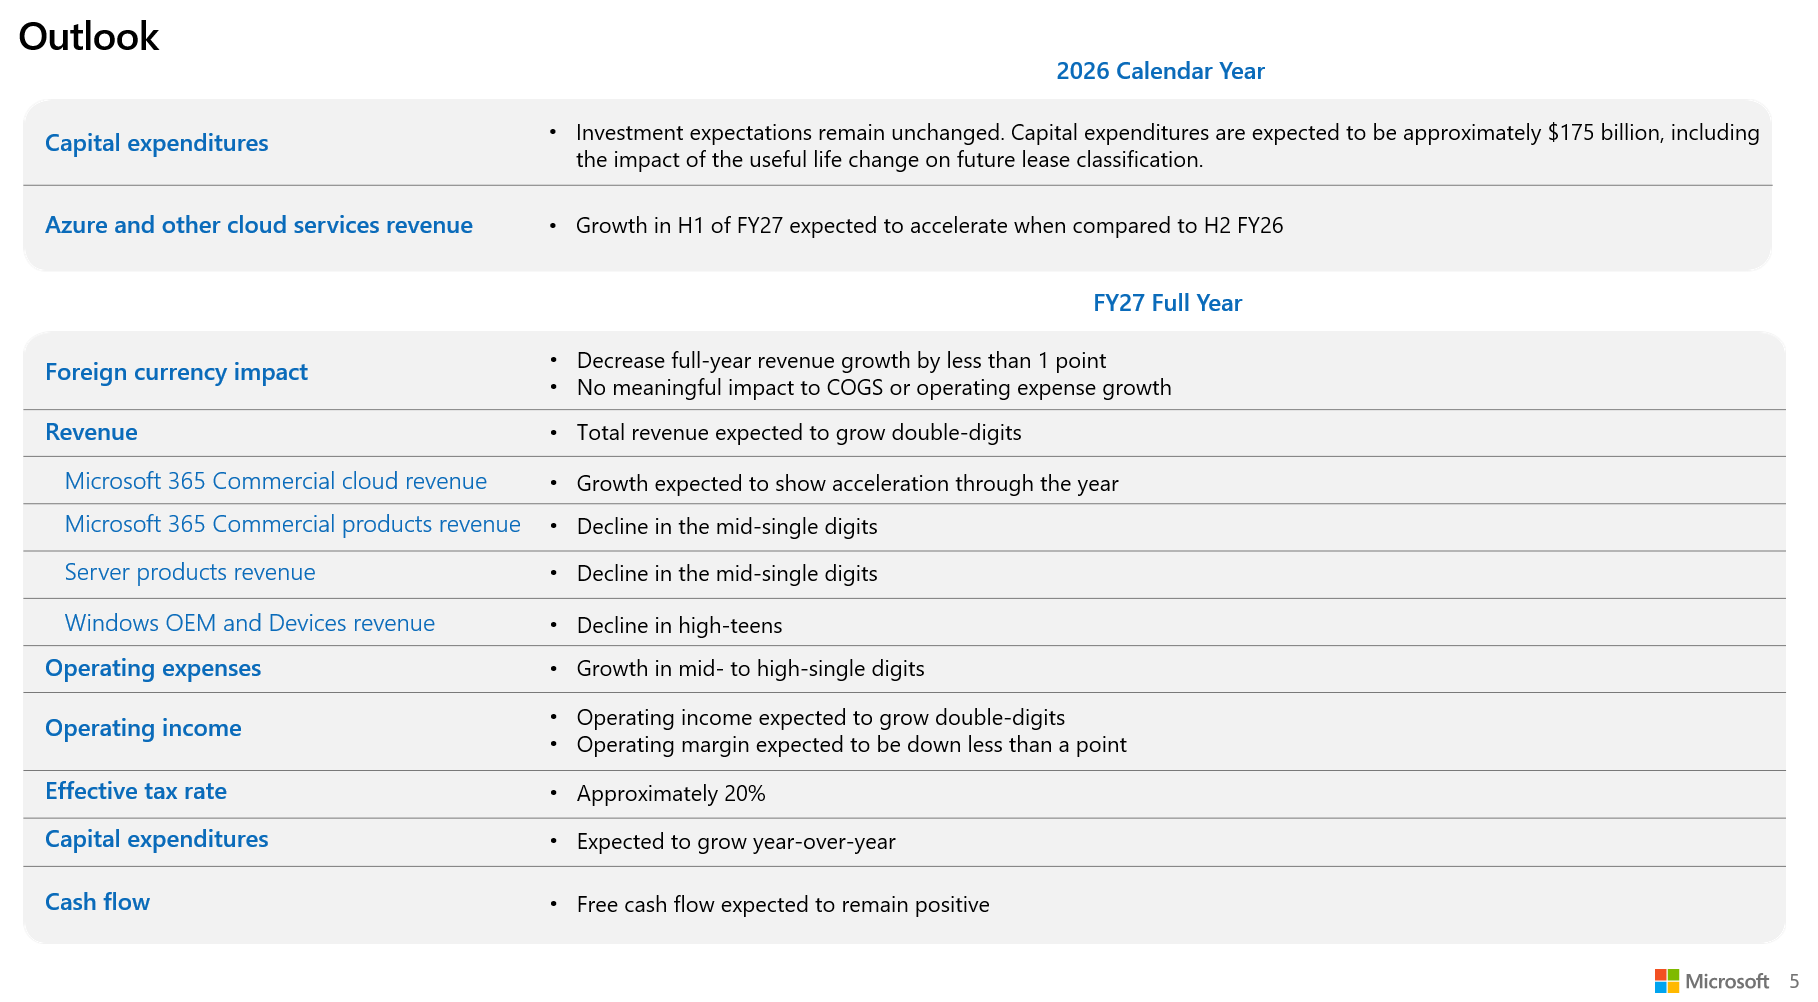
Management guides calendar 2026 capex to approximately $175 billion, and Azure growth in H1 FY27 to accelerate versus H2 FY26.
Unlike a chip vendor, Microsoft does not need the AI capex boom to continue at any particular pace - it needs enterprises to keep paying for software. The AI buildout runs through the same subscription machine that survived every previous cycle: if AI works, Microsoft sells it per seat per month; if AI disappoints, the seats are still there.
Economic Moat
Microsoft has one of the widest moats in business, built on three layers.
The first is distribution. Hundreds of millions of commercial seats across Microsoft 365, Windows, and Entra. It means every new product (including every Copilot) launches into an installed base competitors spend decades trying to build.
The second is switching costs. Identity, documents, collaboration, security, and now AI workflows are woven into a single stack.
The third is the full-stack AI position. Microsoft owns the infrastructure (data centers, Maia silicon), the model layer (the OpenAI partnership, Anthropic and other frontier models in Foundry, plus its own MAI family), the platform (Azure AI Foundry), and the applications (Copilot). It collects revenue at whichever layer.
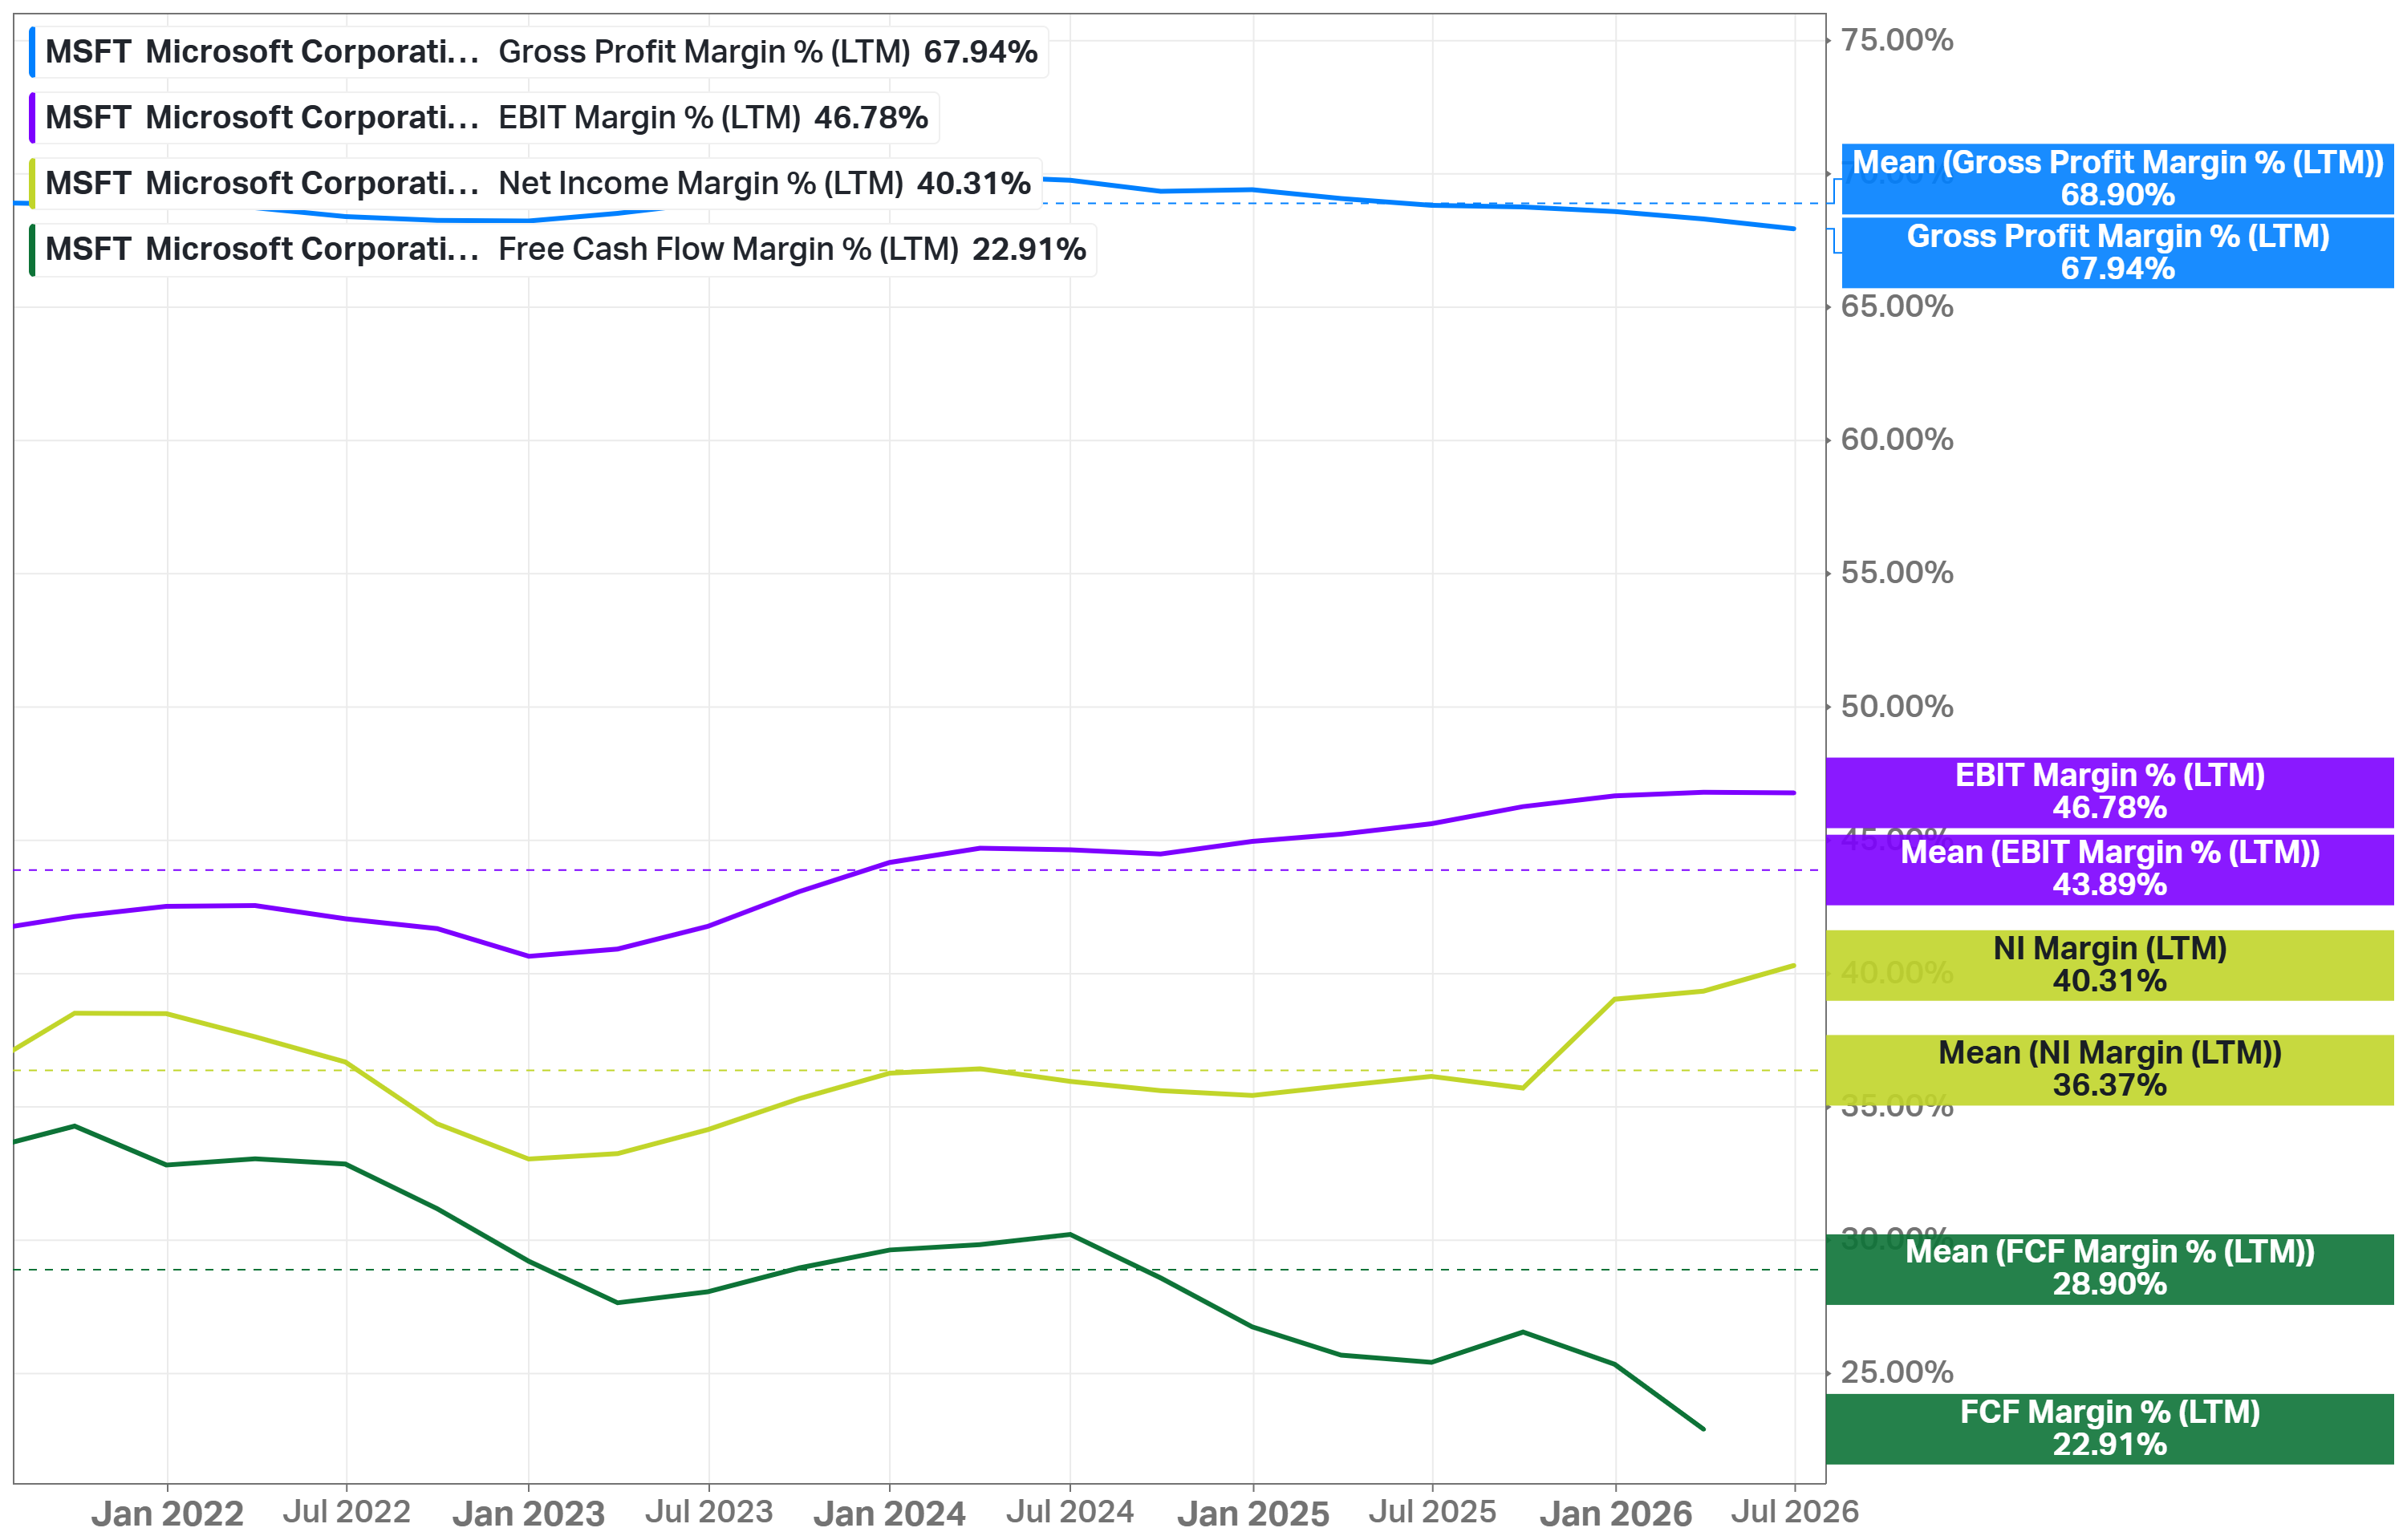
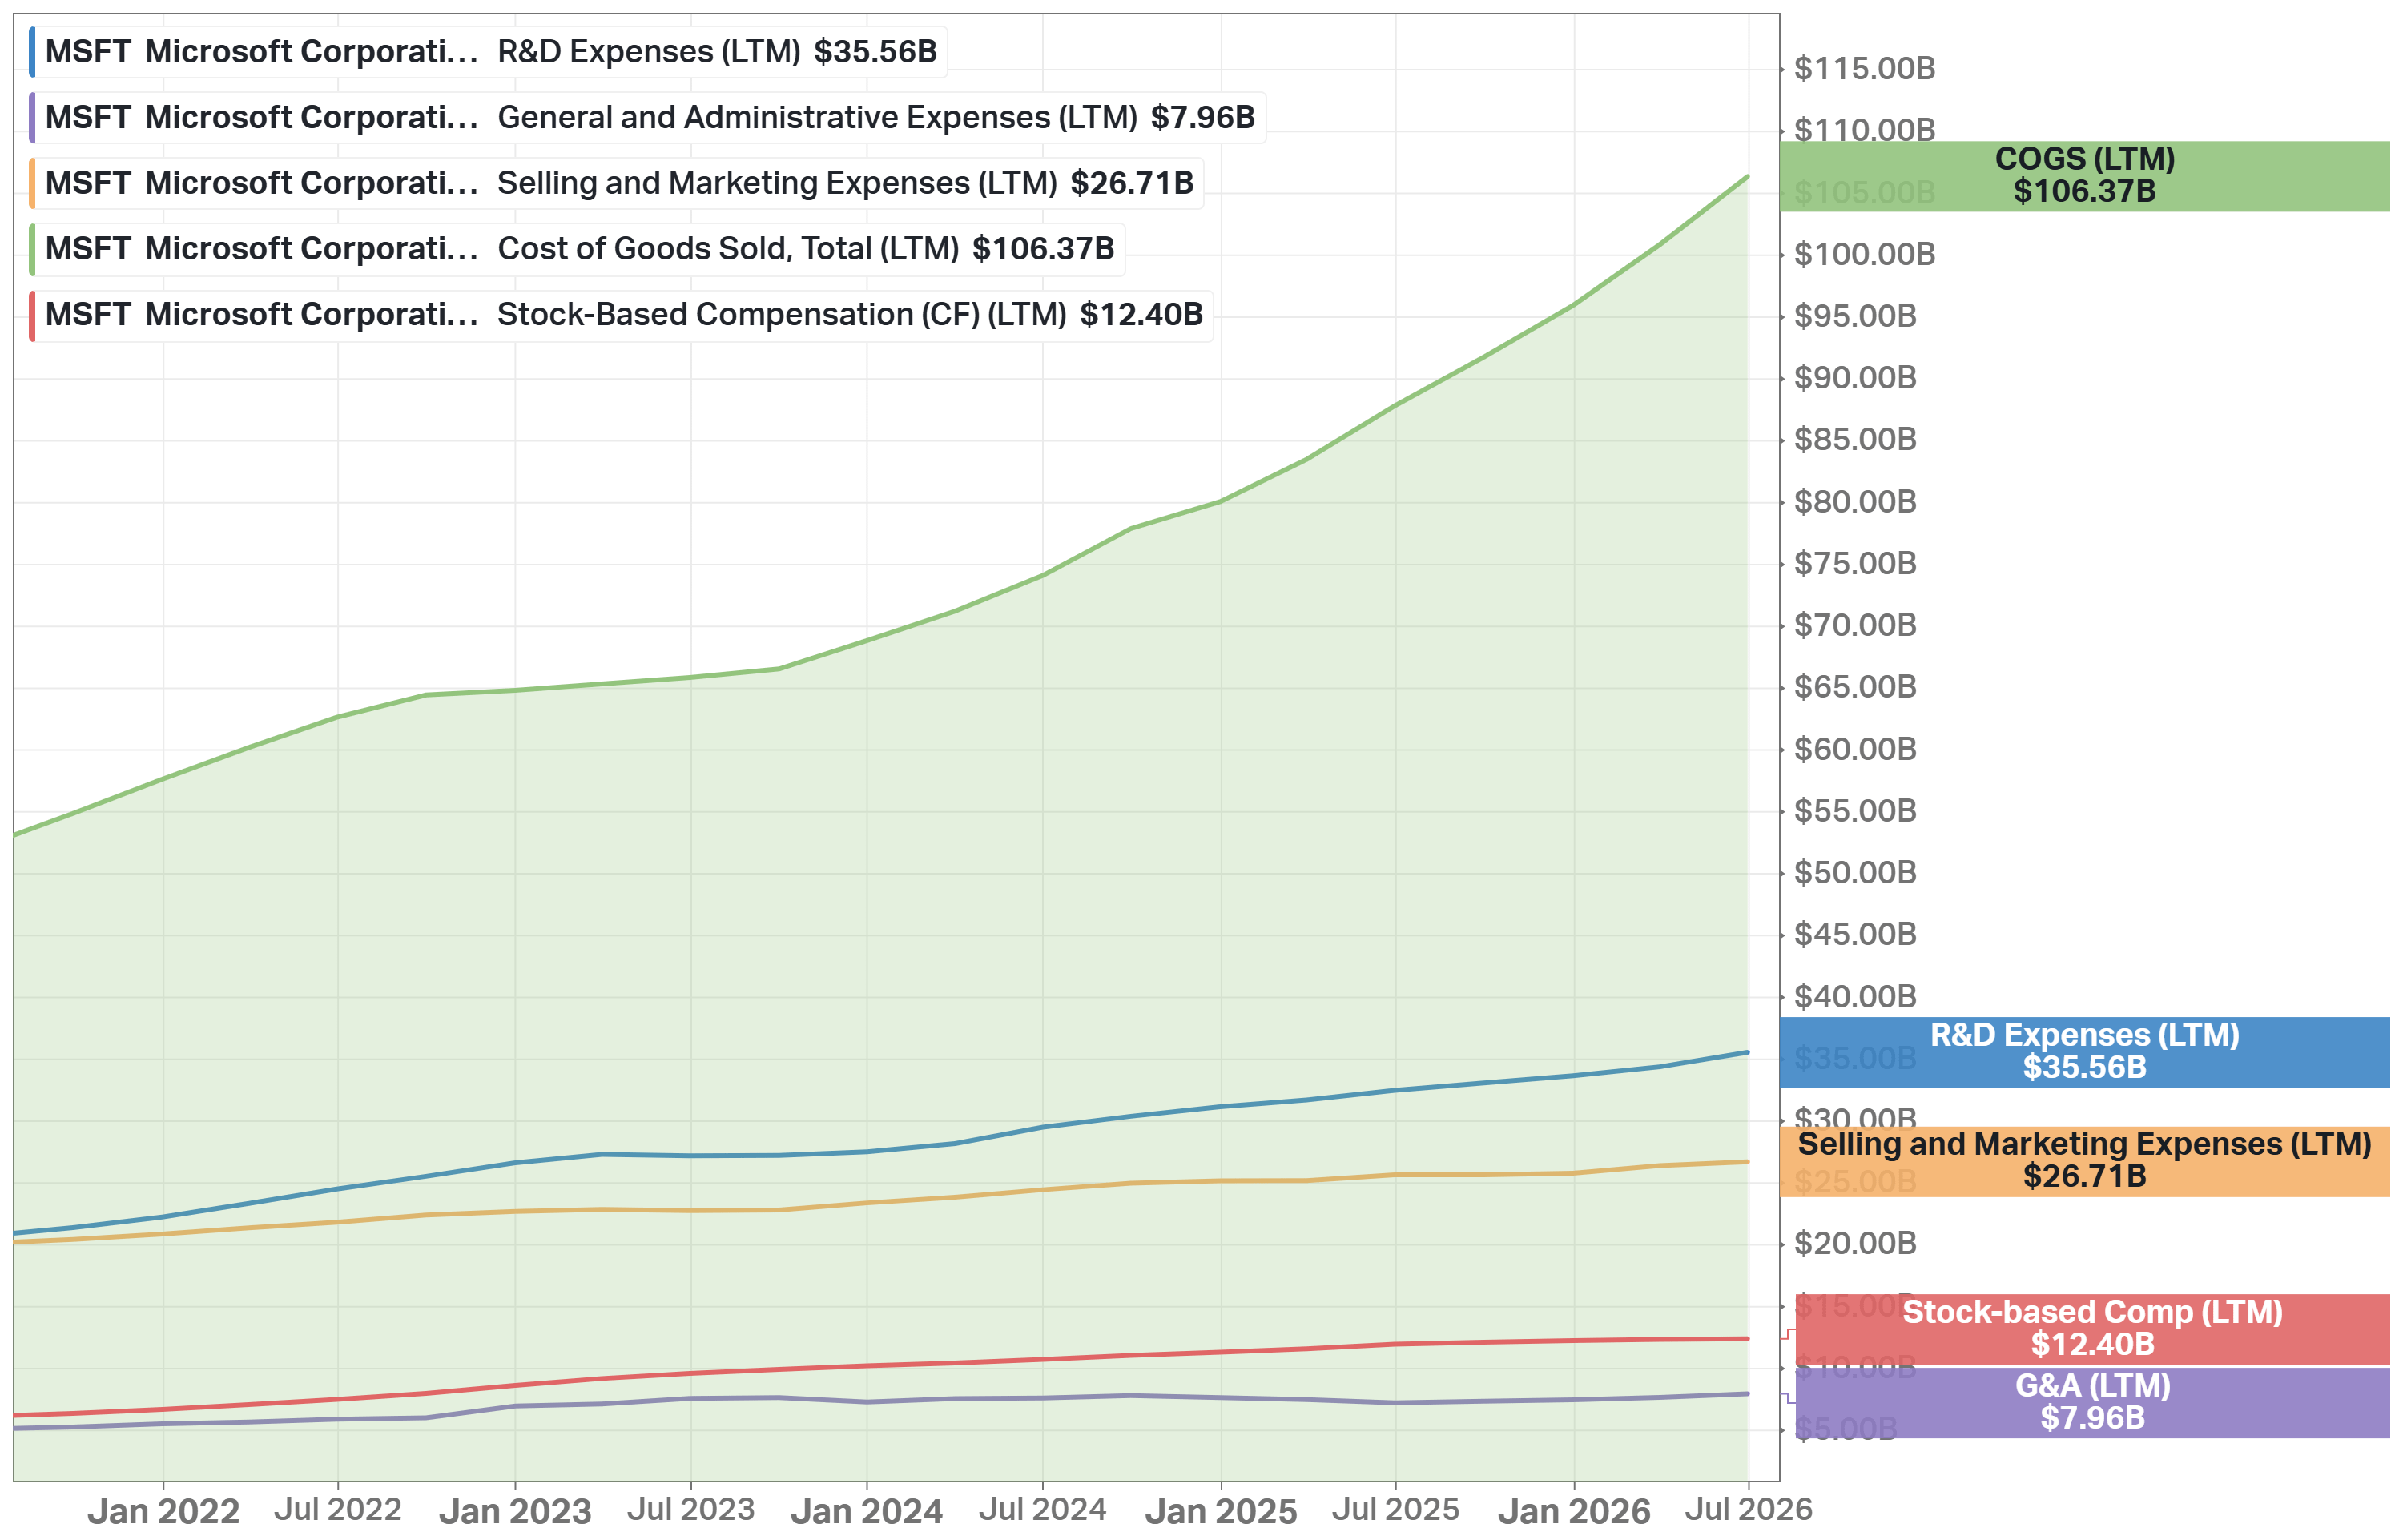
But the margins show that the moat is under pressure. Even with the largest capex cycle in software history, EBIT margin reached 46.8% - above its own five-year average of 43.9%. Because operating leverage in software keeps offsetting infrastructure costs. Net margin reached 40.3% versus a 36.4% mean.
More enterprise seats -> more data and workflows on the platform -> better Copilot and agents -> more Azure consumption -> which funds more capacity and models. Each turn deepens the dependency of the world's back office on one vendor.
Business Strategy
First, the infrastructure grab. Doubling data center capacity in two years, ~$175B of calendar 2026 capex, and first-party silicon to bend the cost curve. Maia 200 delivers 30% better performance per dollar than the latest merchant hardware in Microsoft’s fleet and already serves both OpenAI and MAI models.
Second, Copilot monetization on the installed base. Microsoft 365 Copilot passed 30 million paid seats. It is priced as a premium on top of existing subscriptions. The same motion repeats across GitHub, security, and Dynamics - AI is sold as an upsell to customers who already cannot leave.
Third, model independence. The OpenAI partnership remains central (the investment produced $4.96B of net gains in FY2026). But Microsoft now hedges it from every direction: Anthropic models in Foundry and Copilot (a $3.2B investment gain in Q4 alone), the in-house MAI family in production, and 11,000+ models in the catalog. Whoever wins the model race, the enterprise buys it through Azure.
Capital Allocation
Operating cash flow grew from $136B in FY2025 to $183B in FY2026, up 34%. The machine works.
What changed is where the cash goes. Capital expenditures reached $116B, or 34.9% of revenue versus an 18.3% five-year average, taking FY2026 FCF down to $67.0B ($182.9B of operating cash flow minus $115.9B of capex) and the FCF margin to ~20% versus a 28.9% five-year mean. In the June quarter alone, capex was $41.0B, and FCF fell 23% year-over-year.
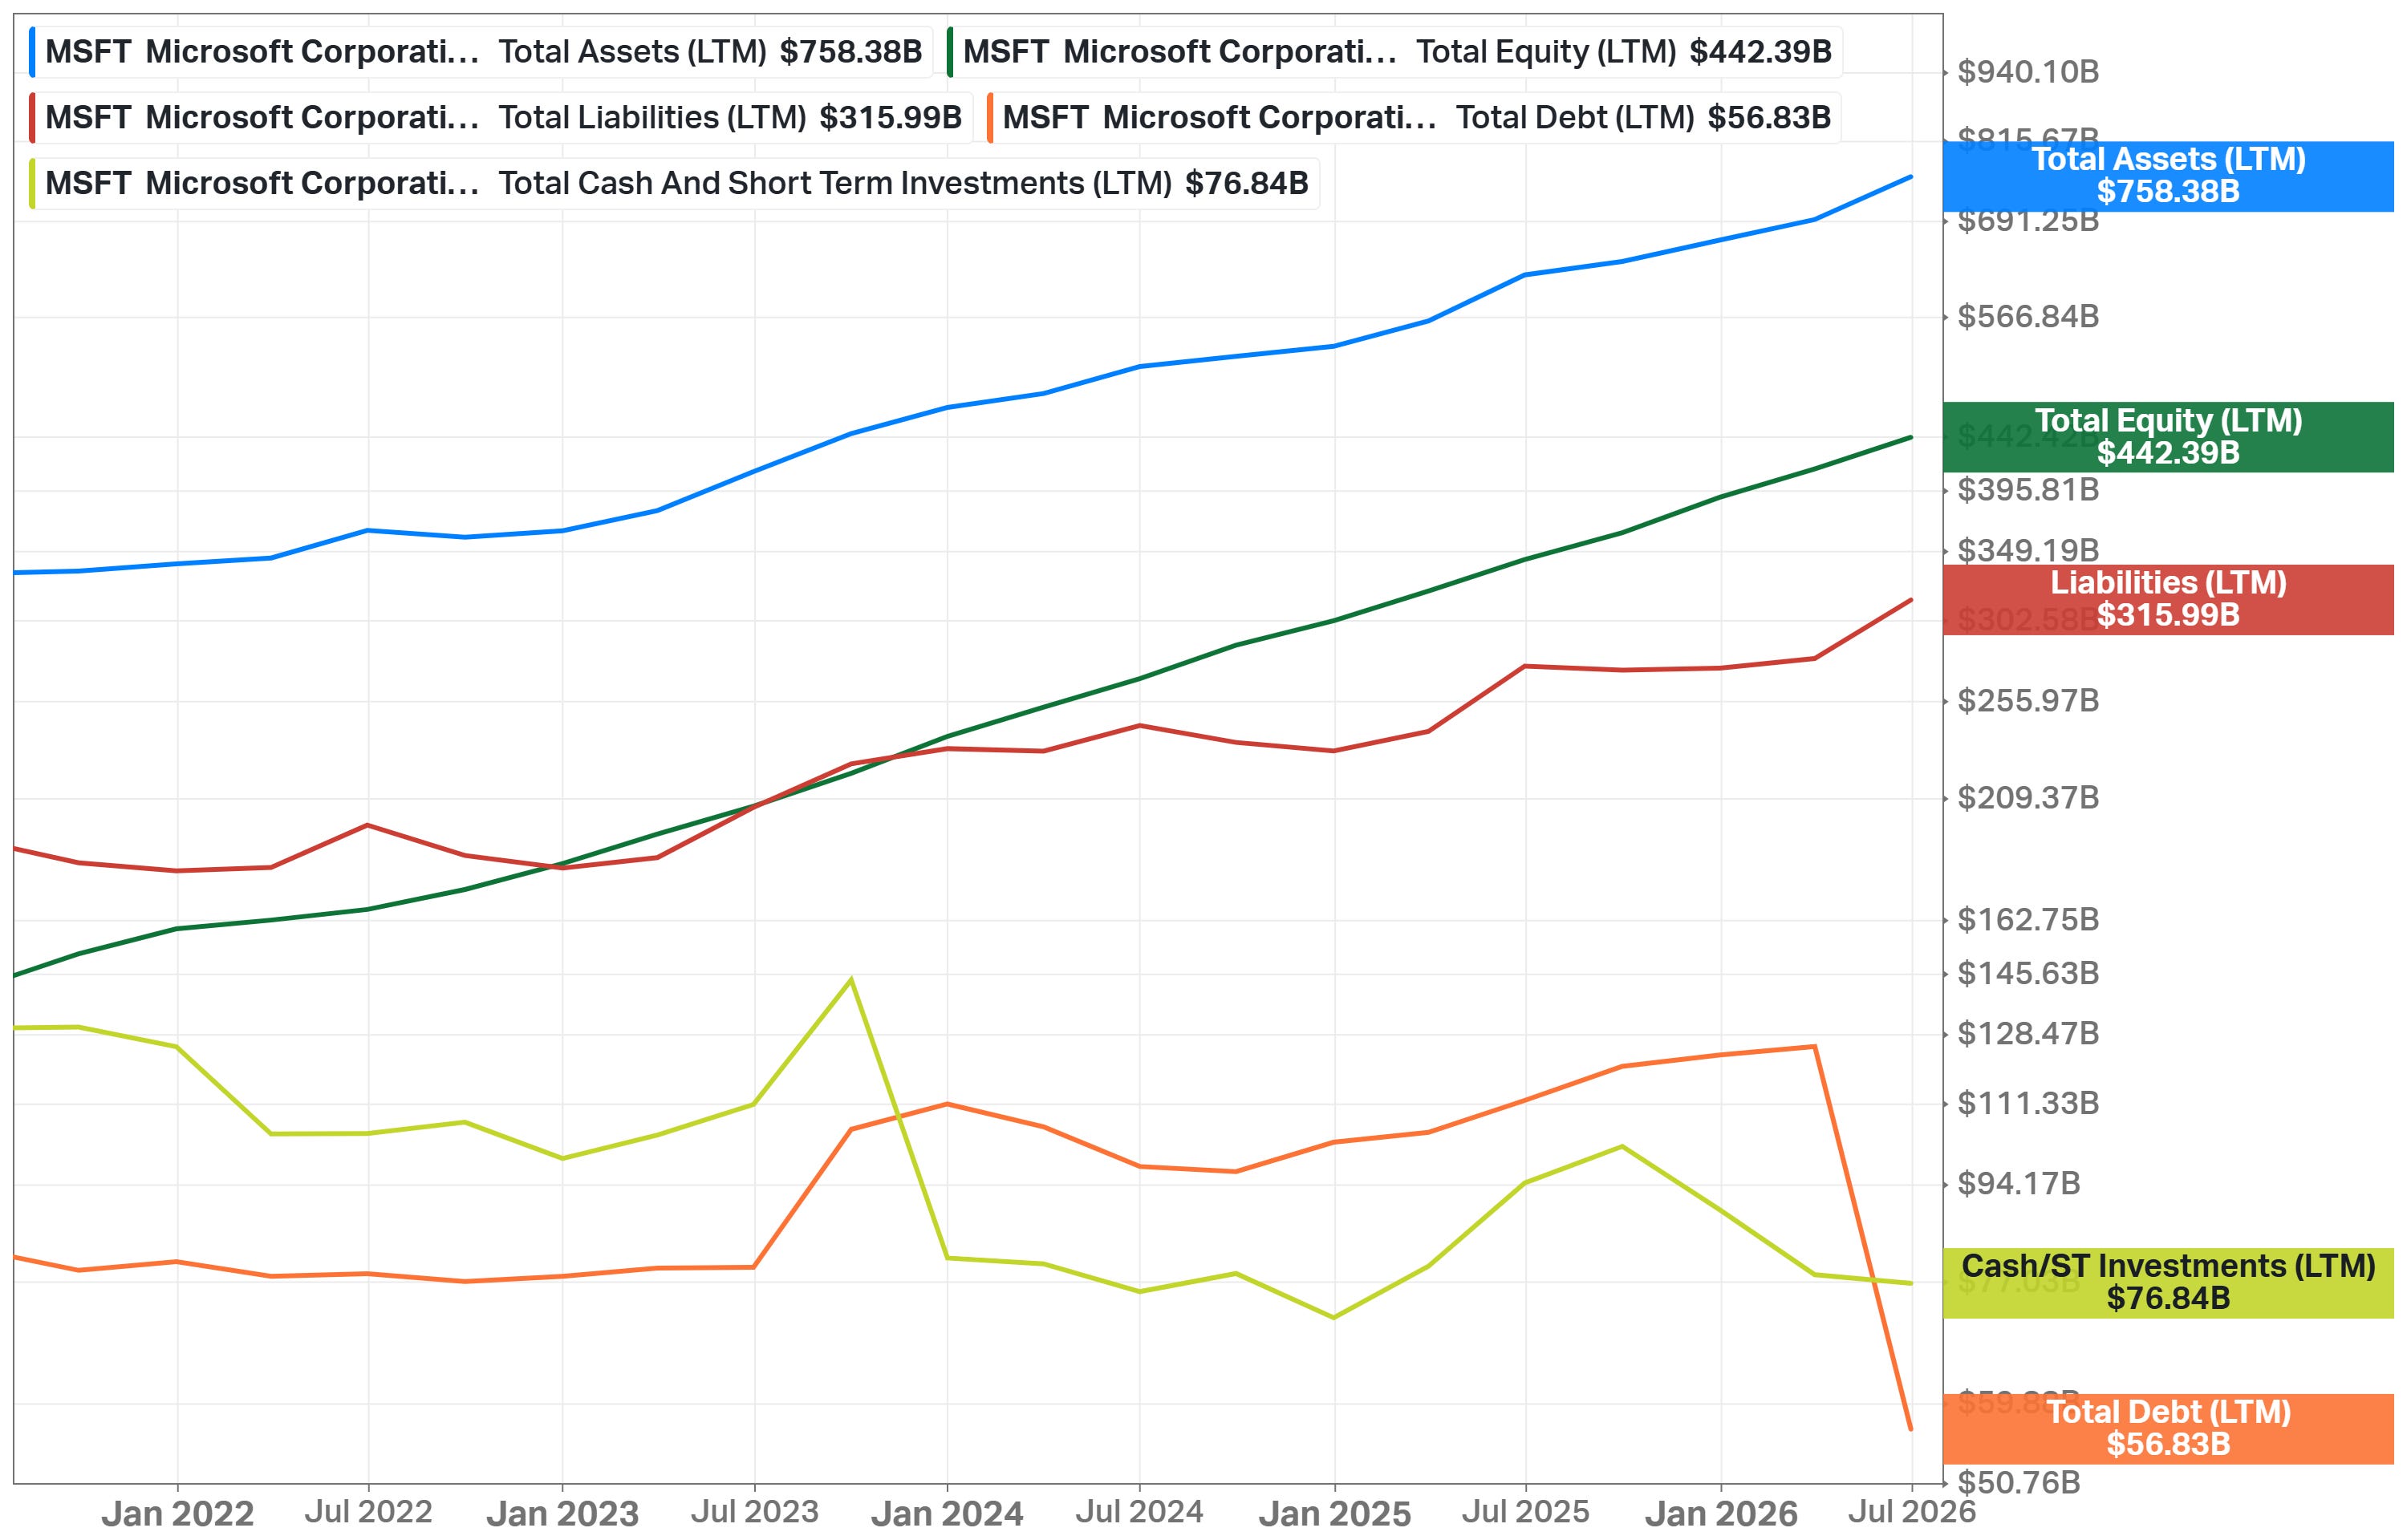
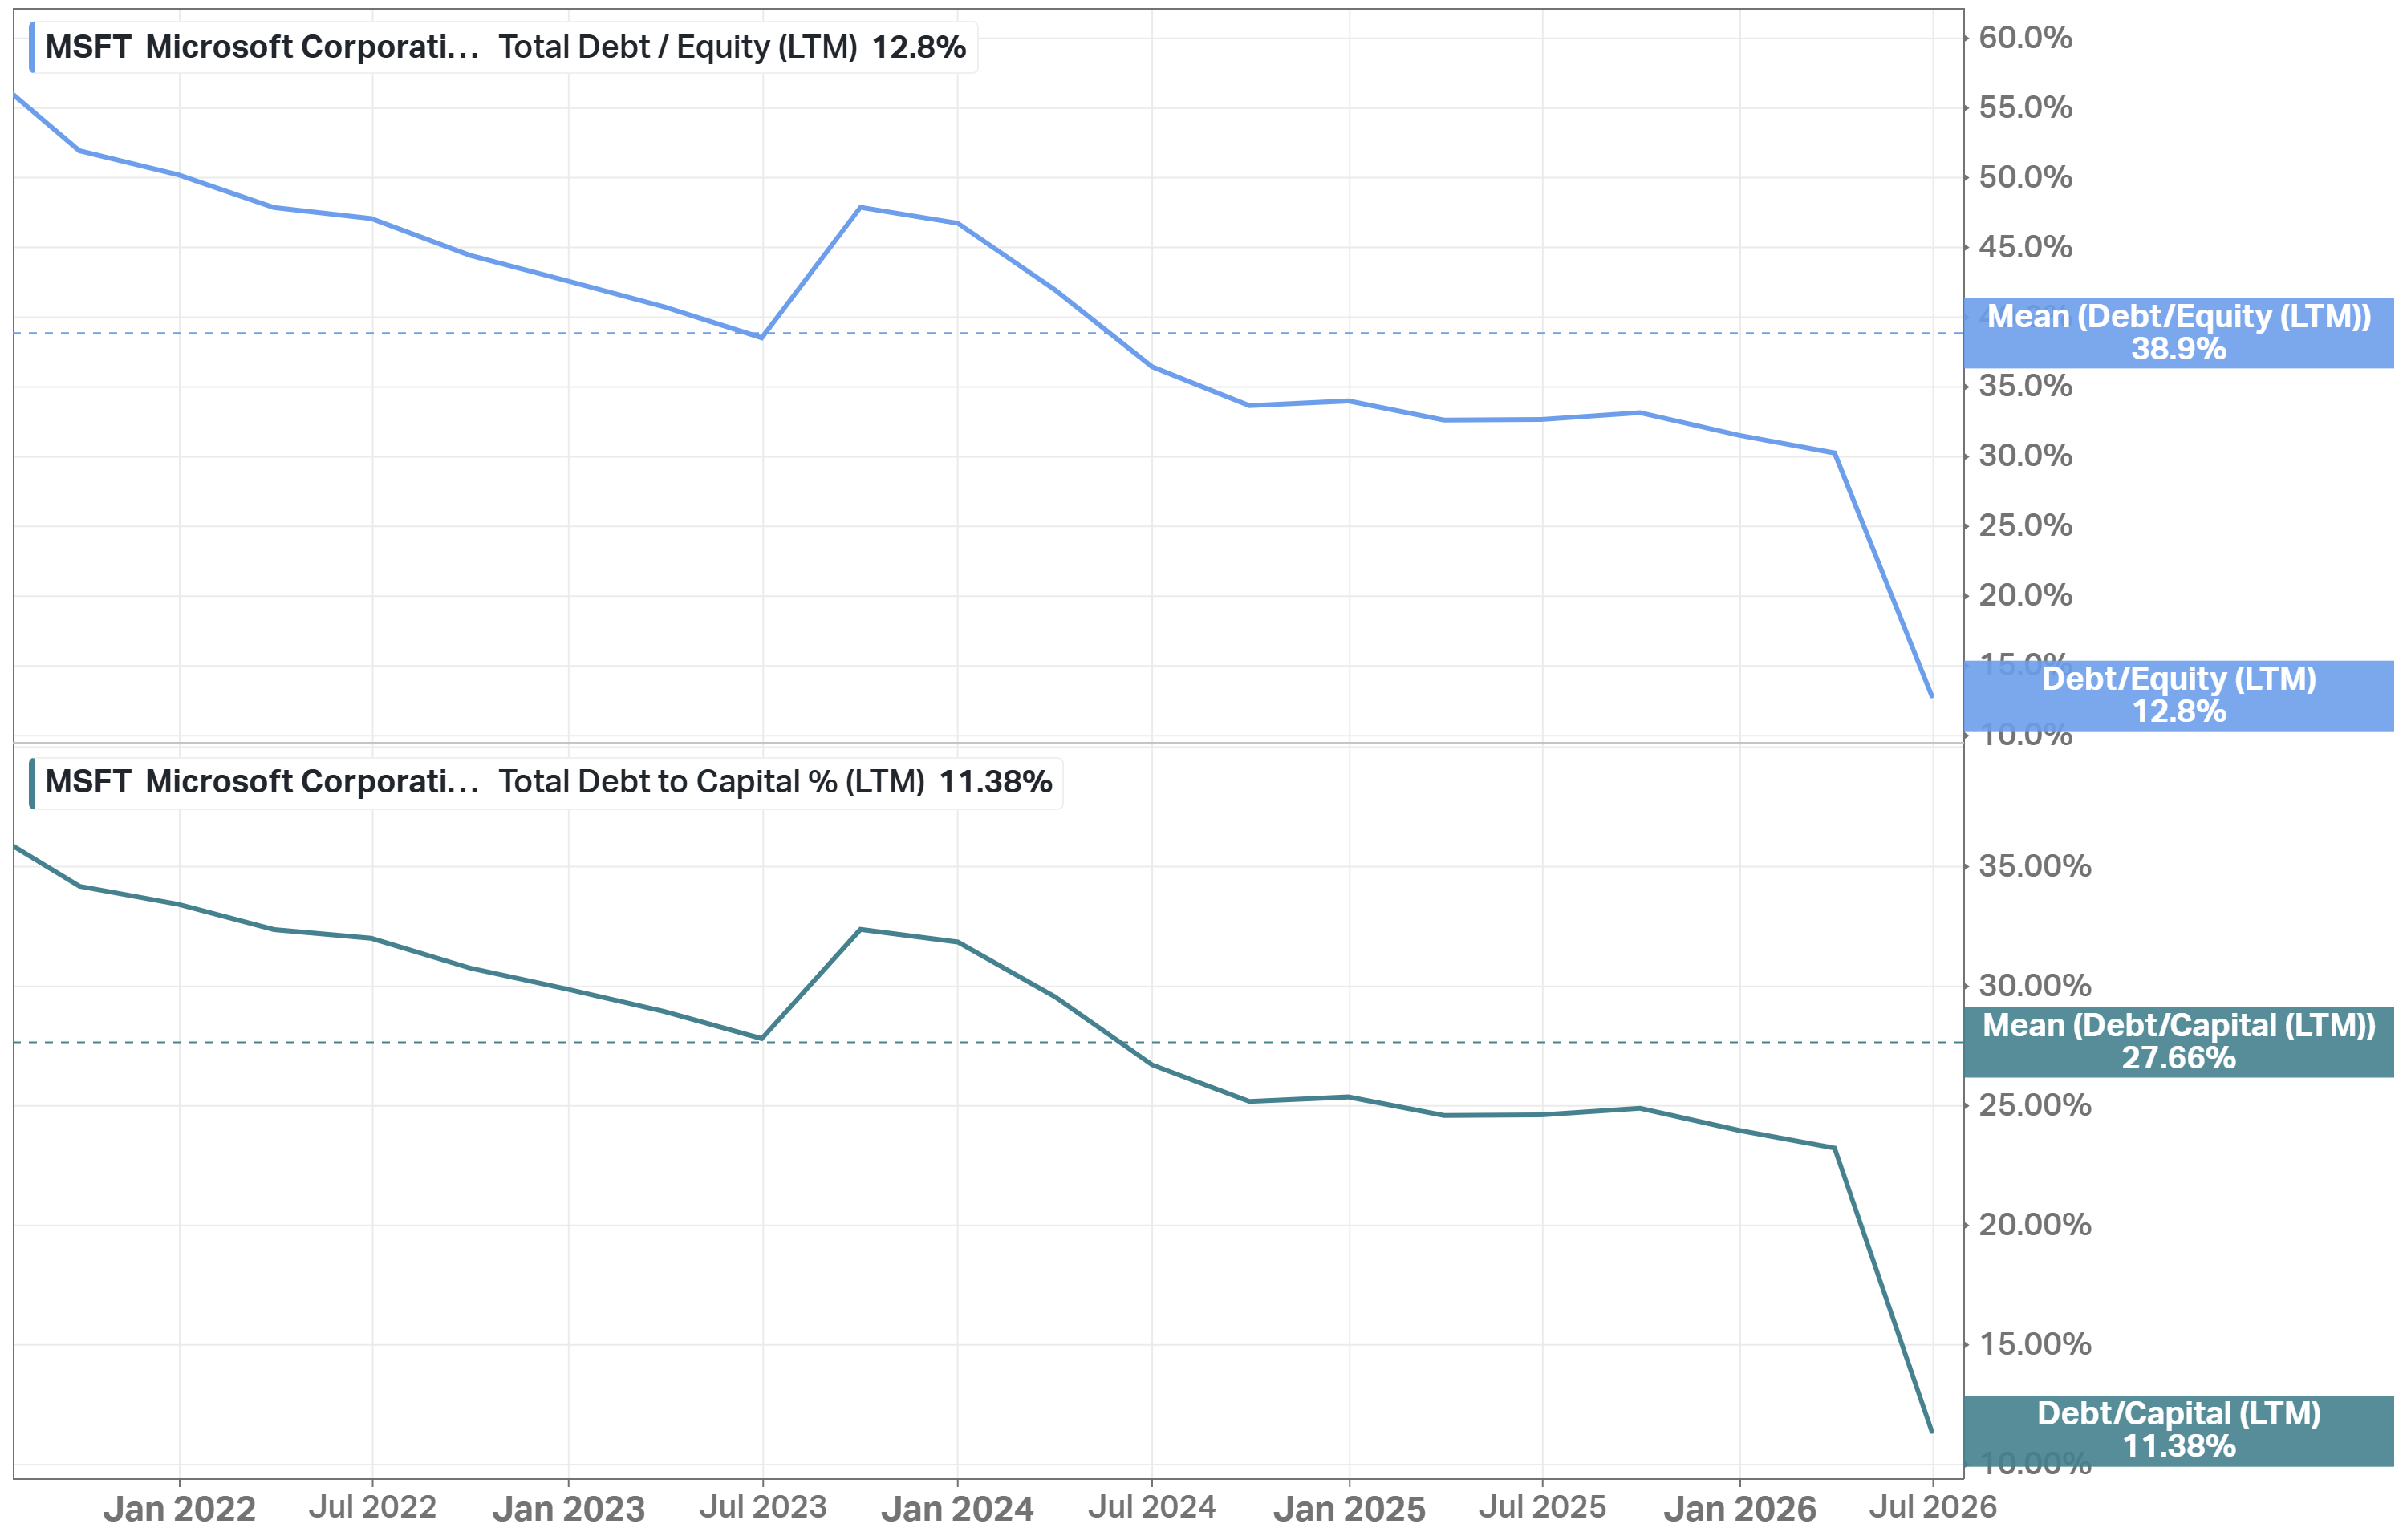
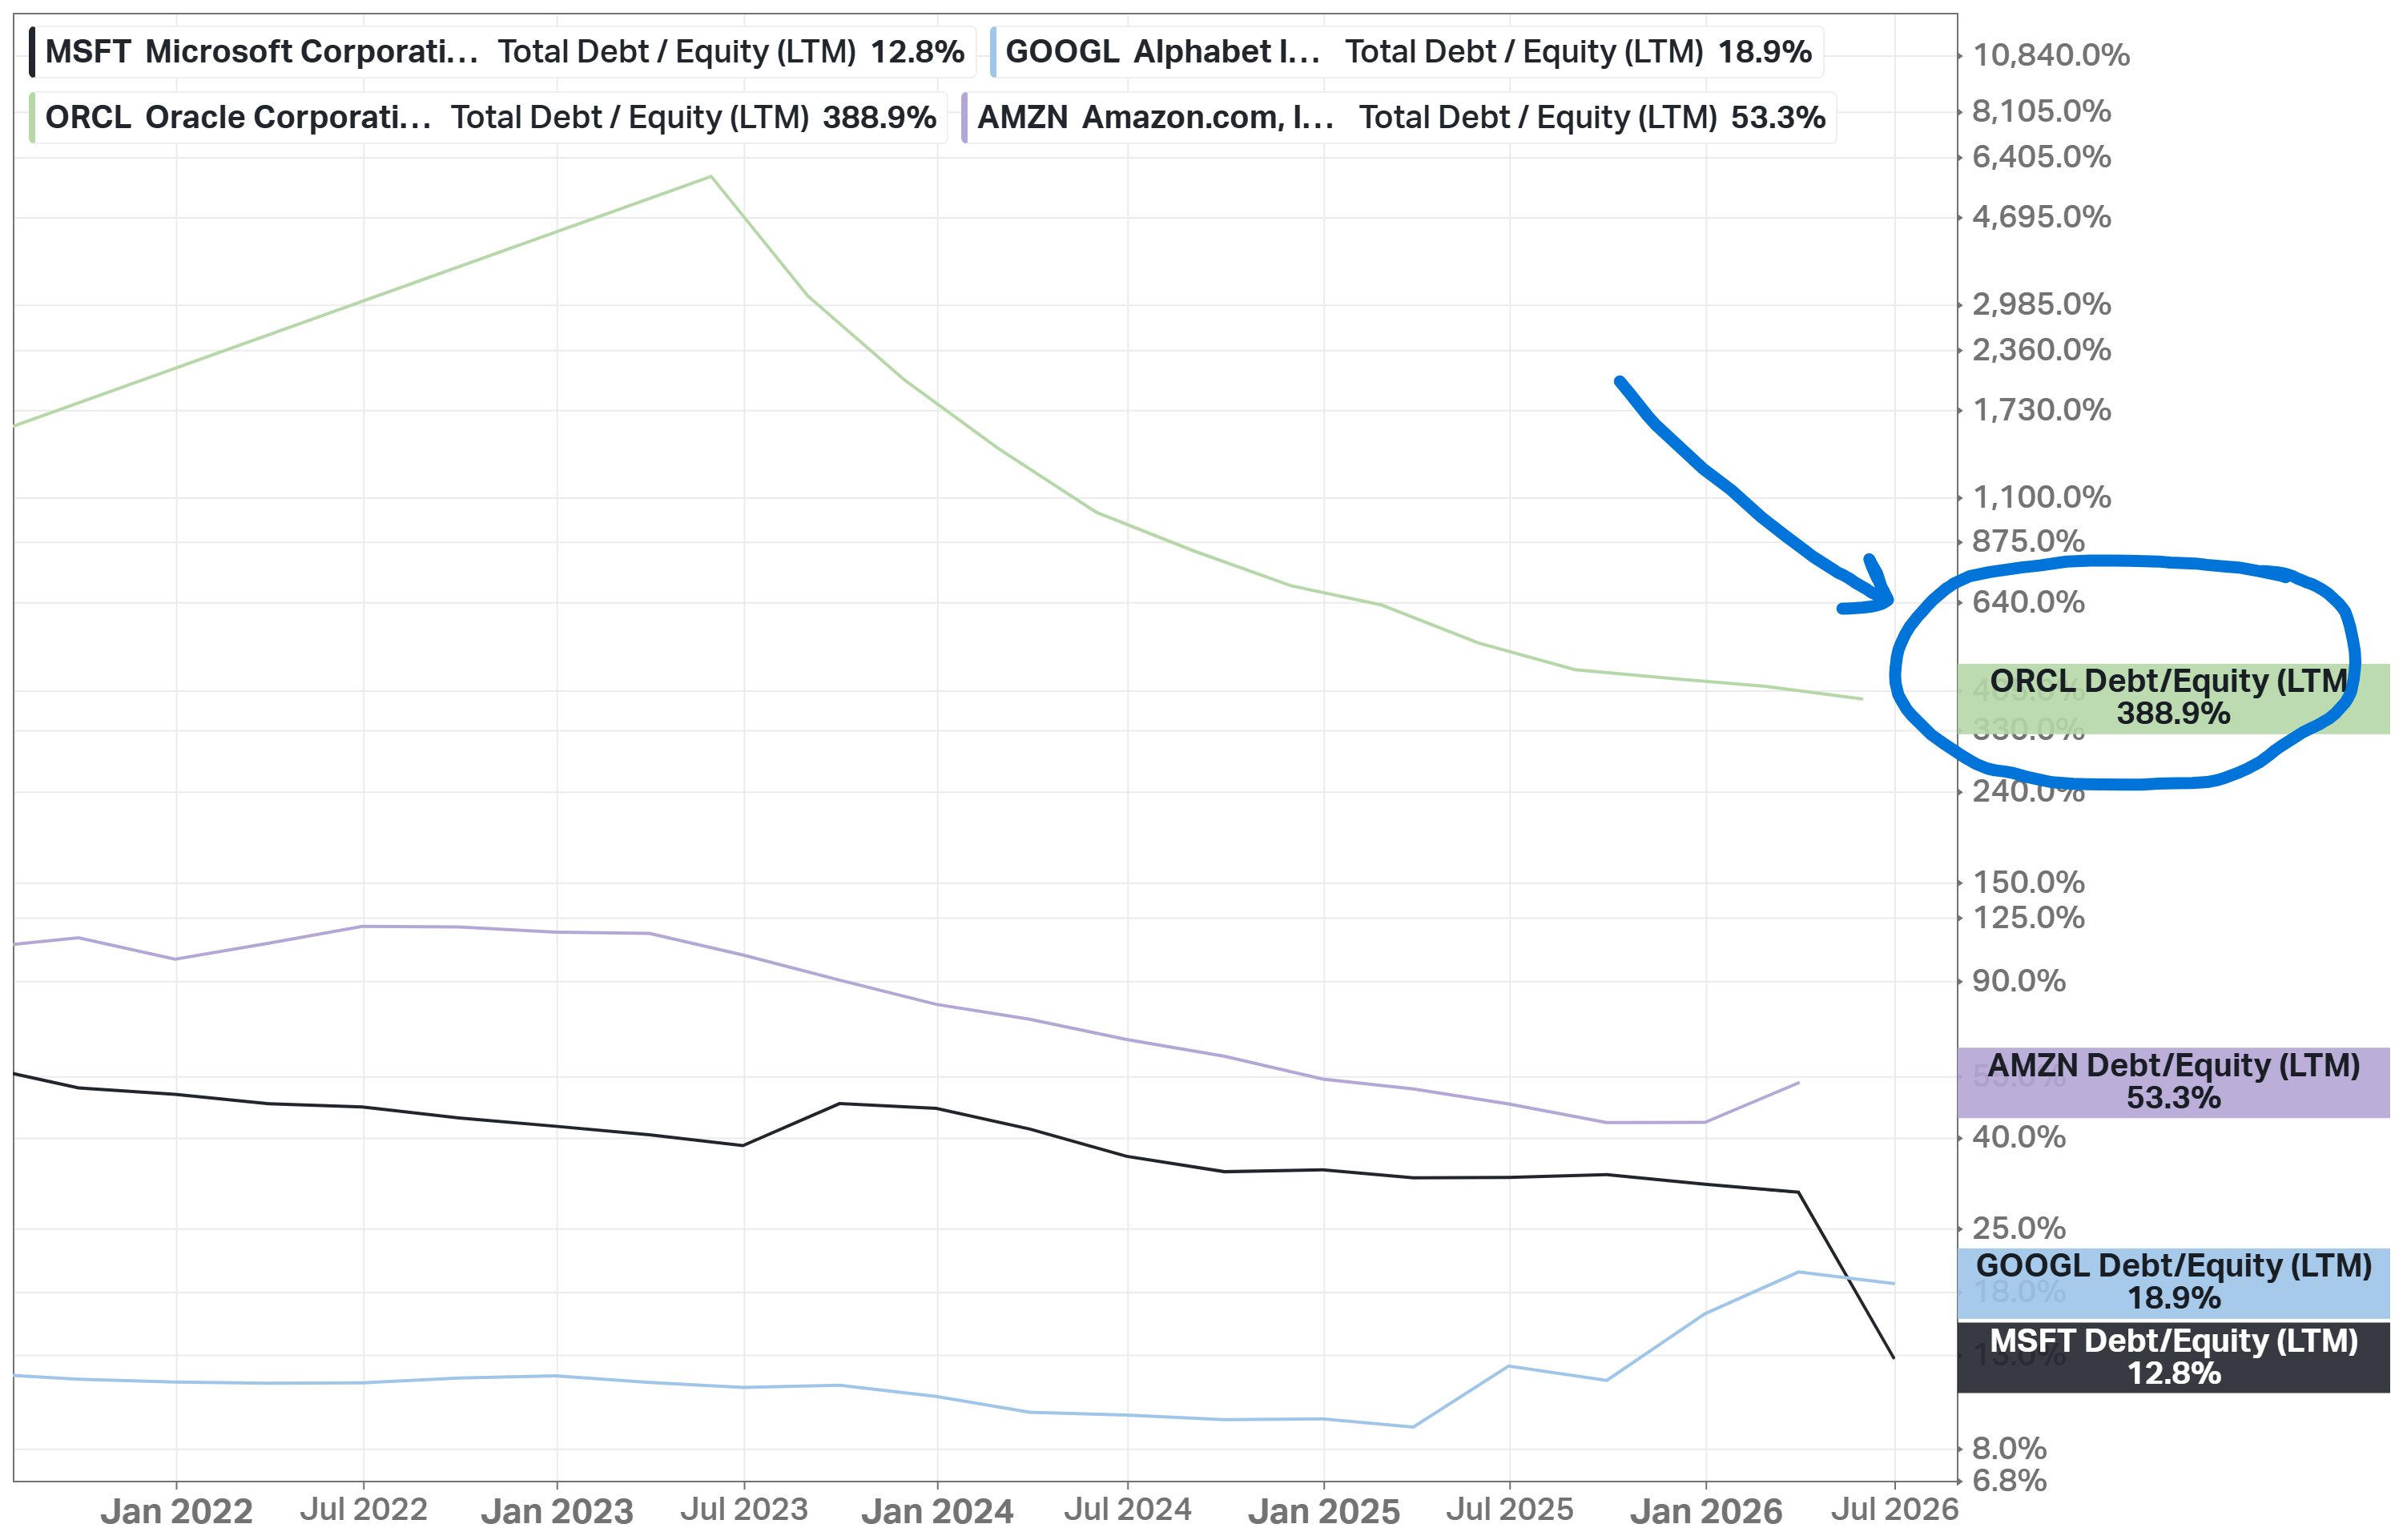
Management's defense. Roughly two-thirds of capex is short-lived assets (CPUs and GPUs) bought against demand that is already contracted in the $678B RPO, and the June quarter came in above guidance. The balance sheet can afford the bet: $76.8B of cash and investments against $56.8B of total debt (including leases). A net cash position, with debt-to-equity of just 12.8% versus a 38.9% five-year mean.
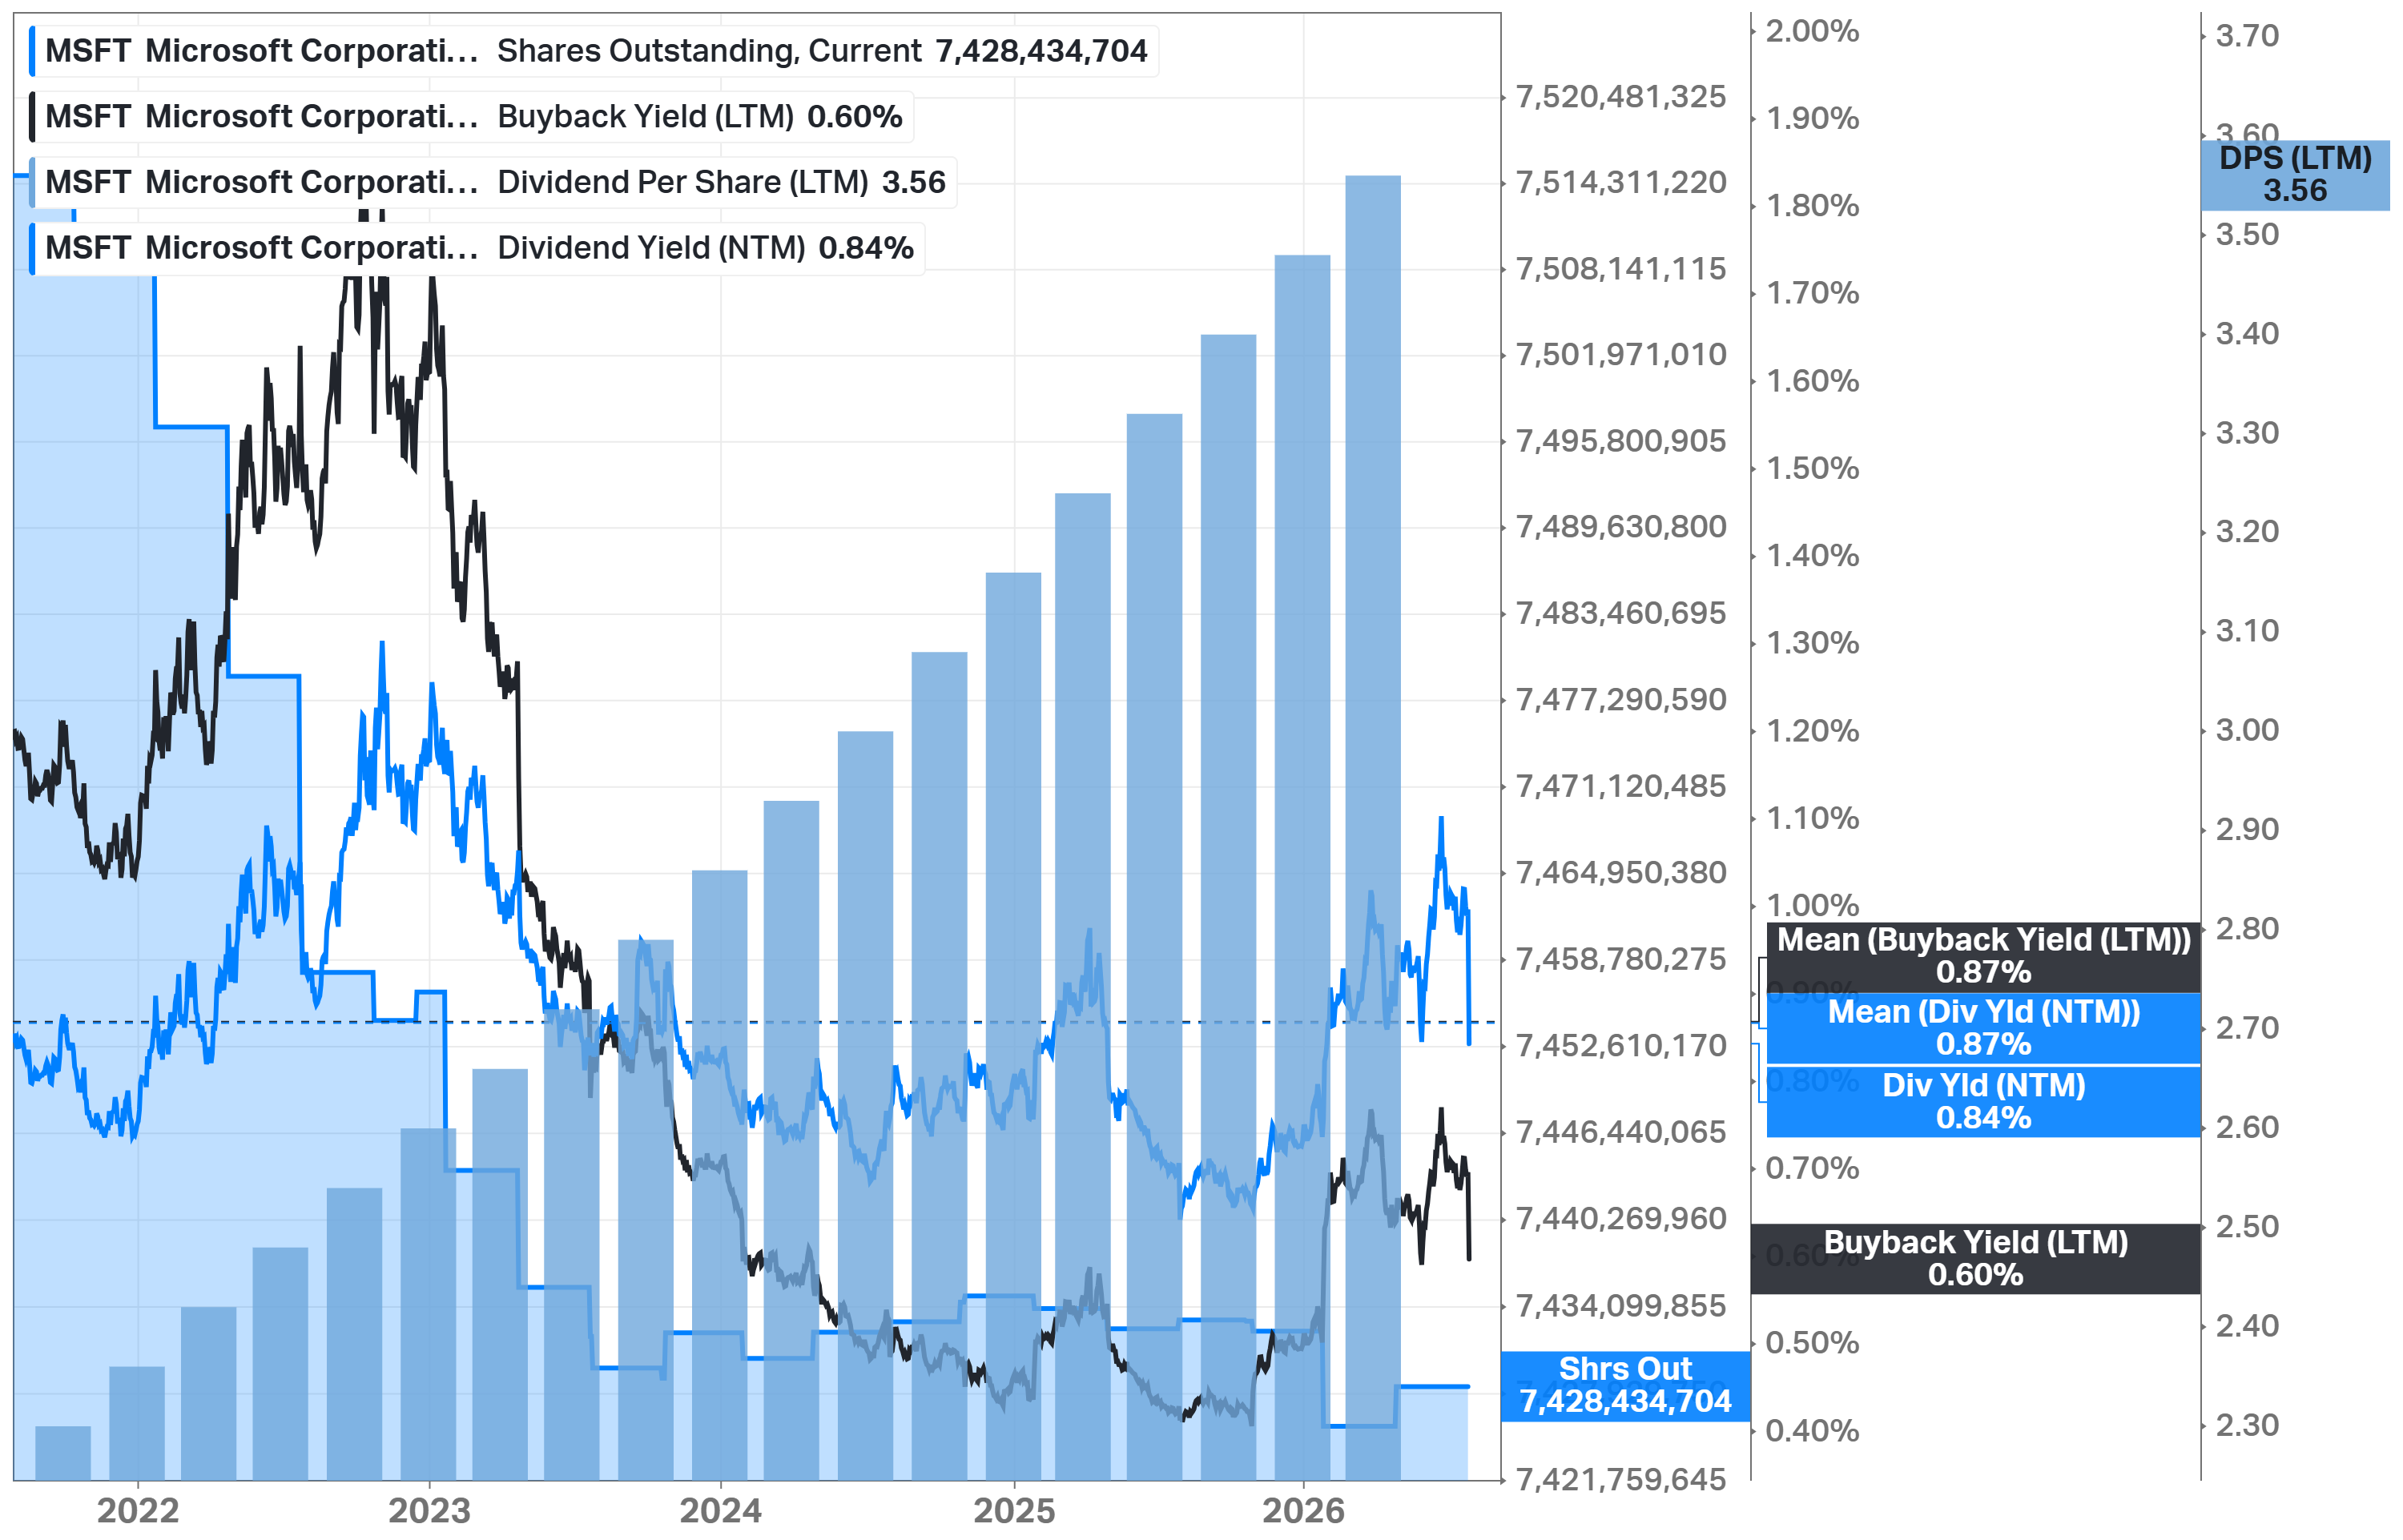
Shareholder returns continue. $48.7B returned in FY2026 ($26.4B in dividends, $22.3B in buybacks), the 21st consecutive annual dividend increase (quarterly $0.91, payout ratio under 20%). And a share count that still declines slightly every year. Stock-based compensation is a disciplined 3.9% of revenue. The trade-off is explicit: shareholder yield of 1.47% versus a 1.83% five-year mean, because the marginal dollar goes into data centers.
Advantages
The distribution monopoly. Hundreds of millions of commercial seats across Microsoft 365, Windows, and Entra. Every AI product Microsoft ships lands on an installed base no competitor can replicate, at near-zero customer acquisition cost.
The fastest-growing hyperscaler. Azure crossed $100B in annual revenue while full-year growth accelerated to 41% from 35% in FY2025. And the exit rate is even higher: 43% in the June quarter, with guidance of ~45% for the next one.
Unmatched revenue. $678B of contracted future revenue (up 84%, up 25% excluding OpenAI) with 2.3 years average duration. No other company at this scale shows its next two years of demand in a single line.
A financial fortress under the capex. 68% gross margin, 47% EBIT margin (above its 5-year mean), 40% net margin, 23% ROIC, net cash, and 21 straight years of dividend growth. The quality metrics survived the largest investment cycle in software history.
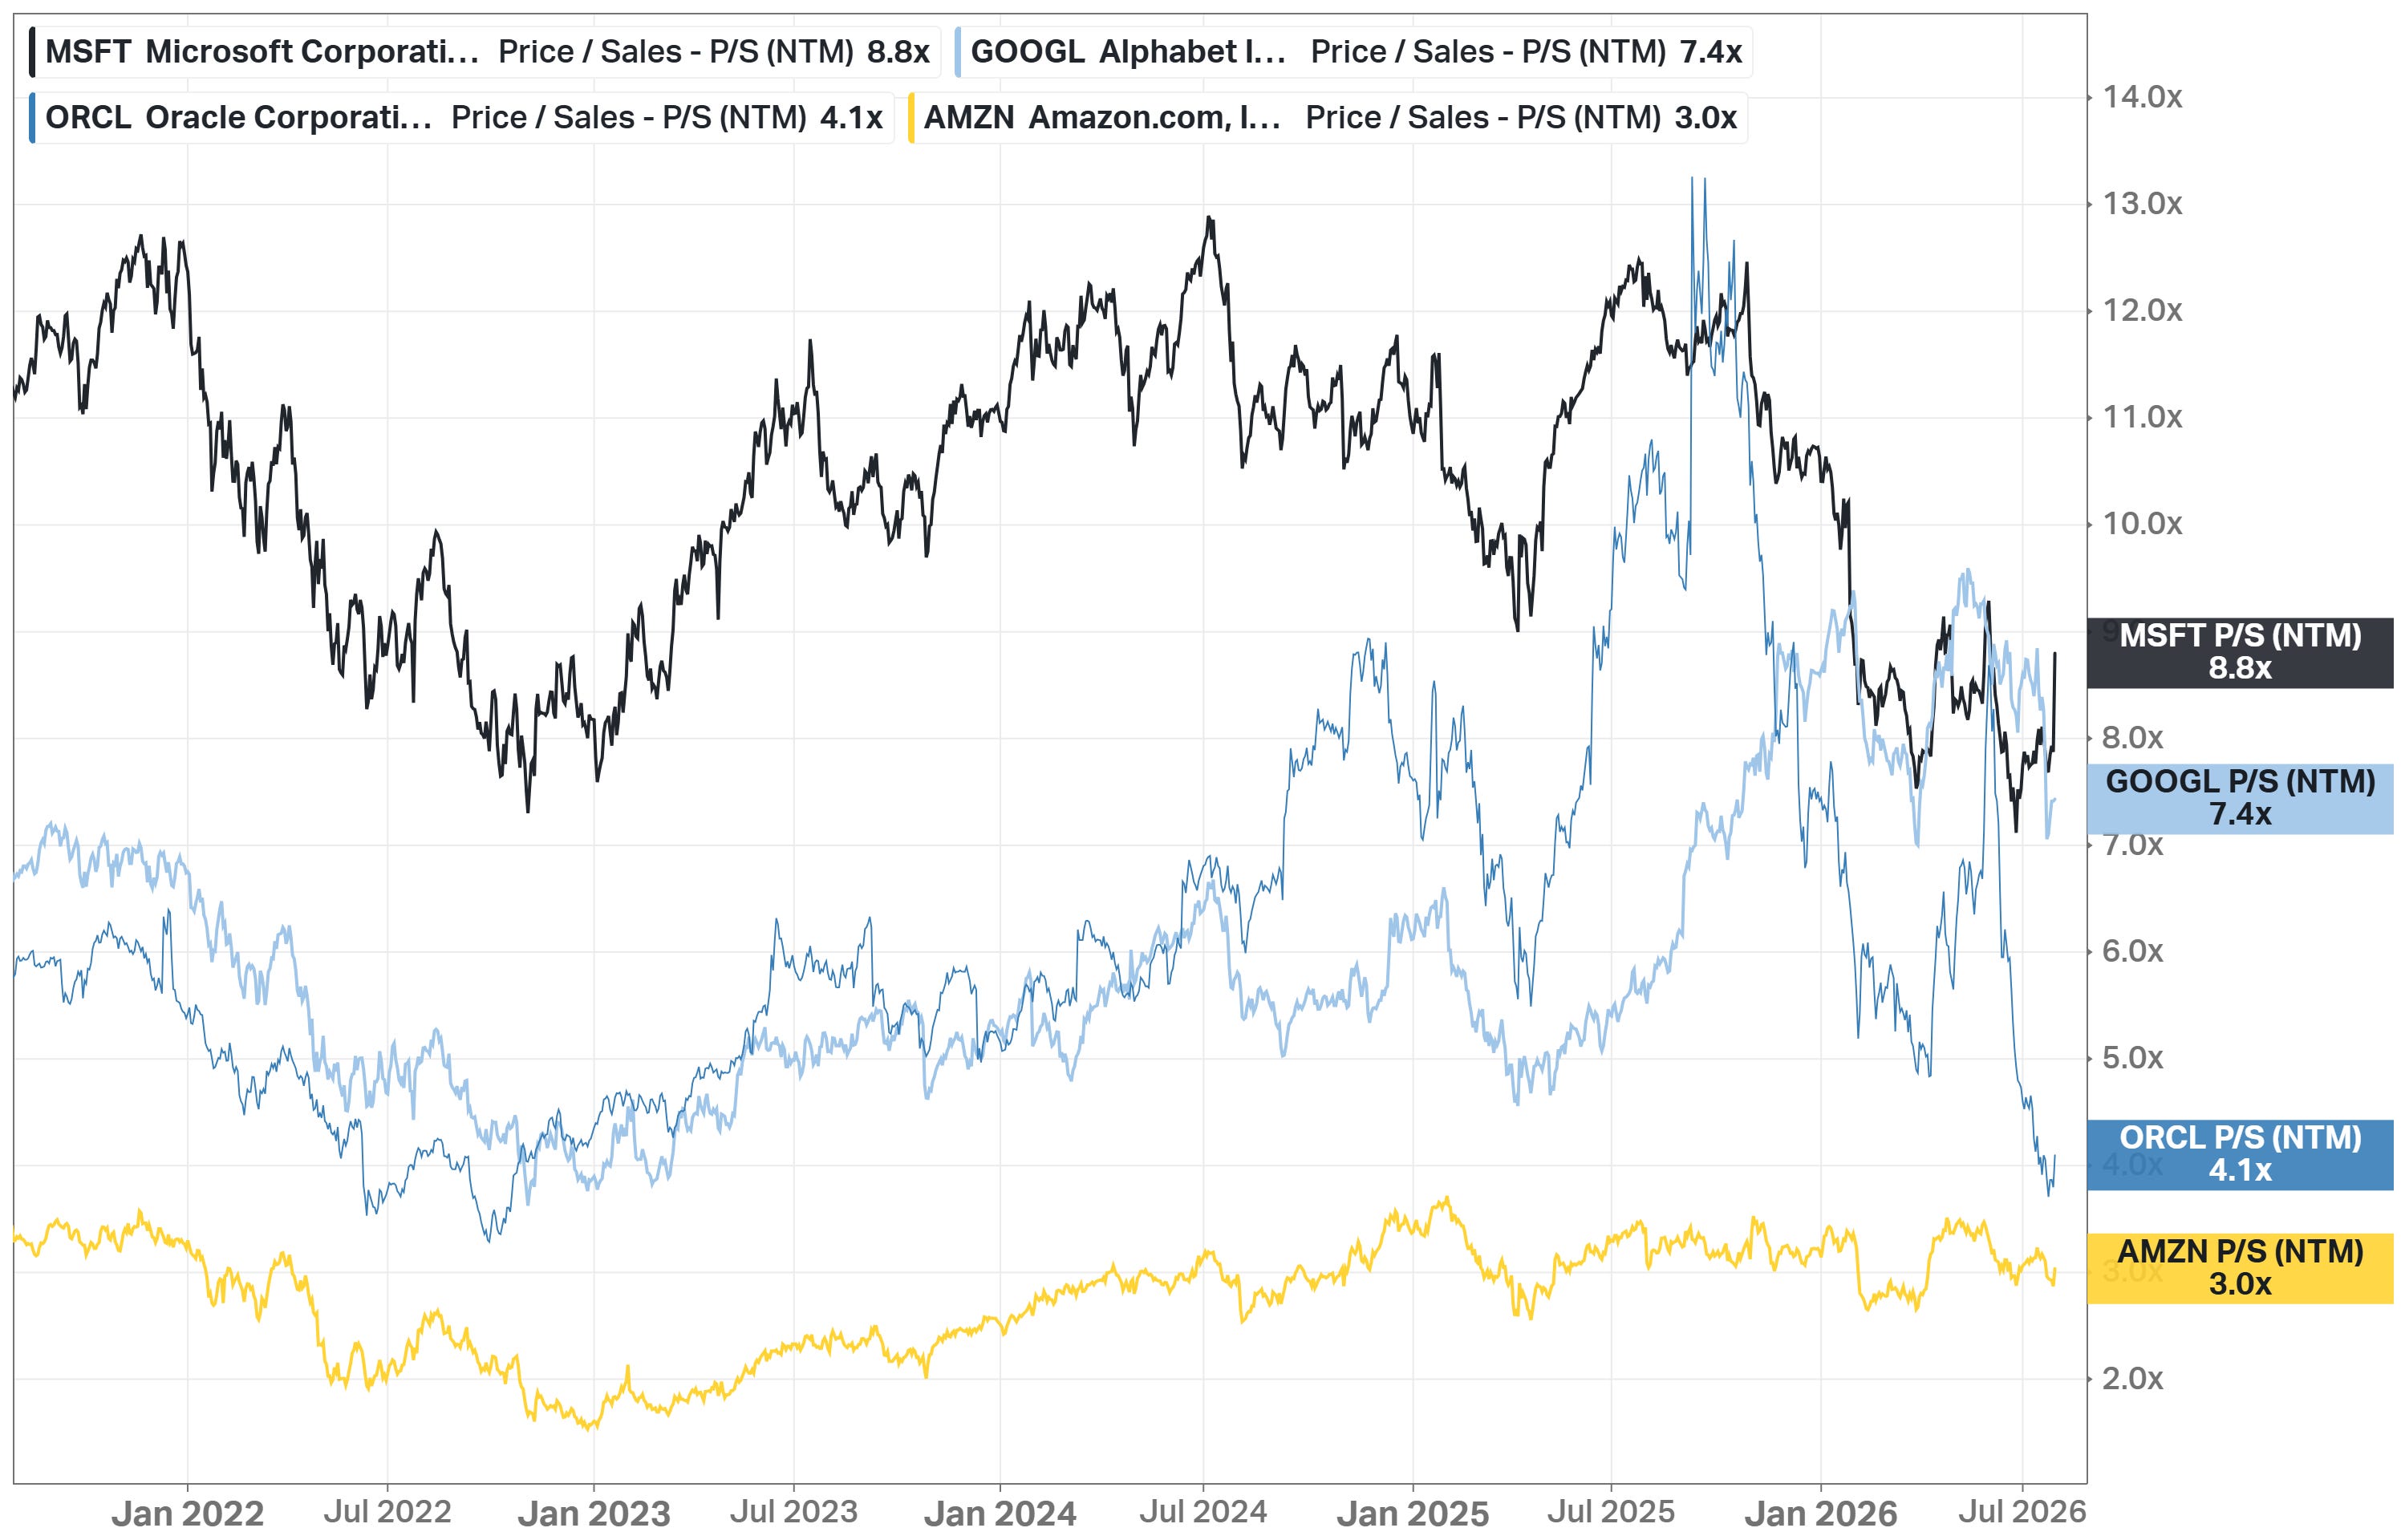
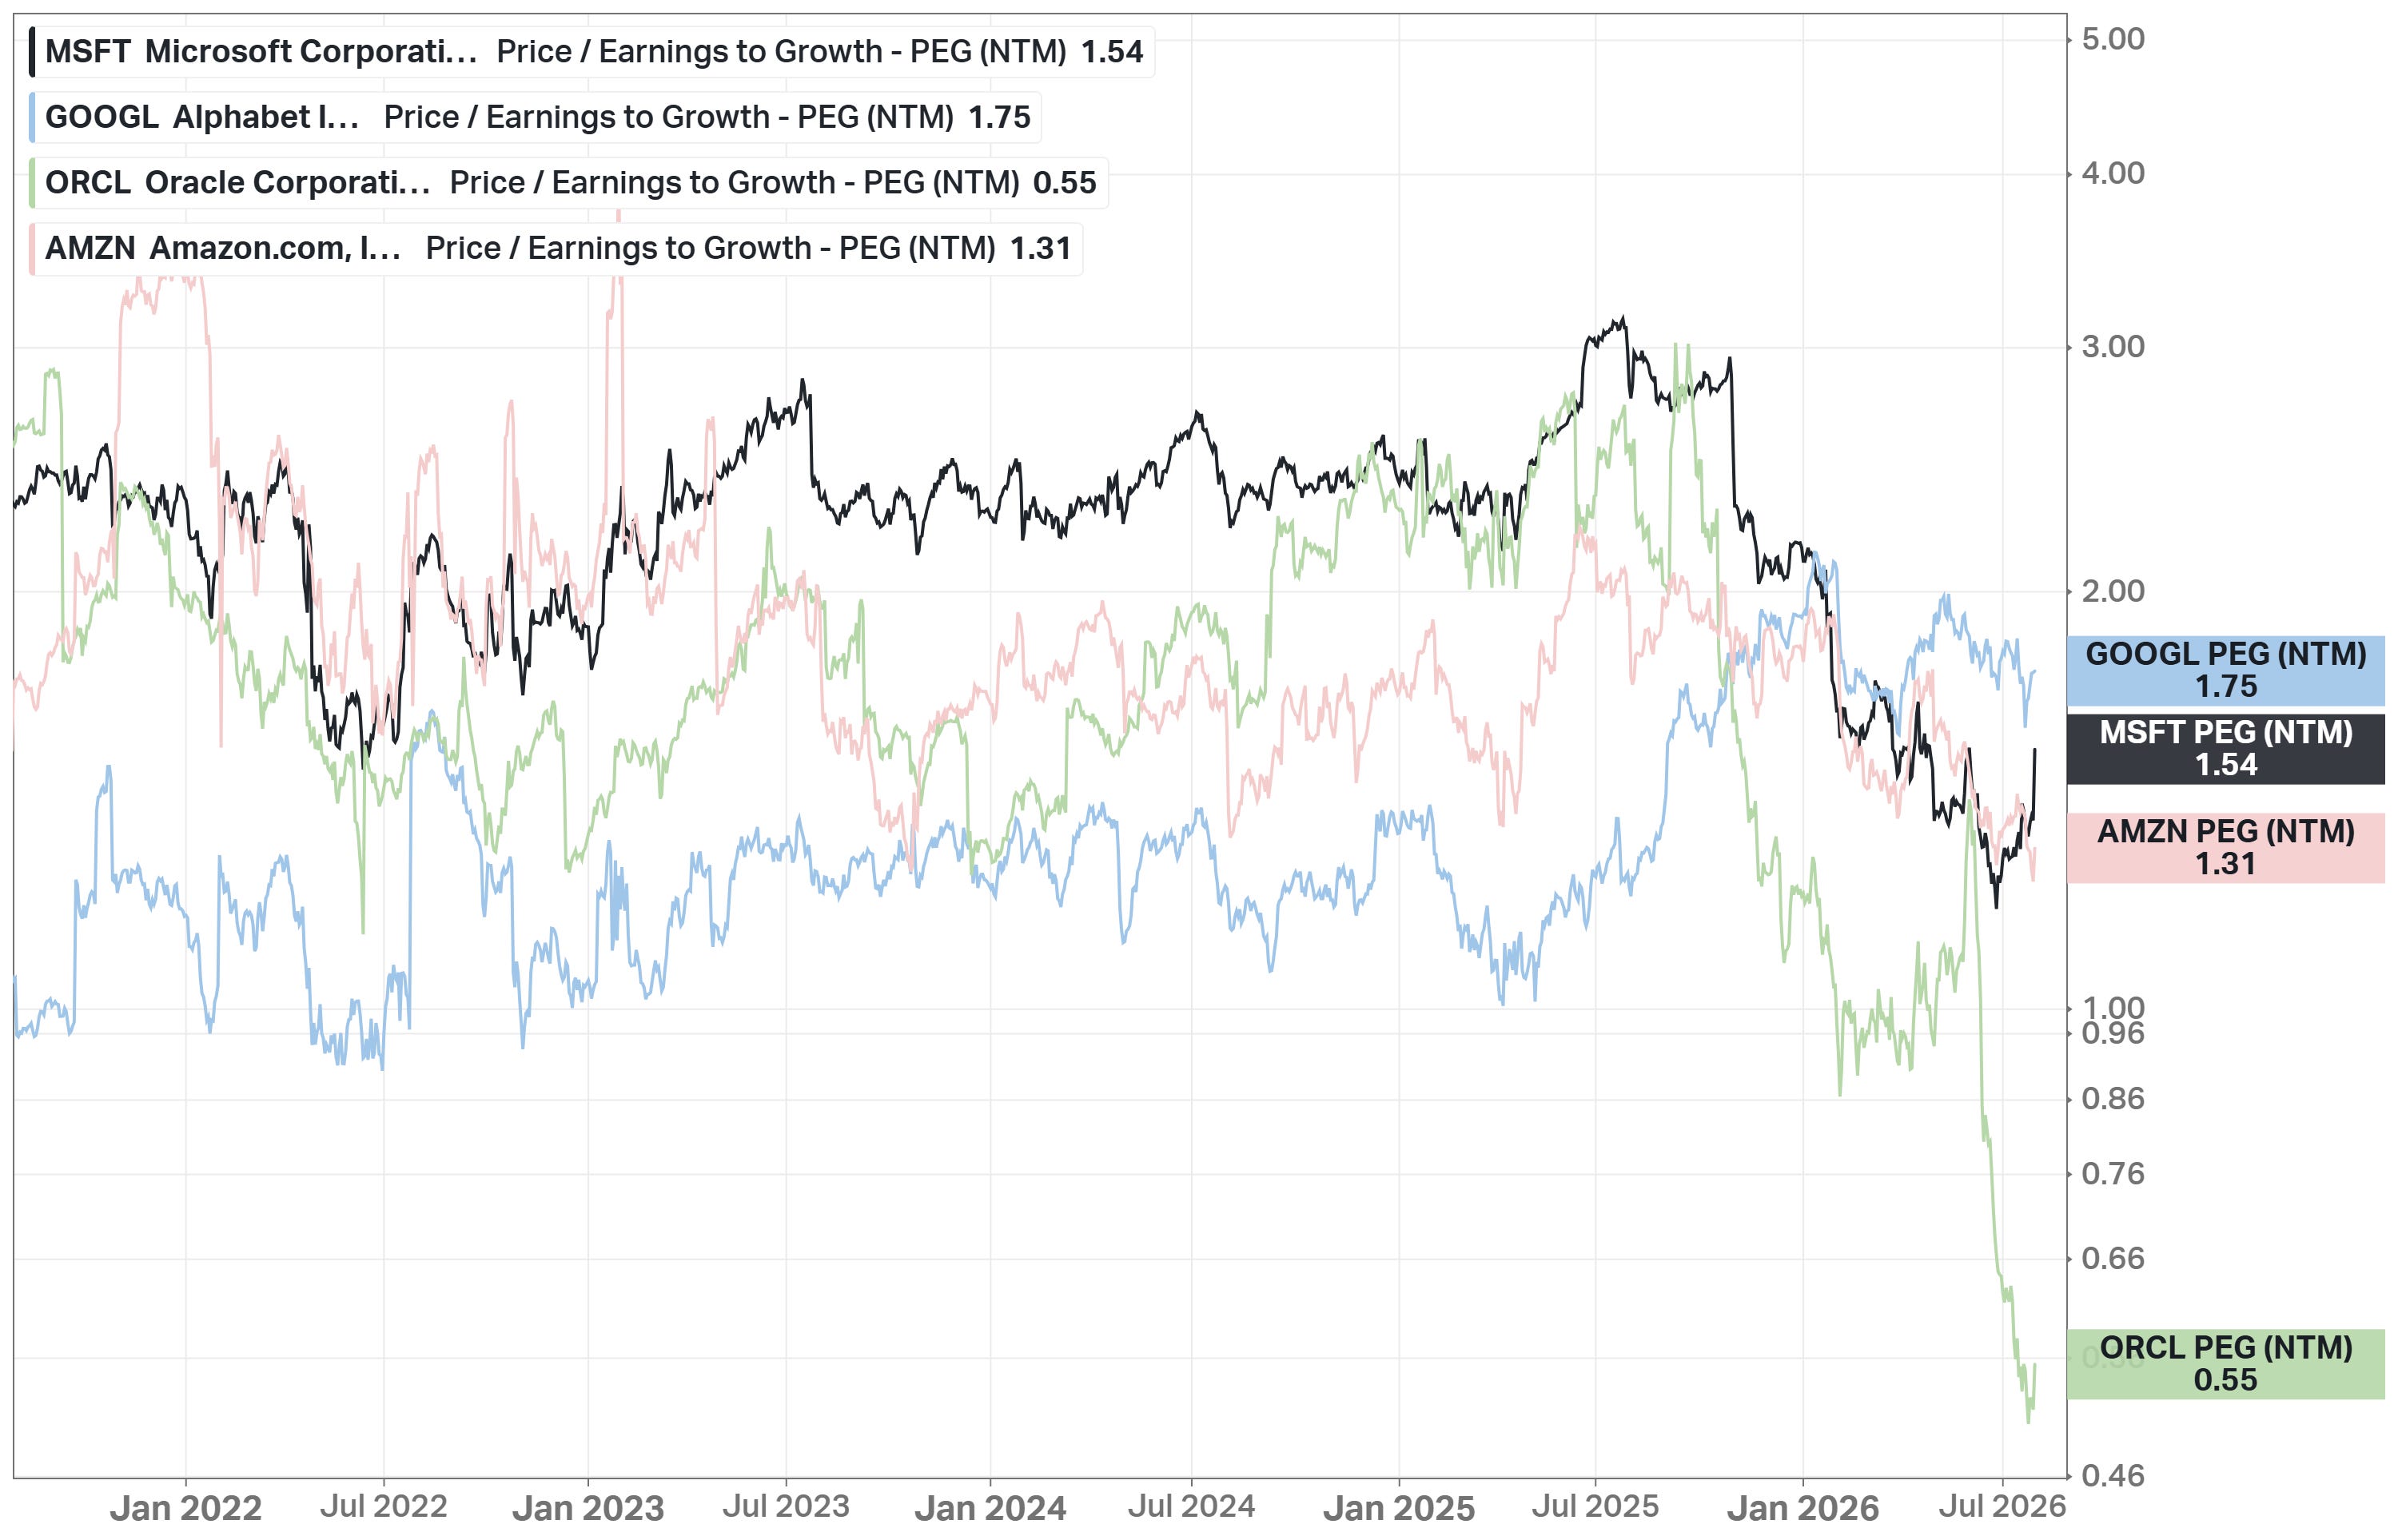
A de-rated multiple. 23.9x forward earnings versus a 29.8x five-year mean (below -1 standard deviation), P/Fwd Sales of 8.8x below its own -1 SD band, PEG of 1.54 versus a 2.23 mean. With a +21% average analyst target.
Disadvantages
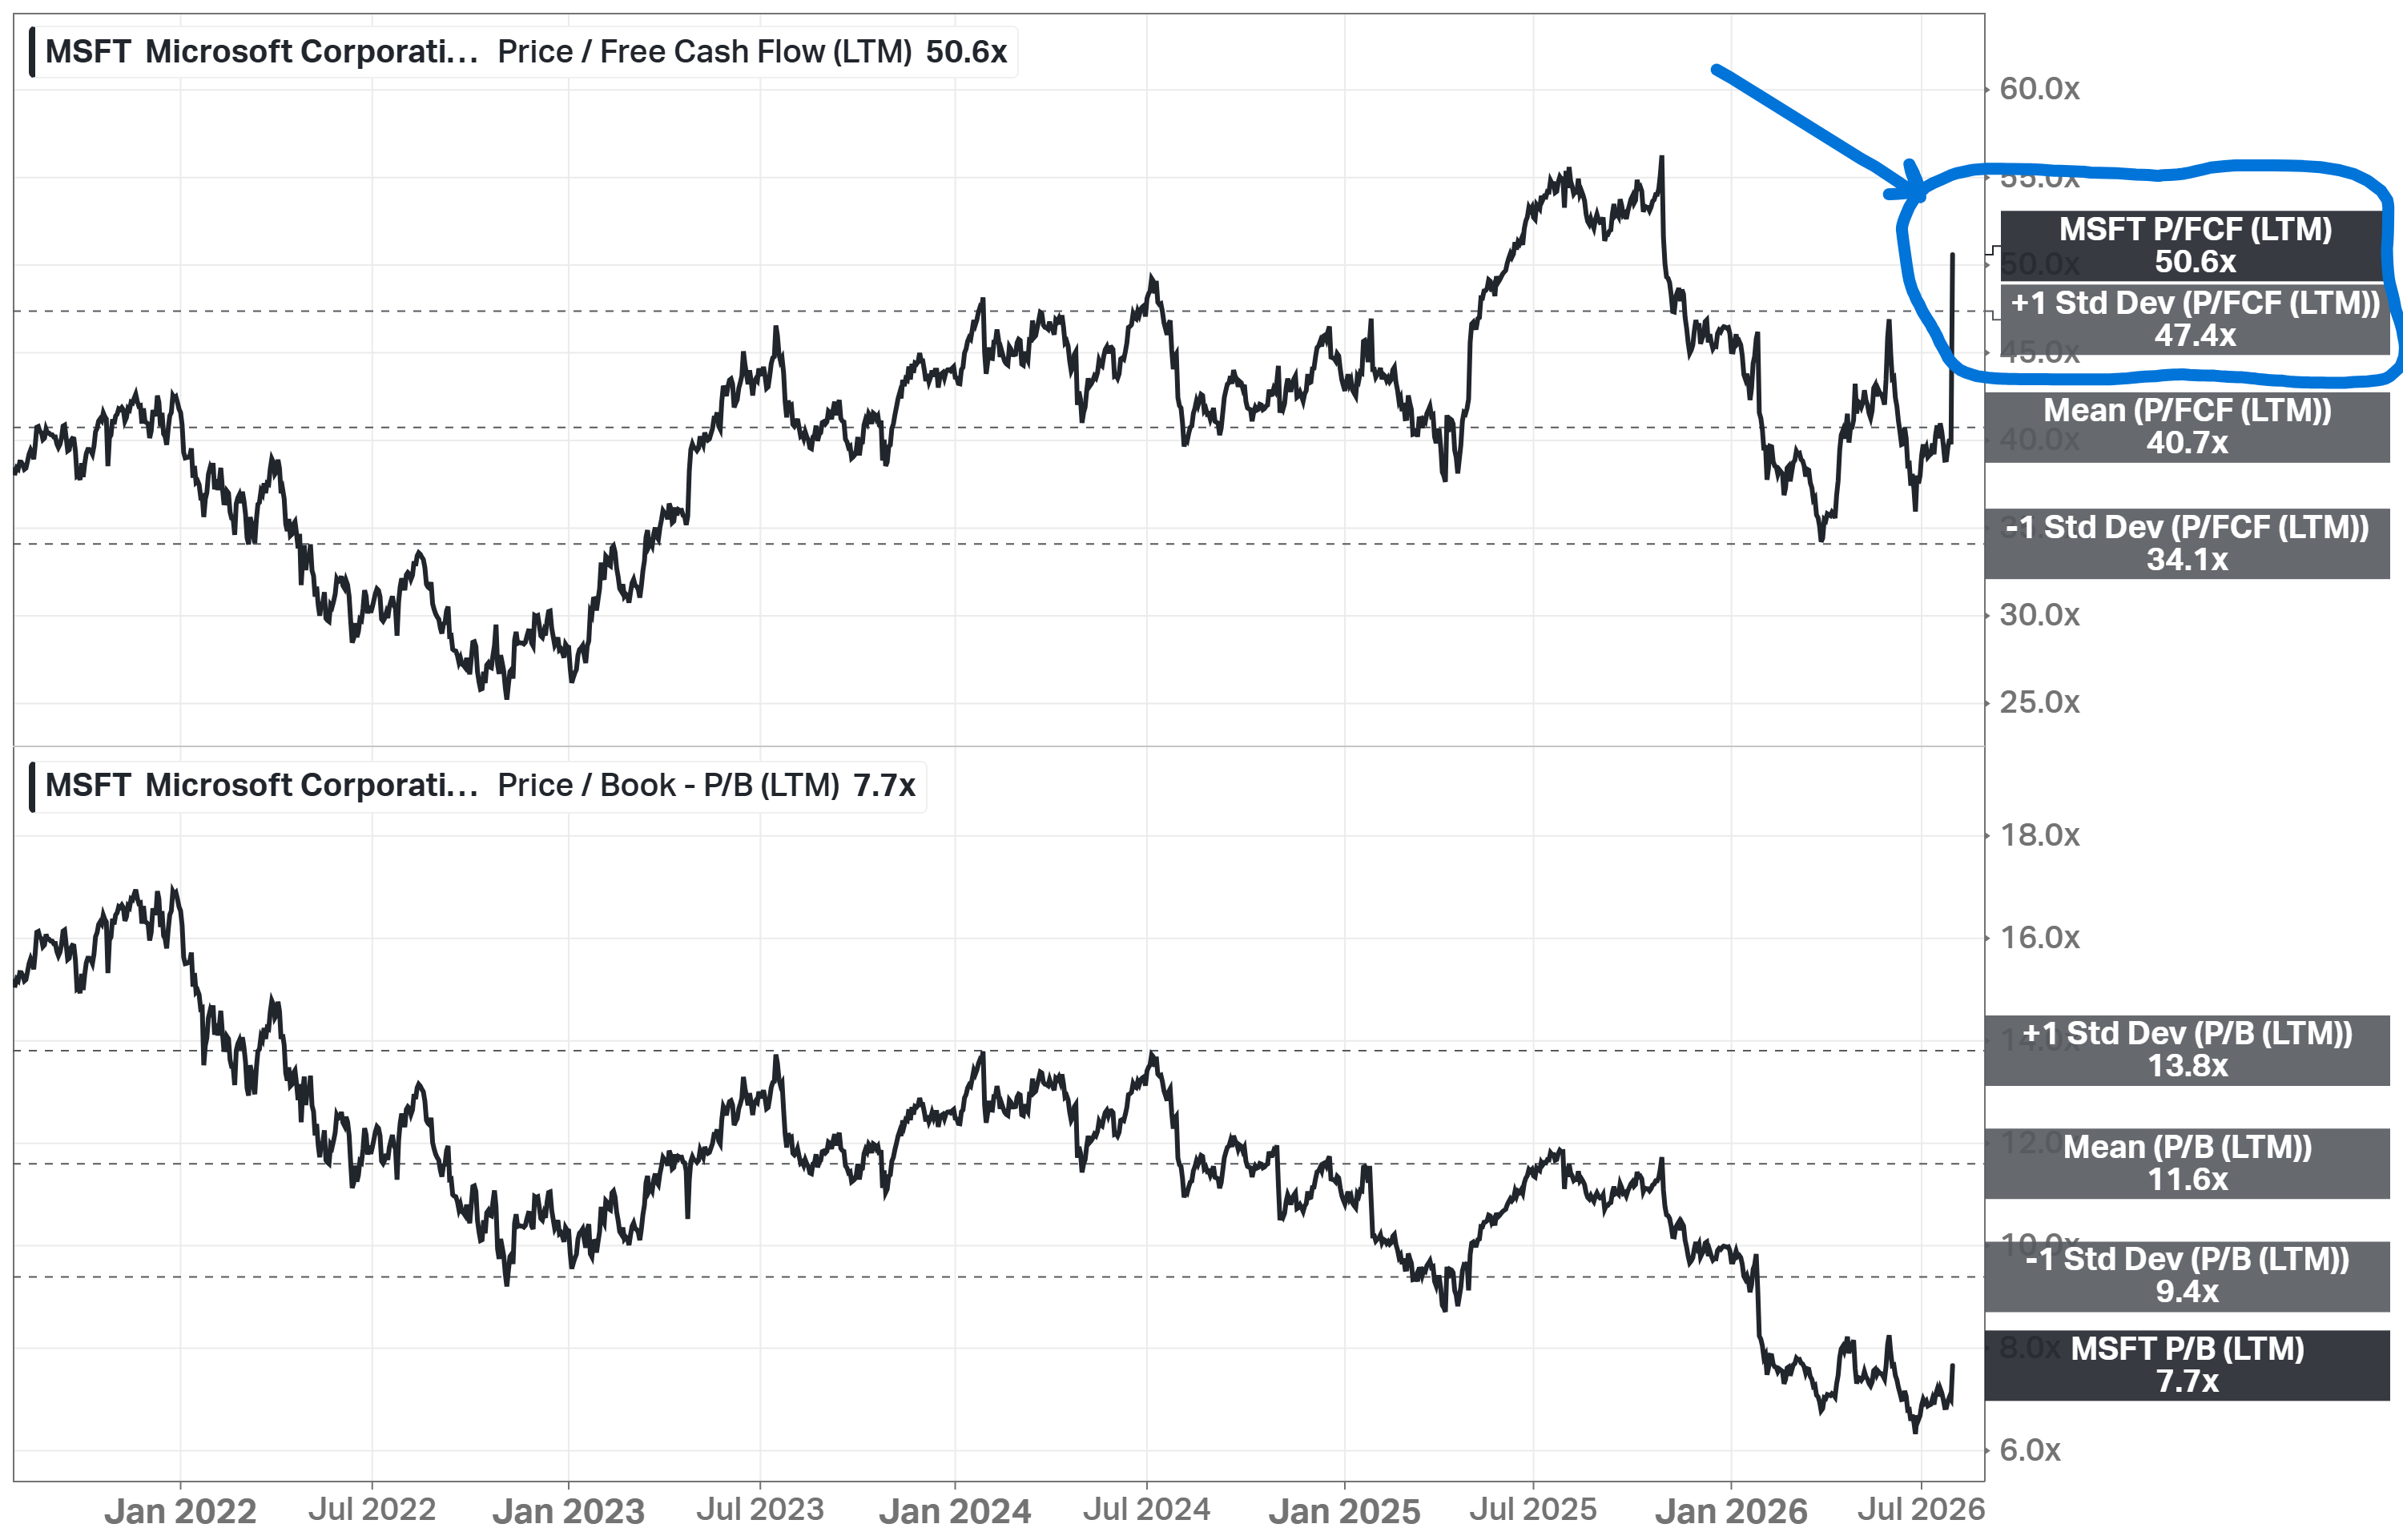
The capex supercycle is eating FCF. Capex at 34.9% of revenue versus an 18.3% average cuts the FCF margin from ~29% to ~20%. P/FCF at 50.6x is above its +1 standard deviation band. If AI revenue disappoints, this spending becomes the largest misallocation in tech history. Depreciation from it will weigh on margins for years.
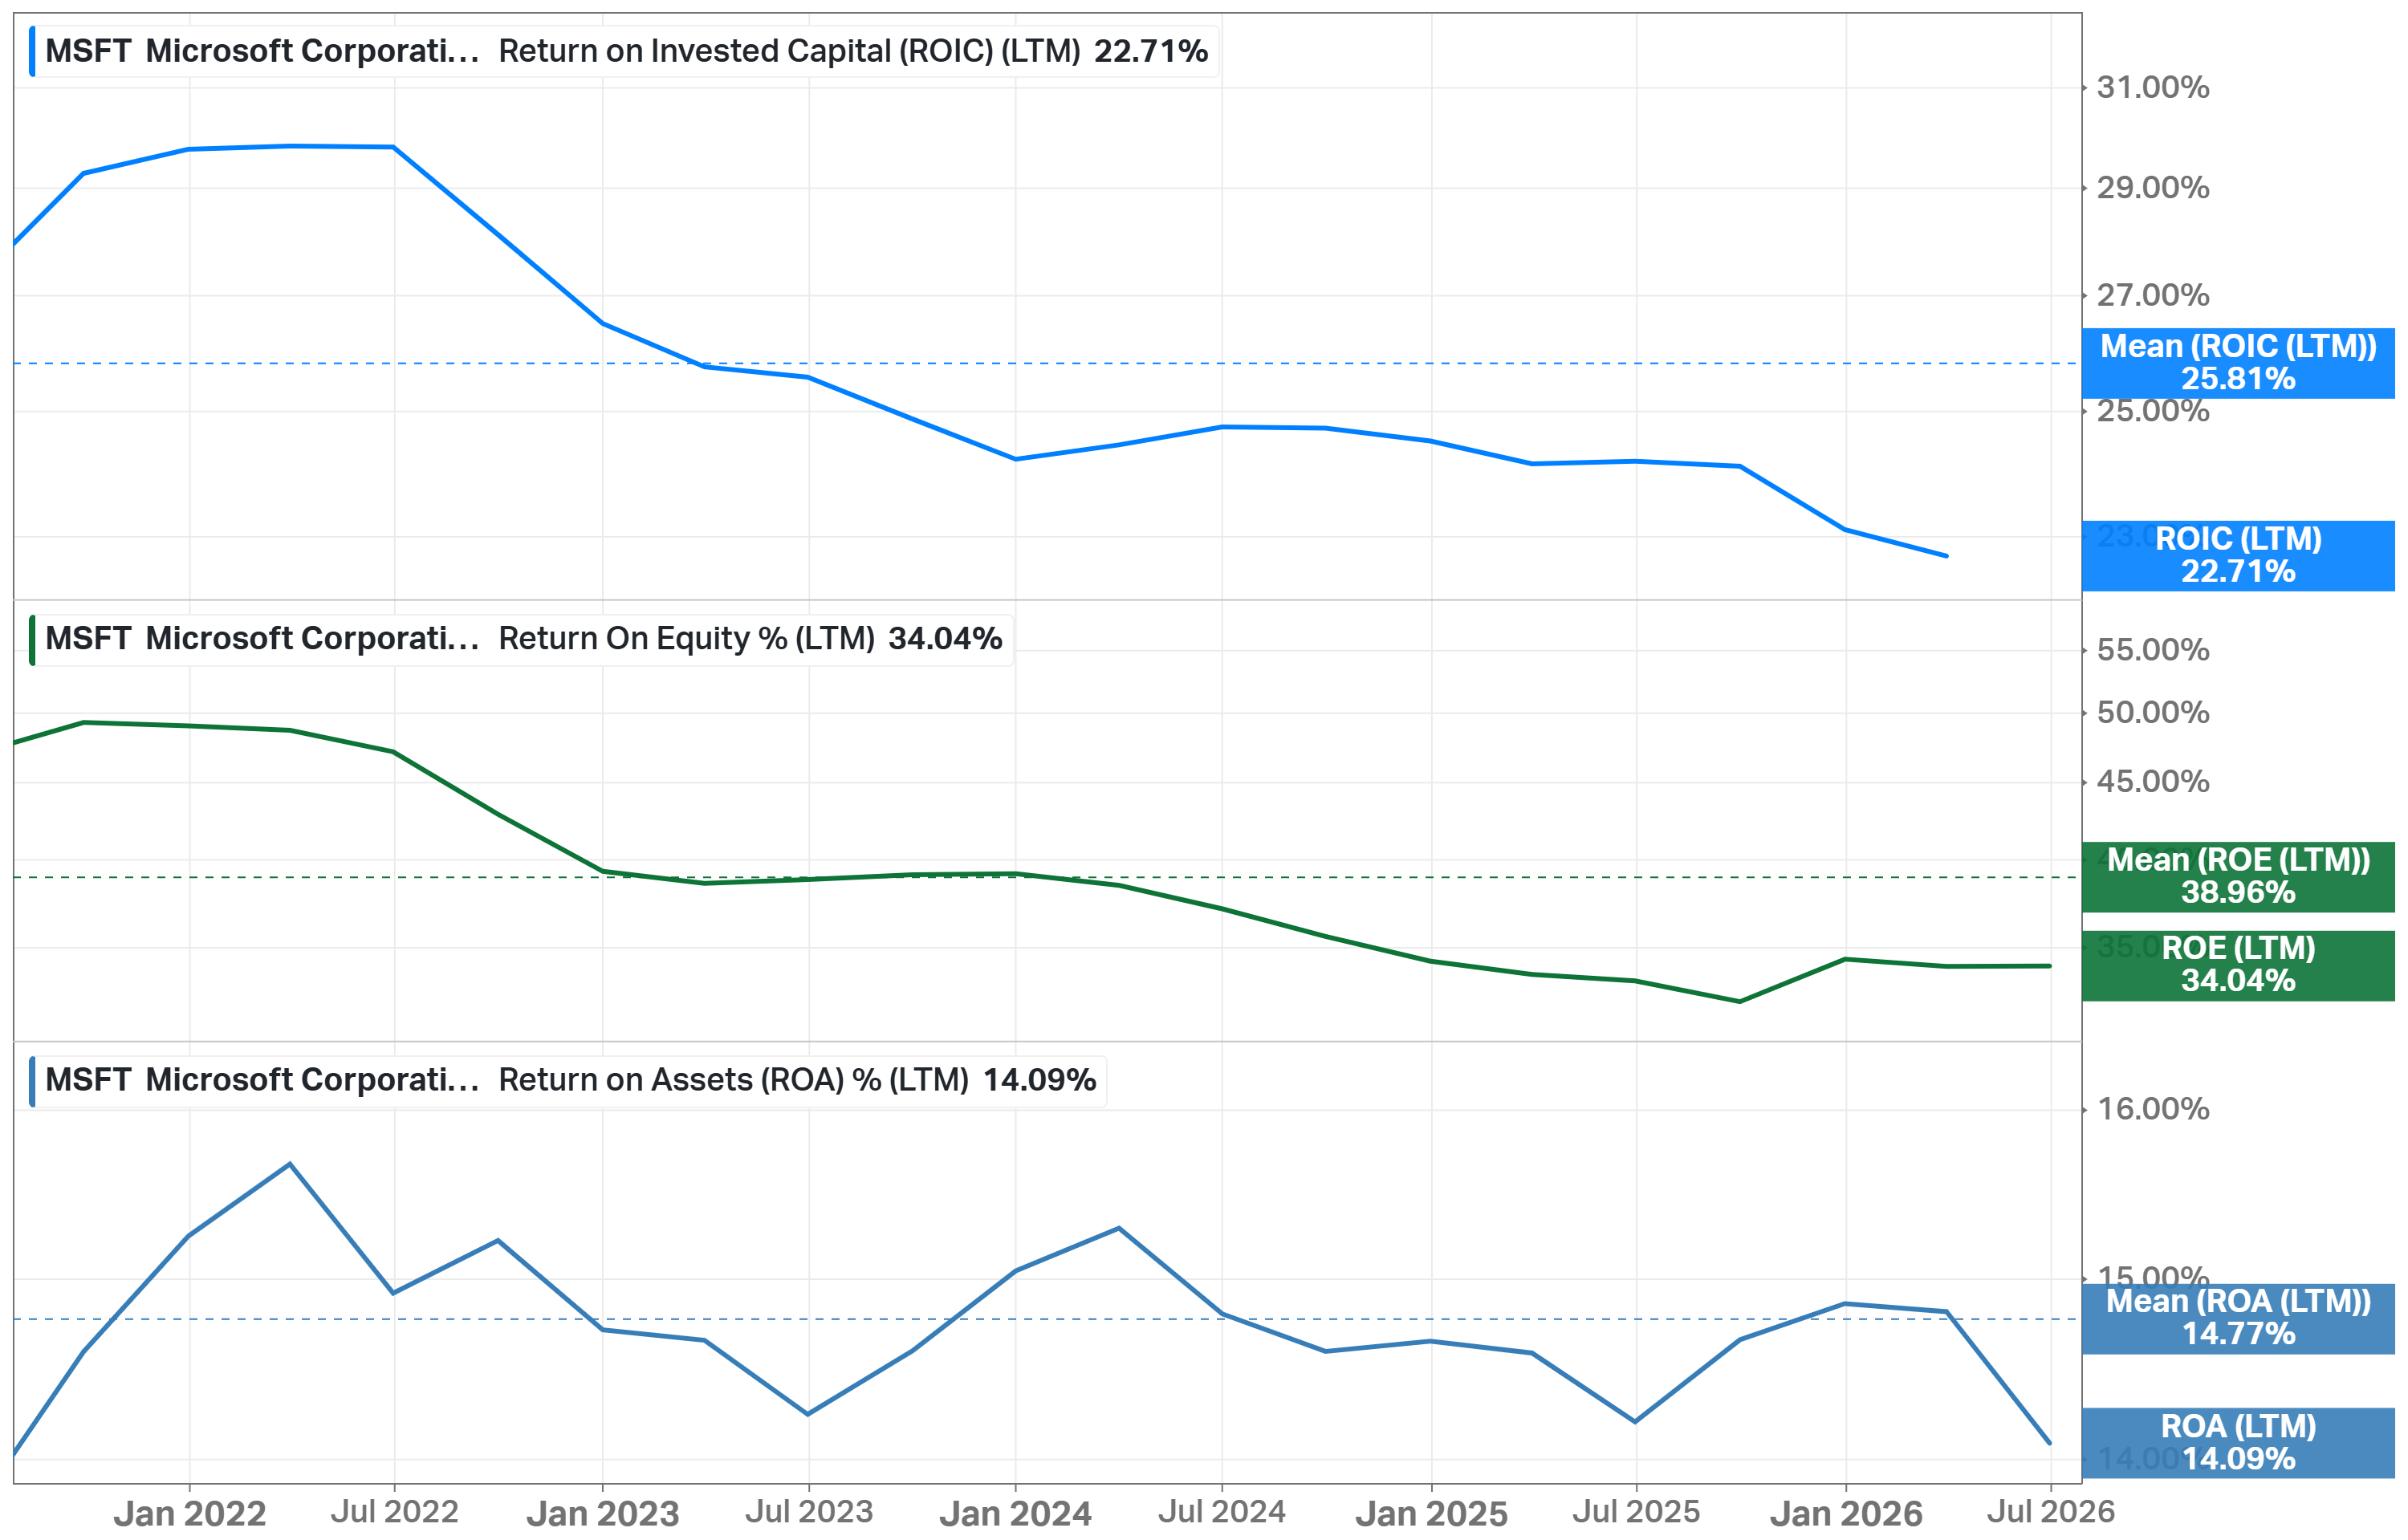
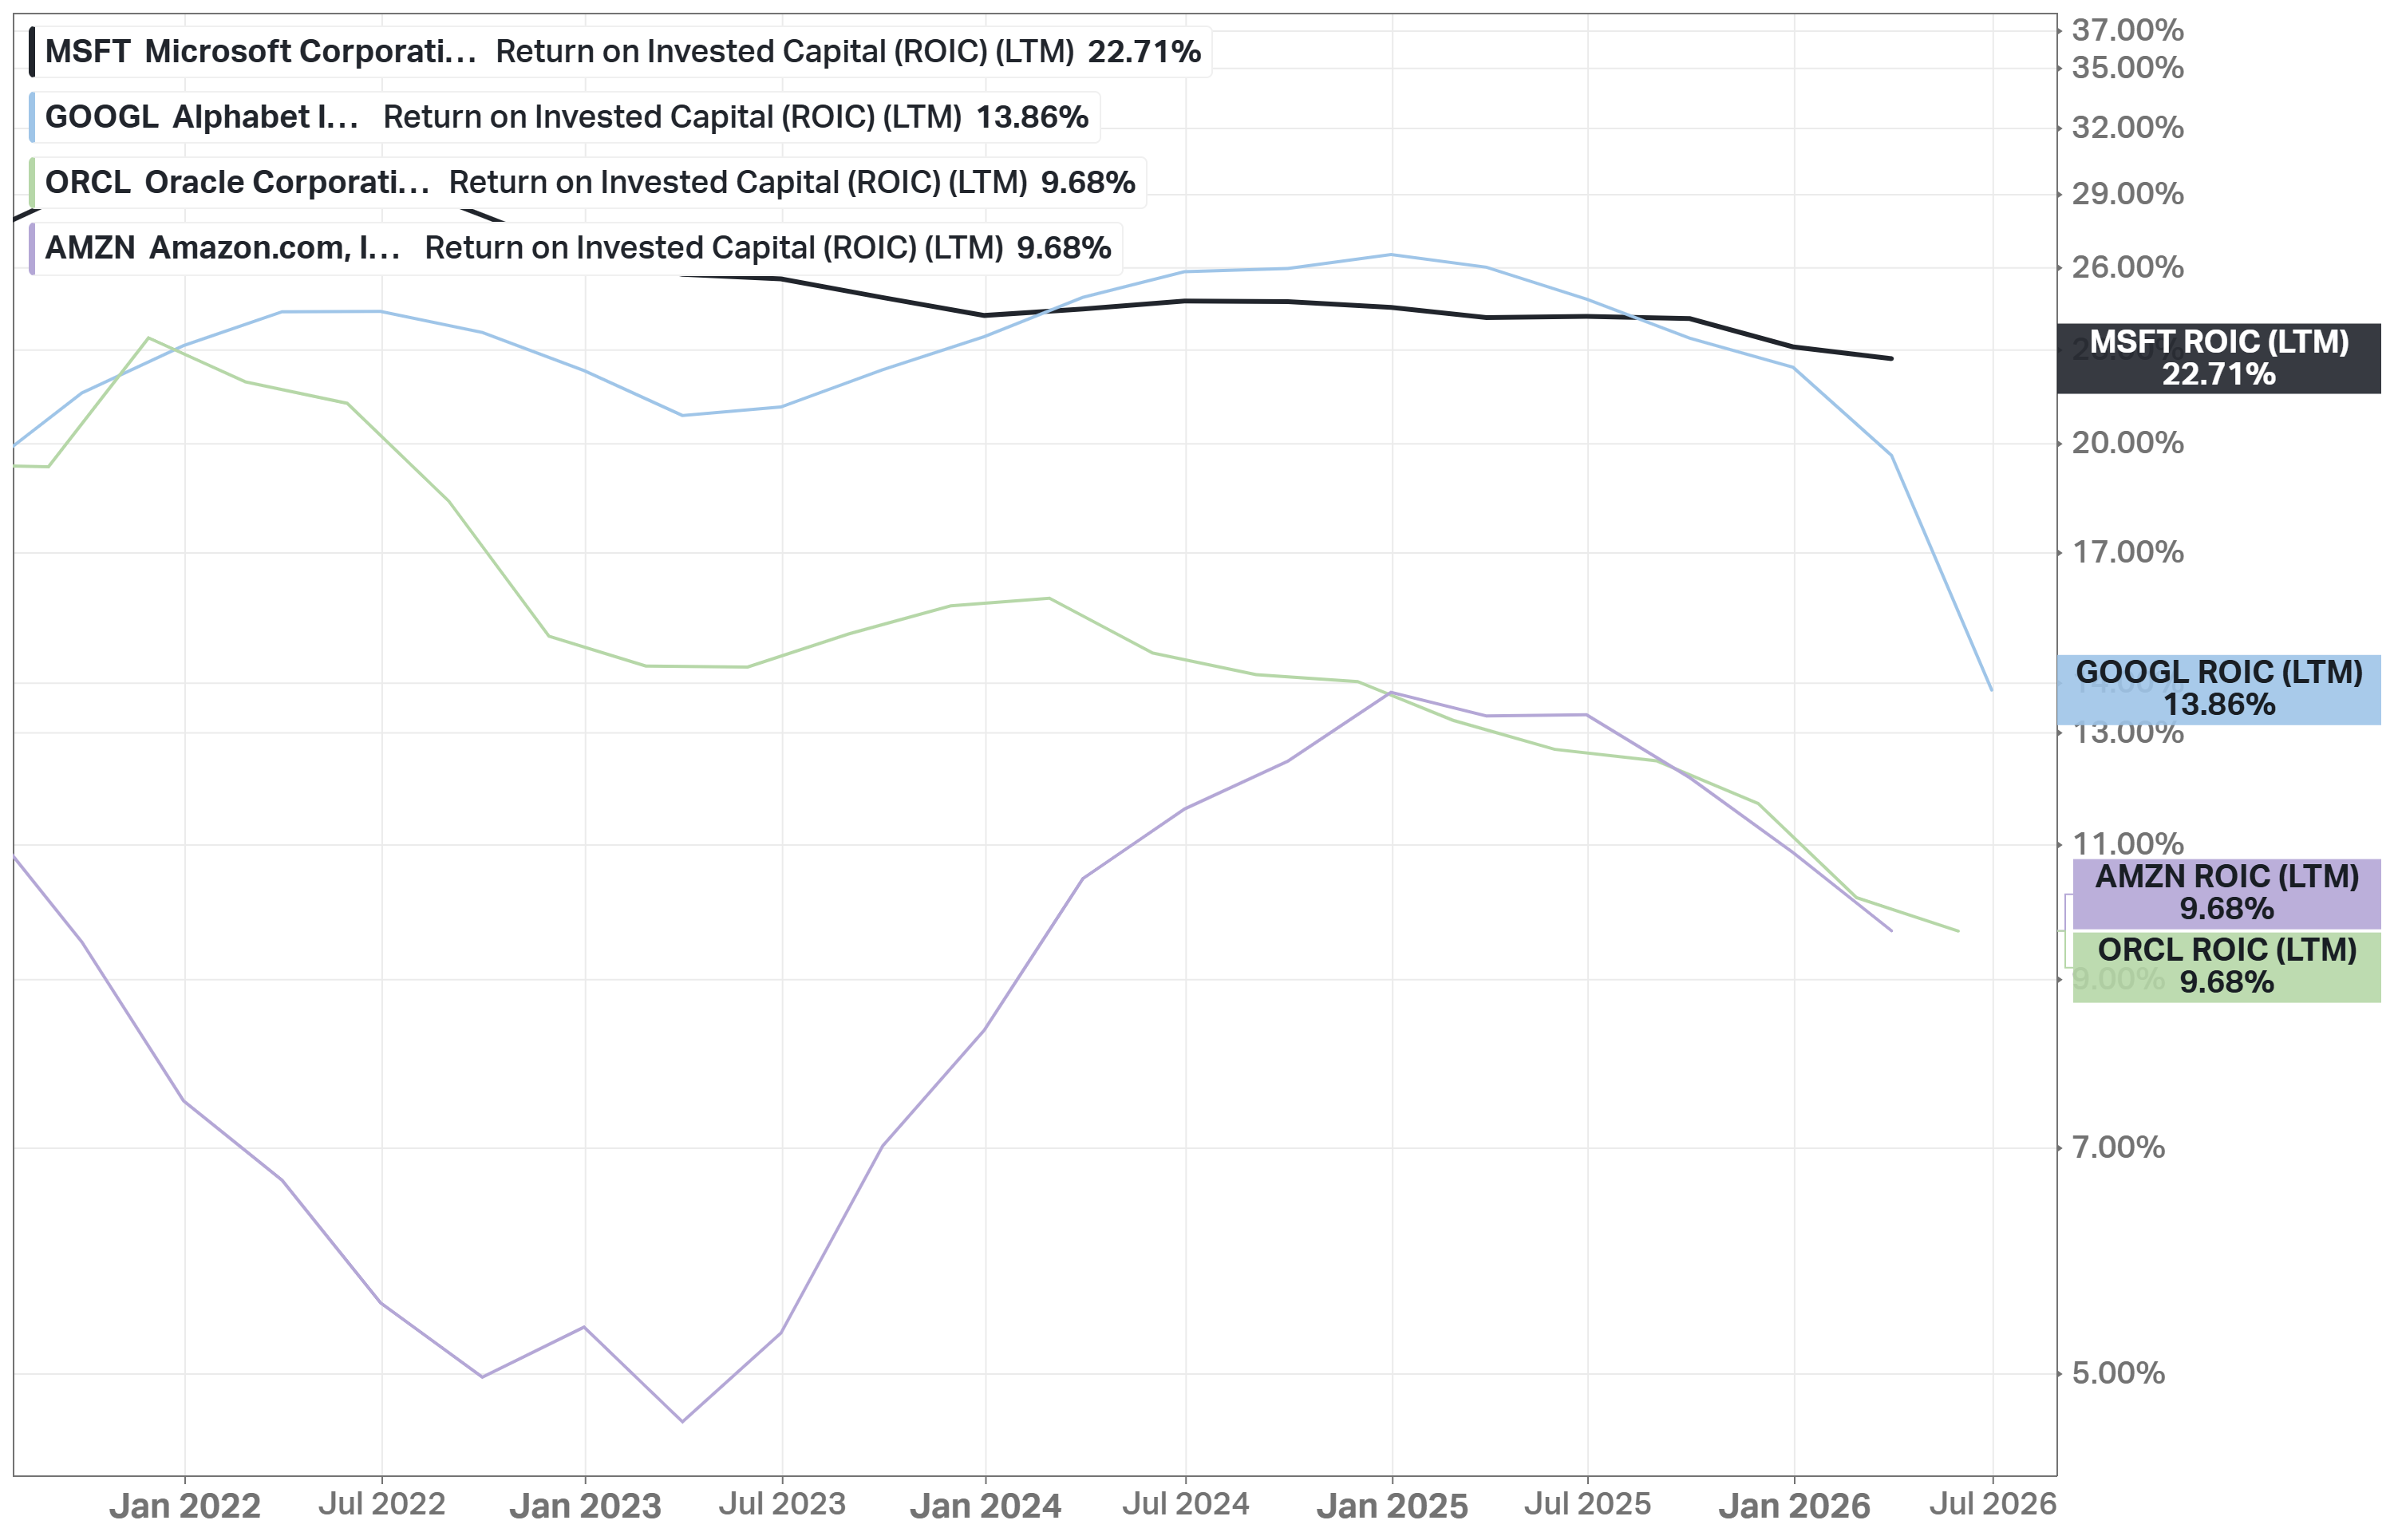
Returns on capital are drifting down. ROIC fell from ~30% to 22.7% and ROE from ~49% to 34% since 2022, as the denominator fills with data centers faster than AI revenue arrives. The bet is that this reverses. It has not reversed yet.
Earnings quality needs adjusting. FY2026 GAAP EPS of $17.95 includes $4.96B of OpenAI investment gains and a $3.2B Anthropic gain in Q4. The cleaner non-GAAP figure is $17.28. The concentration runs deeper than the income statement: the $678B RPO grew 25% excluding OpenAI. Simple arithmetic puts roughly $220B, about a third of the entire backlog, on one counterparty that does not yet fund itself from profits. OpenAI is simultaneously Microsoft’s largest AI customer, partner, and mark-to-market position. If its financing falters, that backlog converts slower or not at all.
Cloud gross margin is compressing. Microsoft Cloud gross margin fell from 68% to 65% in a year on the Azure mix shift and AI infrastructure scaling. Modest so far, but the direction matters when consensus assumes margin stability.
The legacy tail is shrinking. More Personal Computing declined 4% in Q4 with Windows OEM guided to decline high-teens in FY27 and XBOX taking impairment charges. Roughly 16% of revenue no longer grows, and the market caps the multiple accordingly.
What the bears get right: FCF is falling while the stock de-rates, and nobody (including Microsoft) knows the return profile on $175B of annual capex. If Azure decelerates before the spending peaks, EPS estimates (+11% -> +18% -> +20% for FY27-FY29) get cut, and today's 24x stops looking cheap. I do not dismiss that scenario.
Competitors
In cloud, AWS remains the largest provider. But Azure is closing the gap while growing faster. Google Cloud is third with its own vertically-integrated silicon and models. Oracle has emerged as the aggressive AI-infrastructure challenger, signing frontier-lab capacity deals.
In productivity software, Google Workspace remains the only real alternative. Enterprise share has barely moved in a decade.
The newer front is the model labs themselves. OpenAI and Anthropic increasingly sell directly to enterprises, which makes them partners, customers, and long-term competitors of Microsoft at the same time.
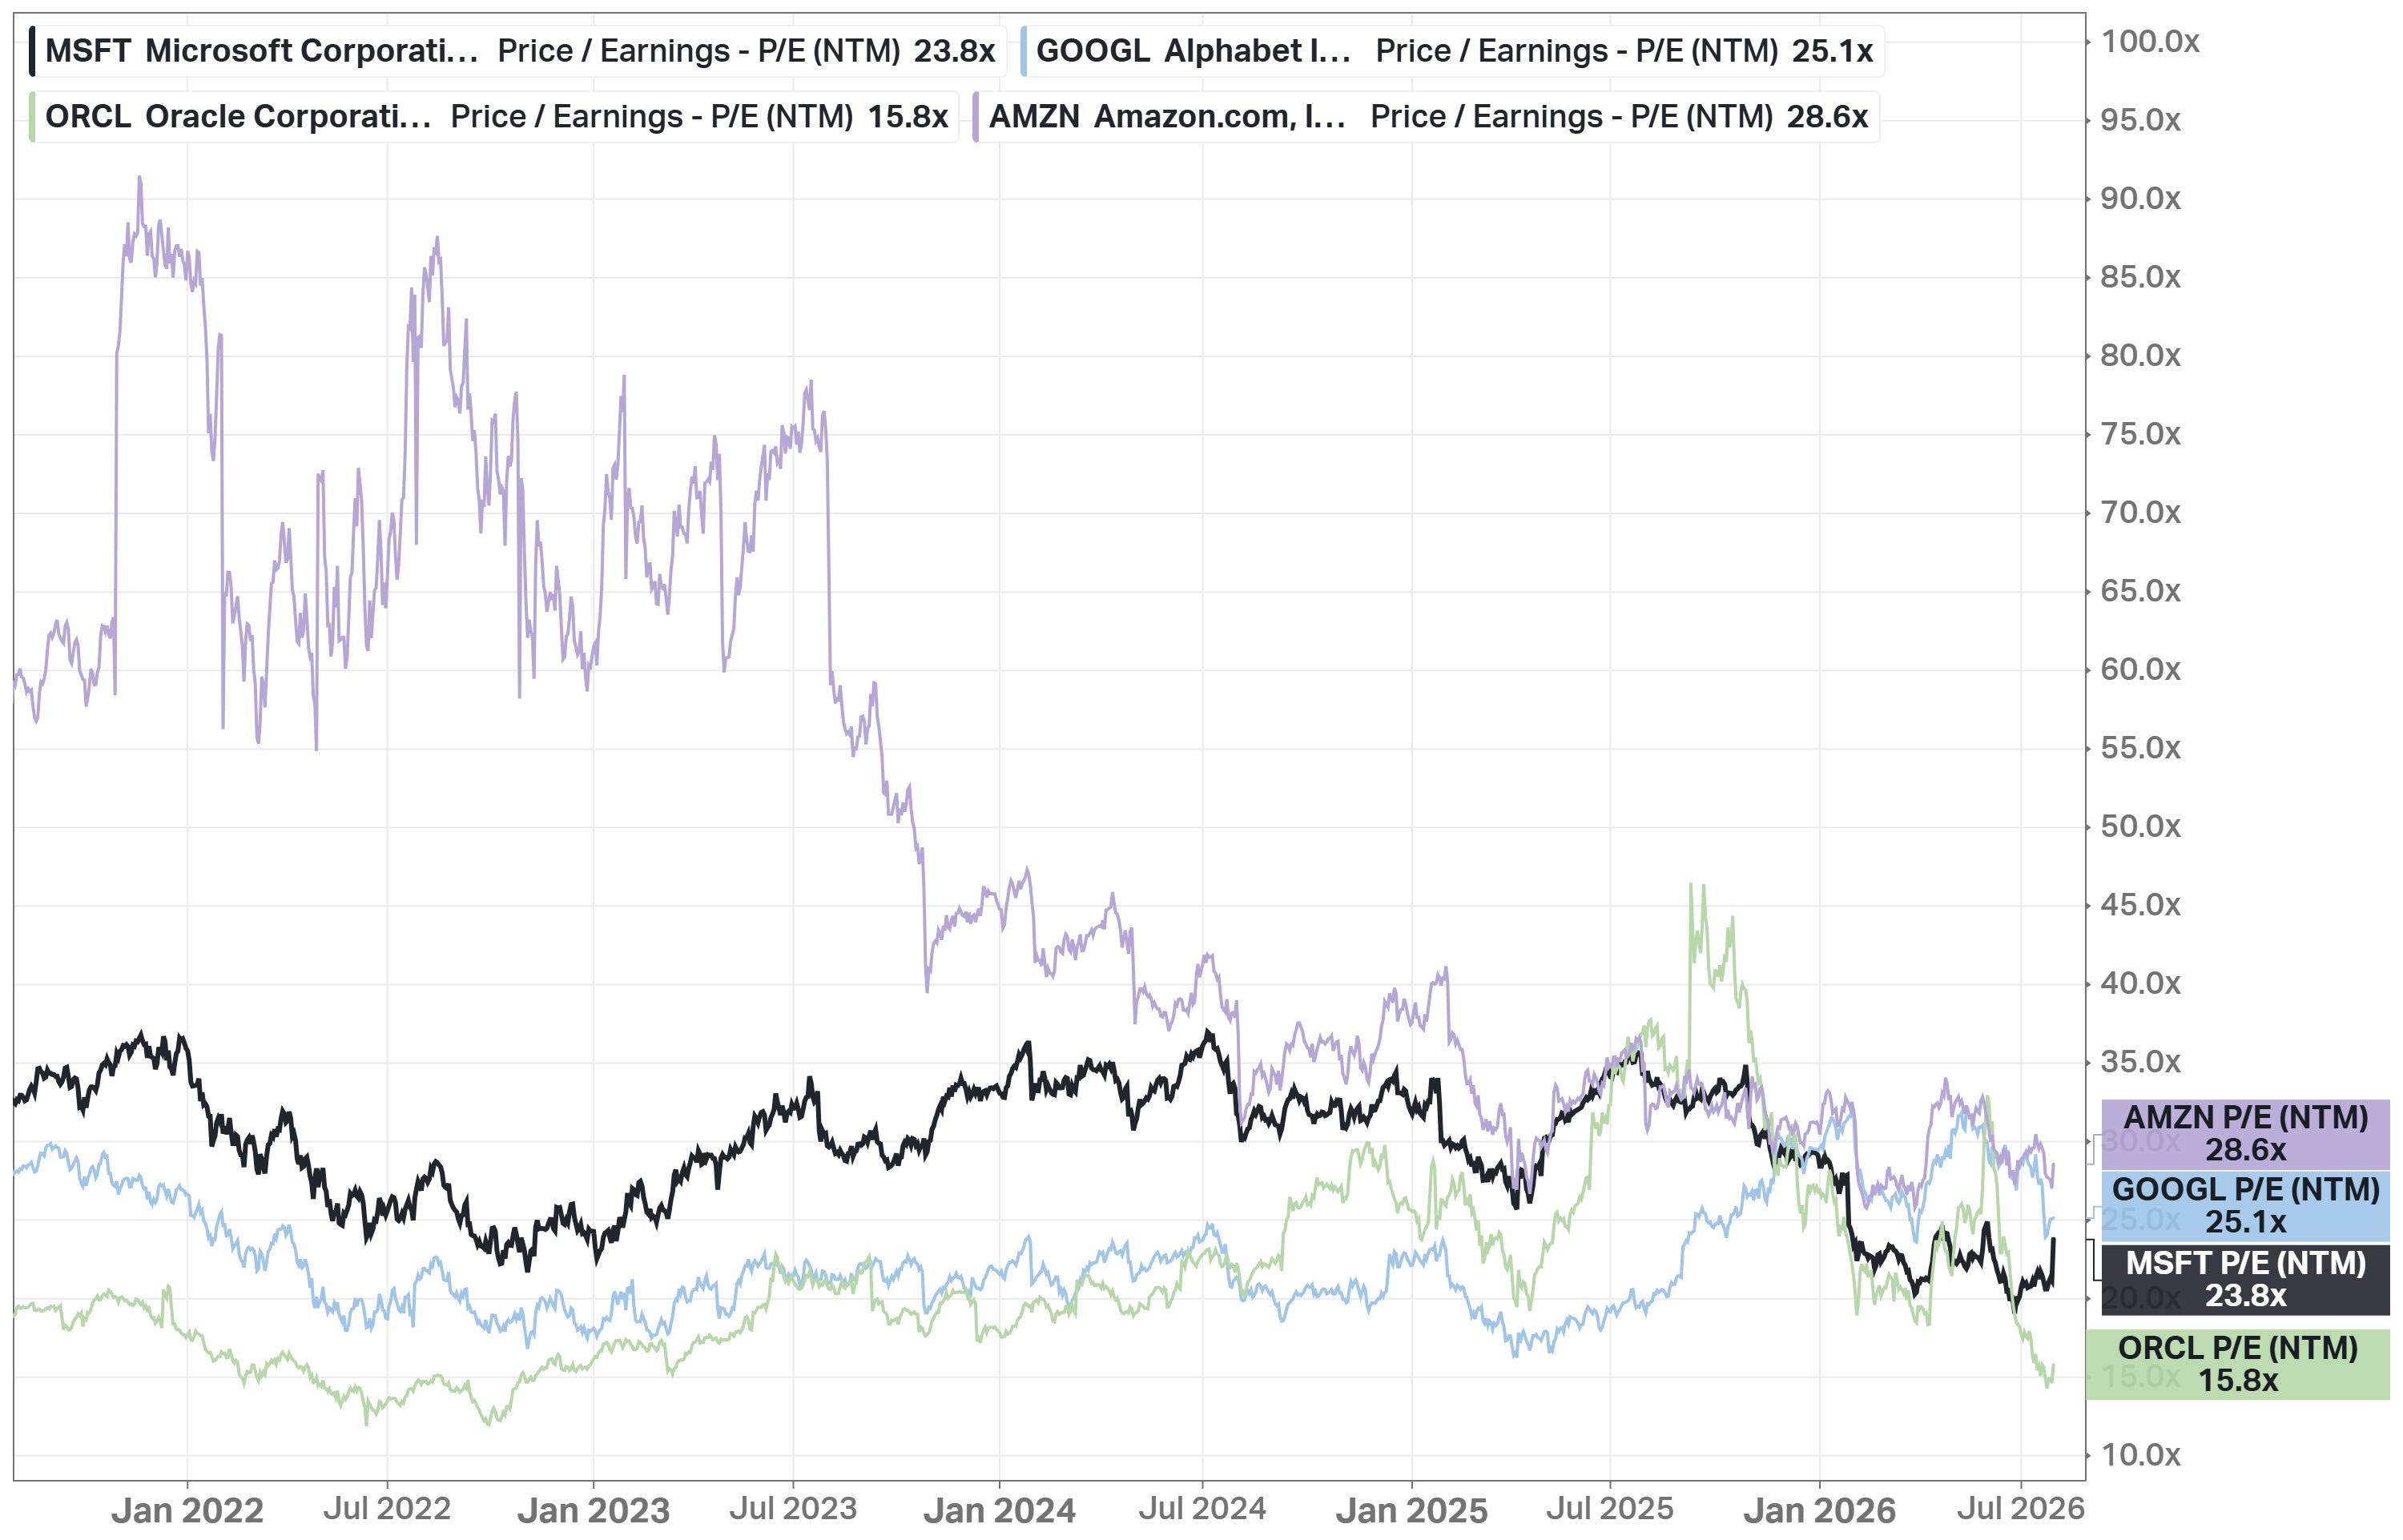
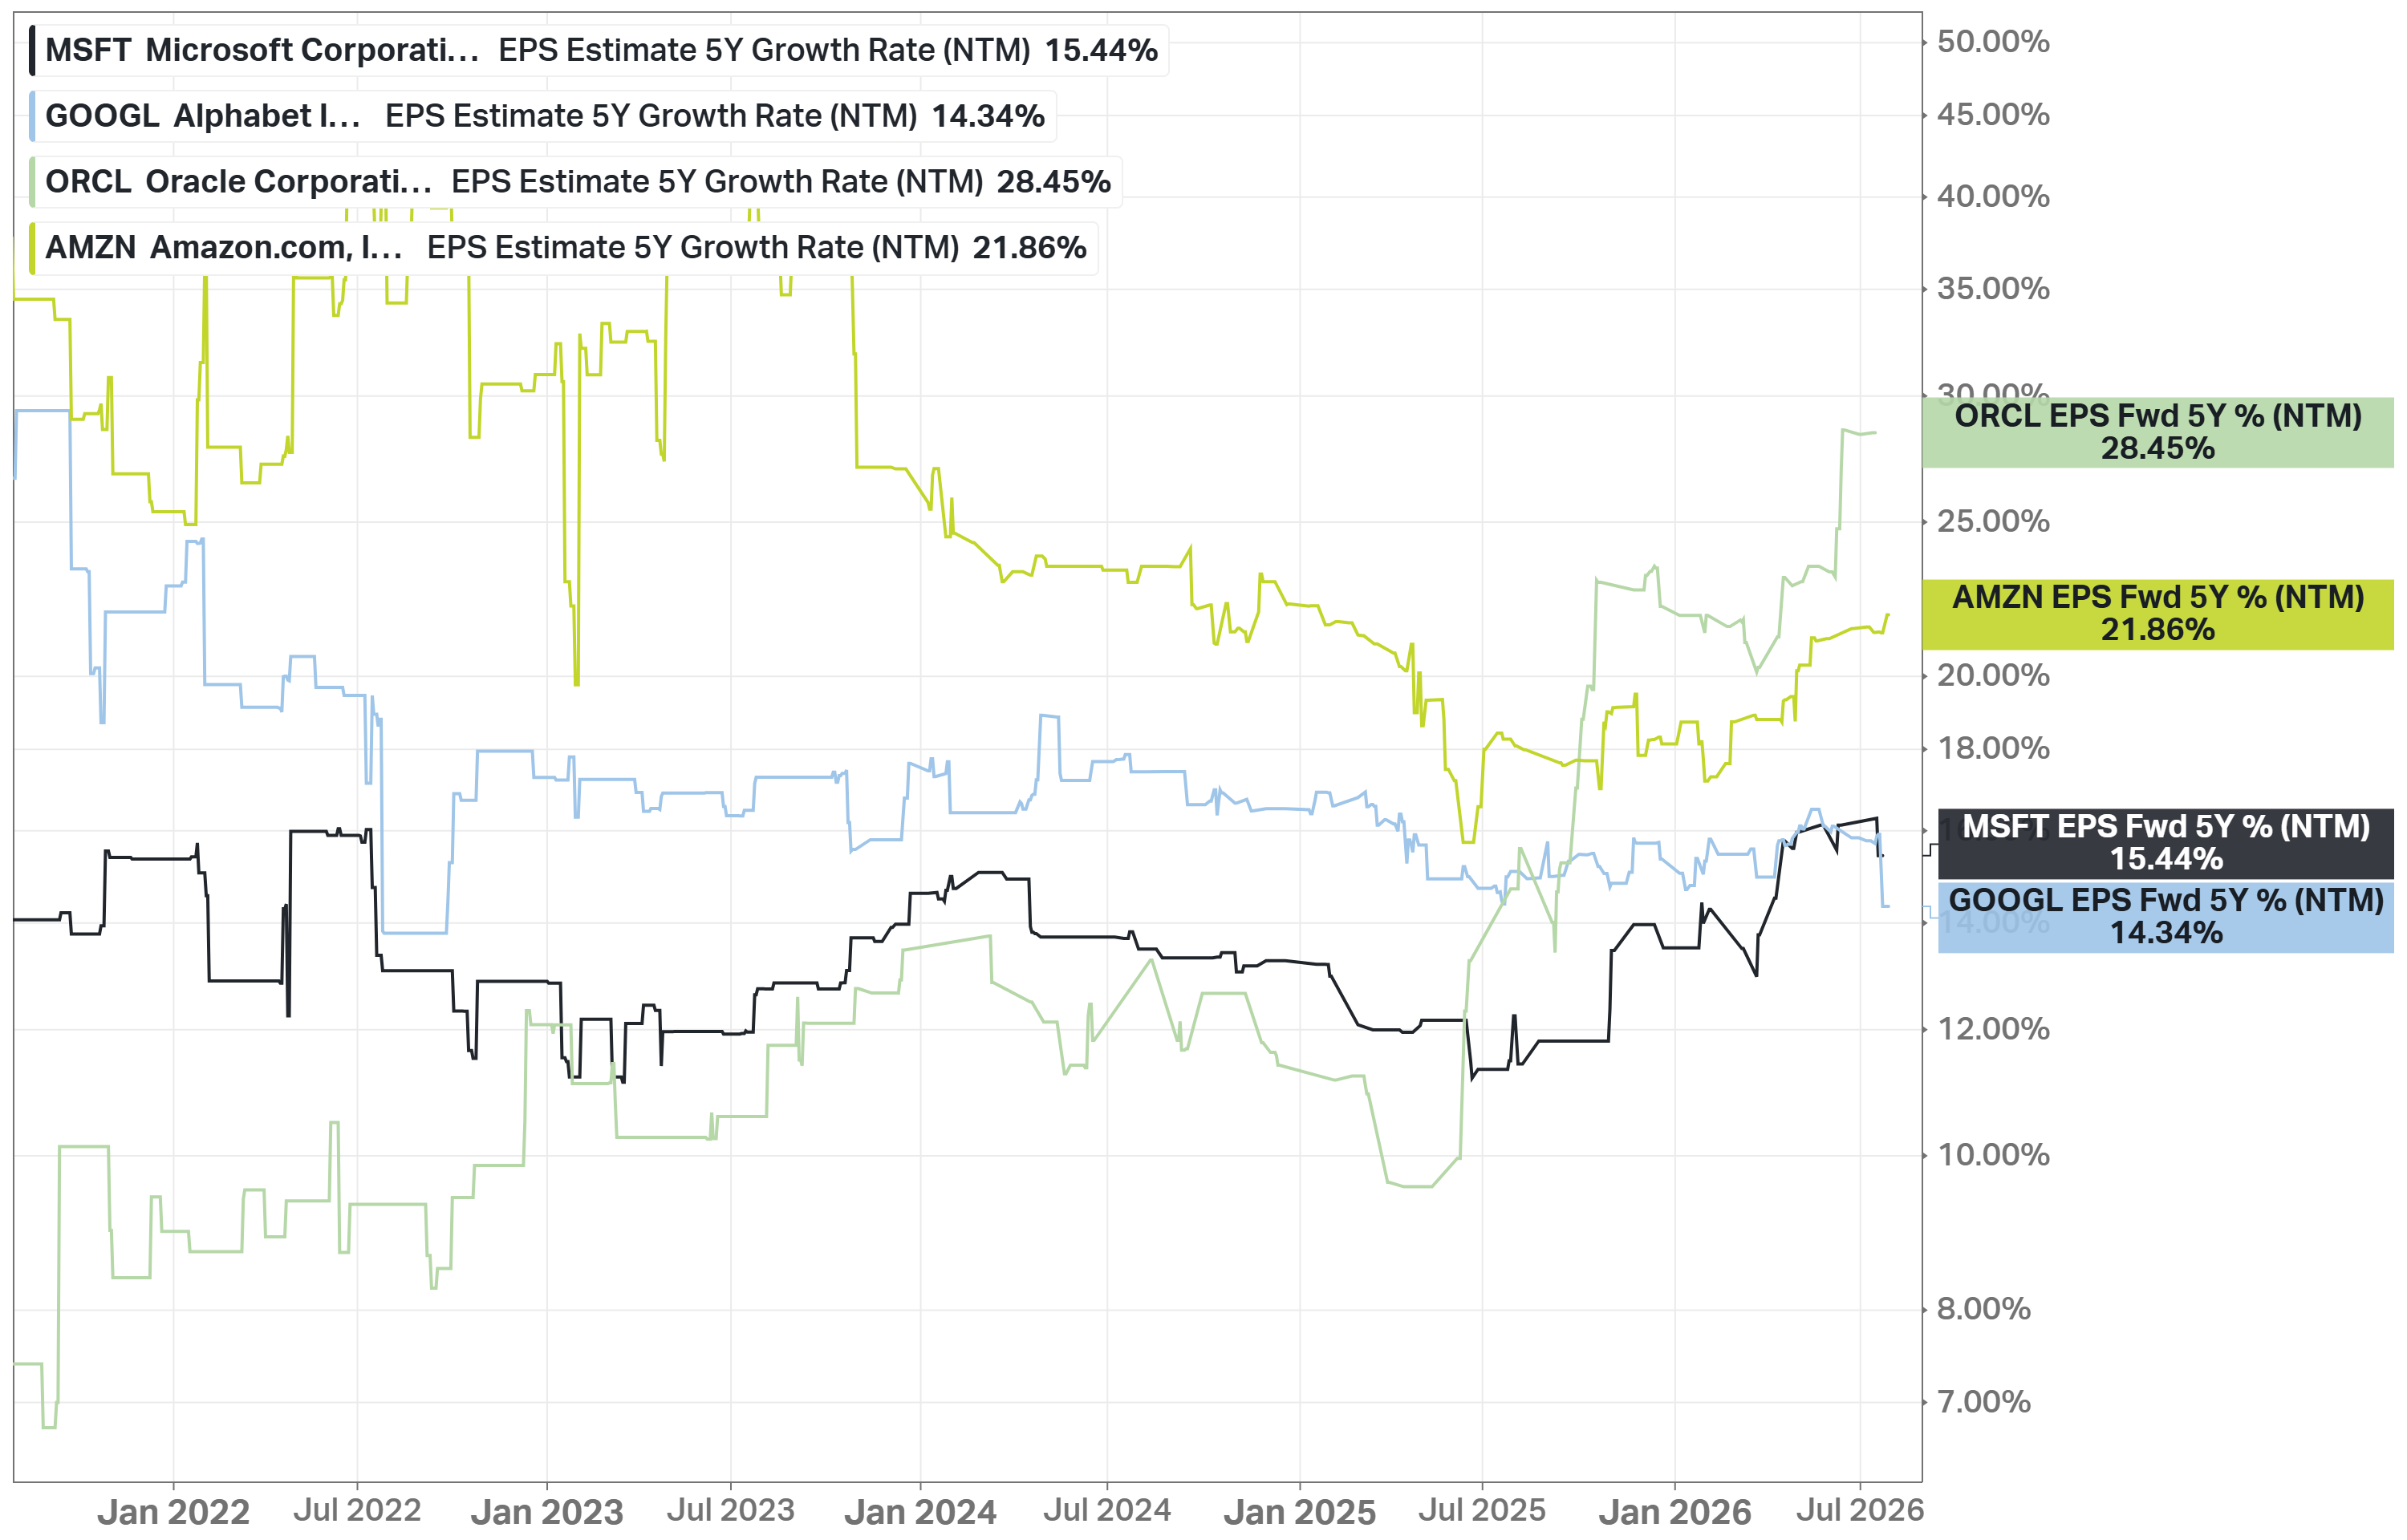
The charts below compare them side by side. On the multiple, Microsoft’s 23.8x forward earnings is cheaper than Amazon (28.6x) and Alphabet (25.1x). Only Oracle looks cheaper at 15.8x with the fastest expected growth (28.5% a year) and a PEG of 0.55. But the quality columns explain the discount: Microsoft’s ROIC of 22.7% is more than double Alphabet’s 13.9% and roughly 2.3x Oracle’s and Amazon’s 9.7%. And its debt-to-equity of 12.8% compares with 53% at Amazon and 389% at Oracle. The “cheap” AI cloud is running its buildout on a leveraged balance sheet, while Microsoft funds a larger one from cash flow.
The premium P/Fwd Sales (8.8x vs 3.0-7.4x) simply reflects the highest margins in the group.
Past
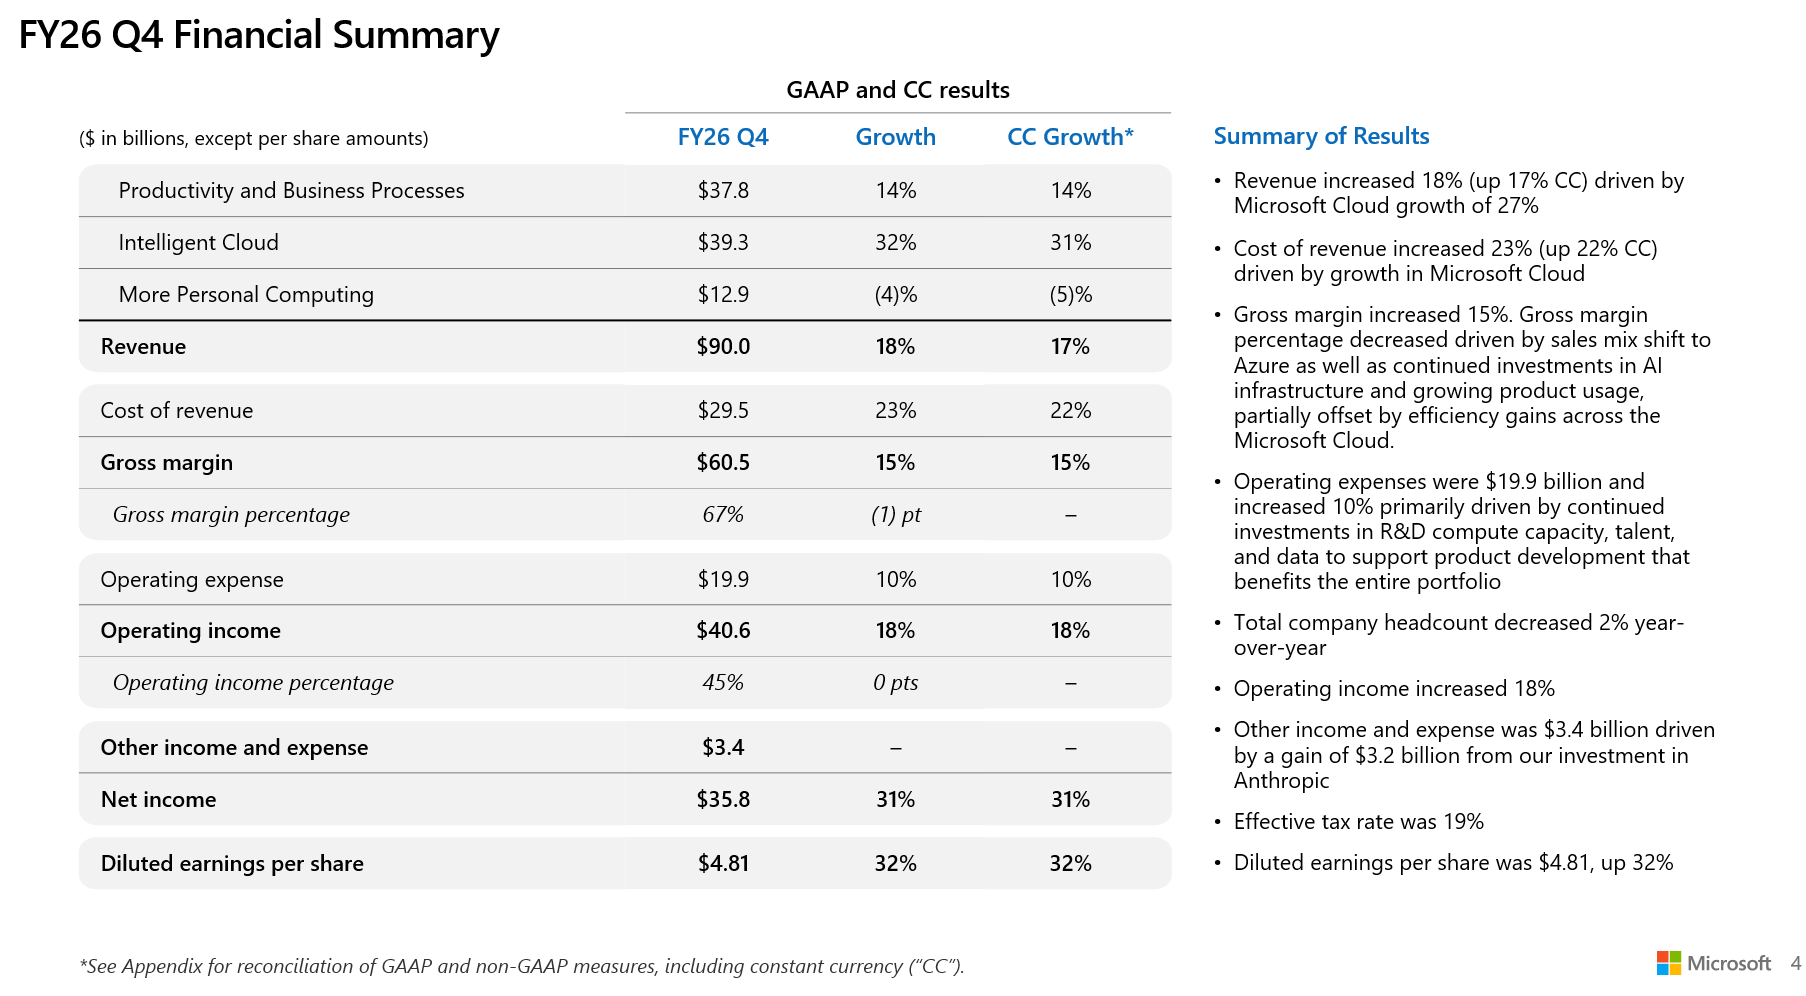
FY2026 results: revenue $331.8B, up 18%; operating income $155.2B, up 21%; GAAP diluted EPS $17.95, up 32% (non-GAAP, excluding OpenAI gains: $17.28, up 22%); operating margin 46.8%.
Q4 FY2026: revenue $90.0B (+18%), Microsoft Cloud $59.3B (+27%), Azure +43%, EPS $4.81 - and the $0.27 of one-time benefits still leaves a clean beat versus guidance.
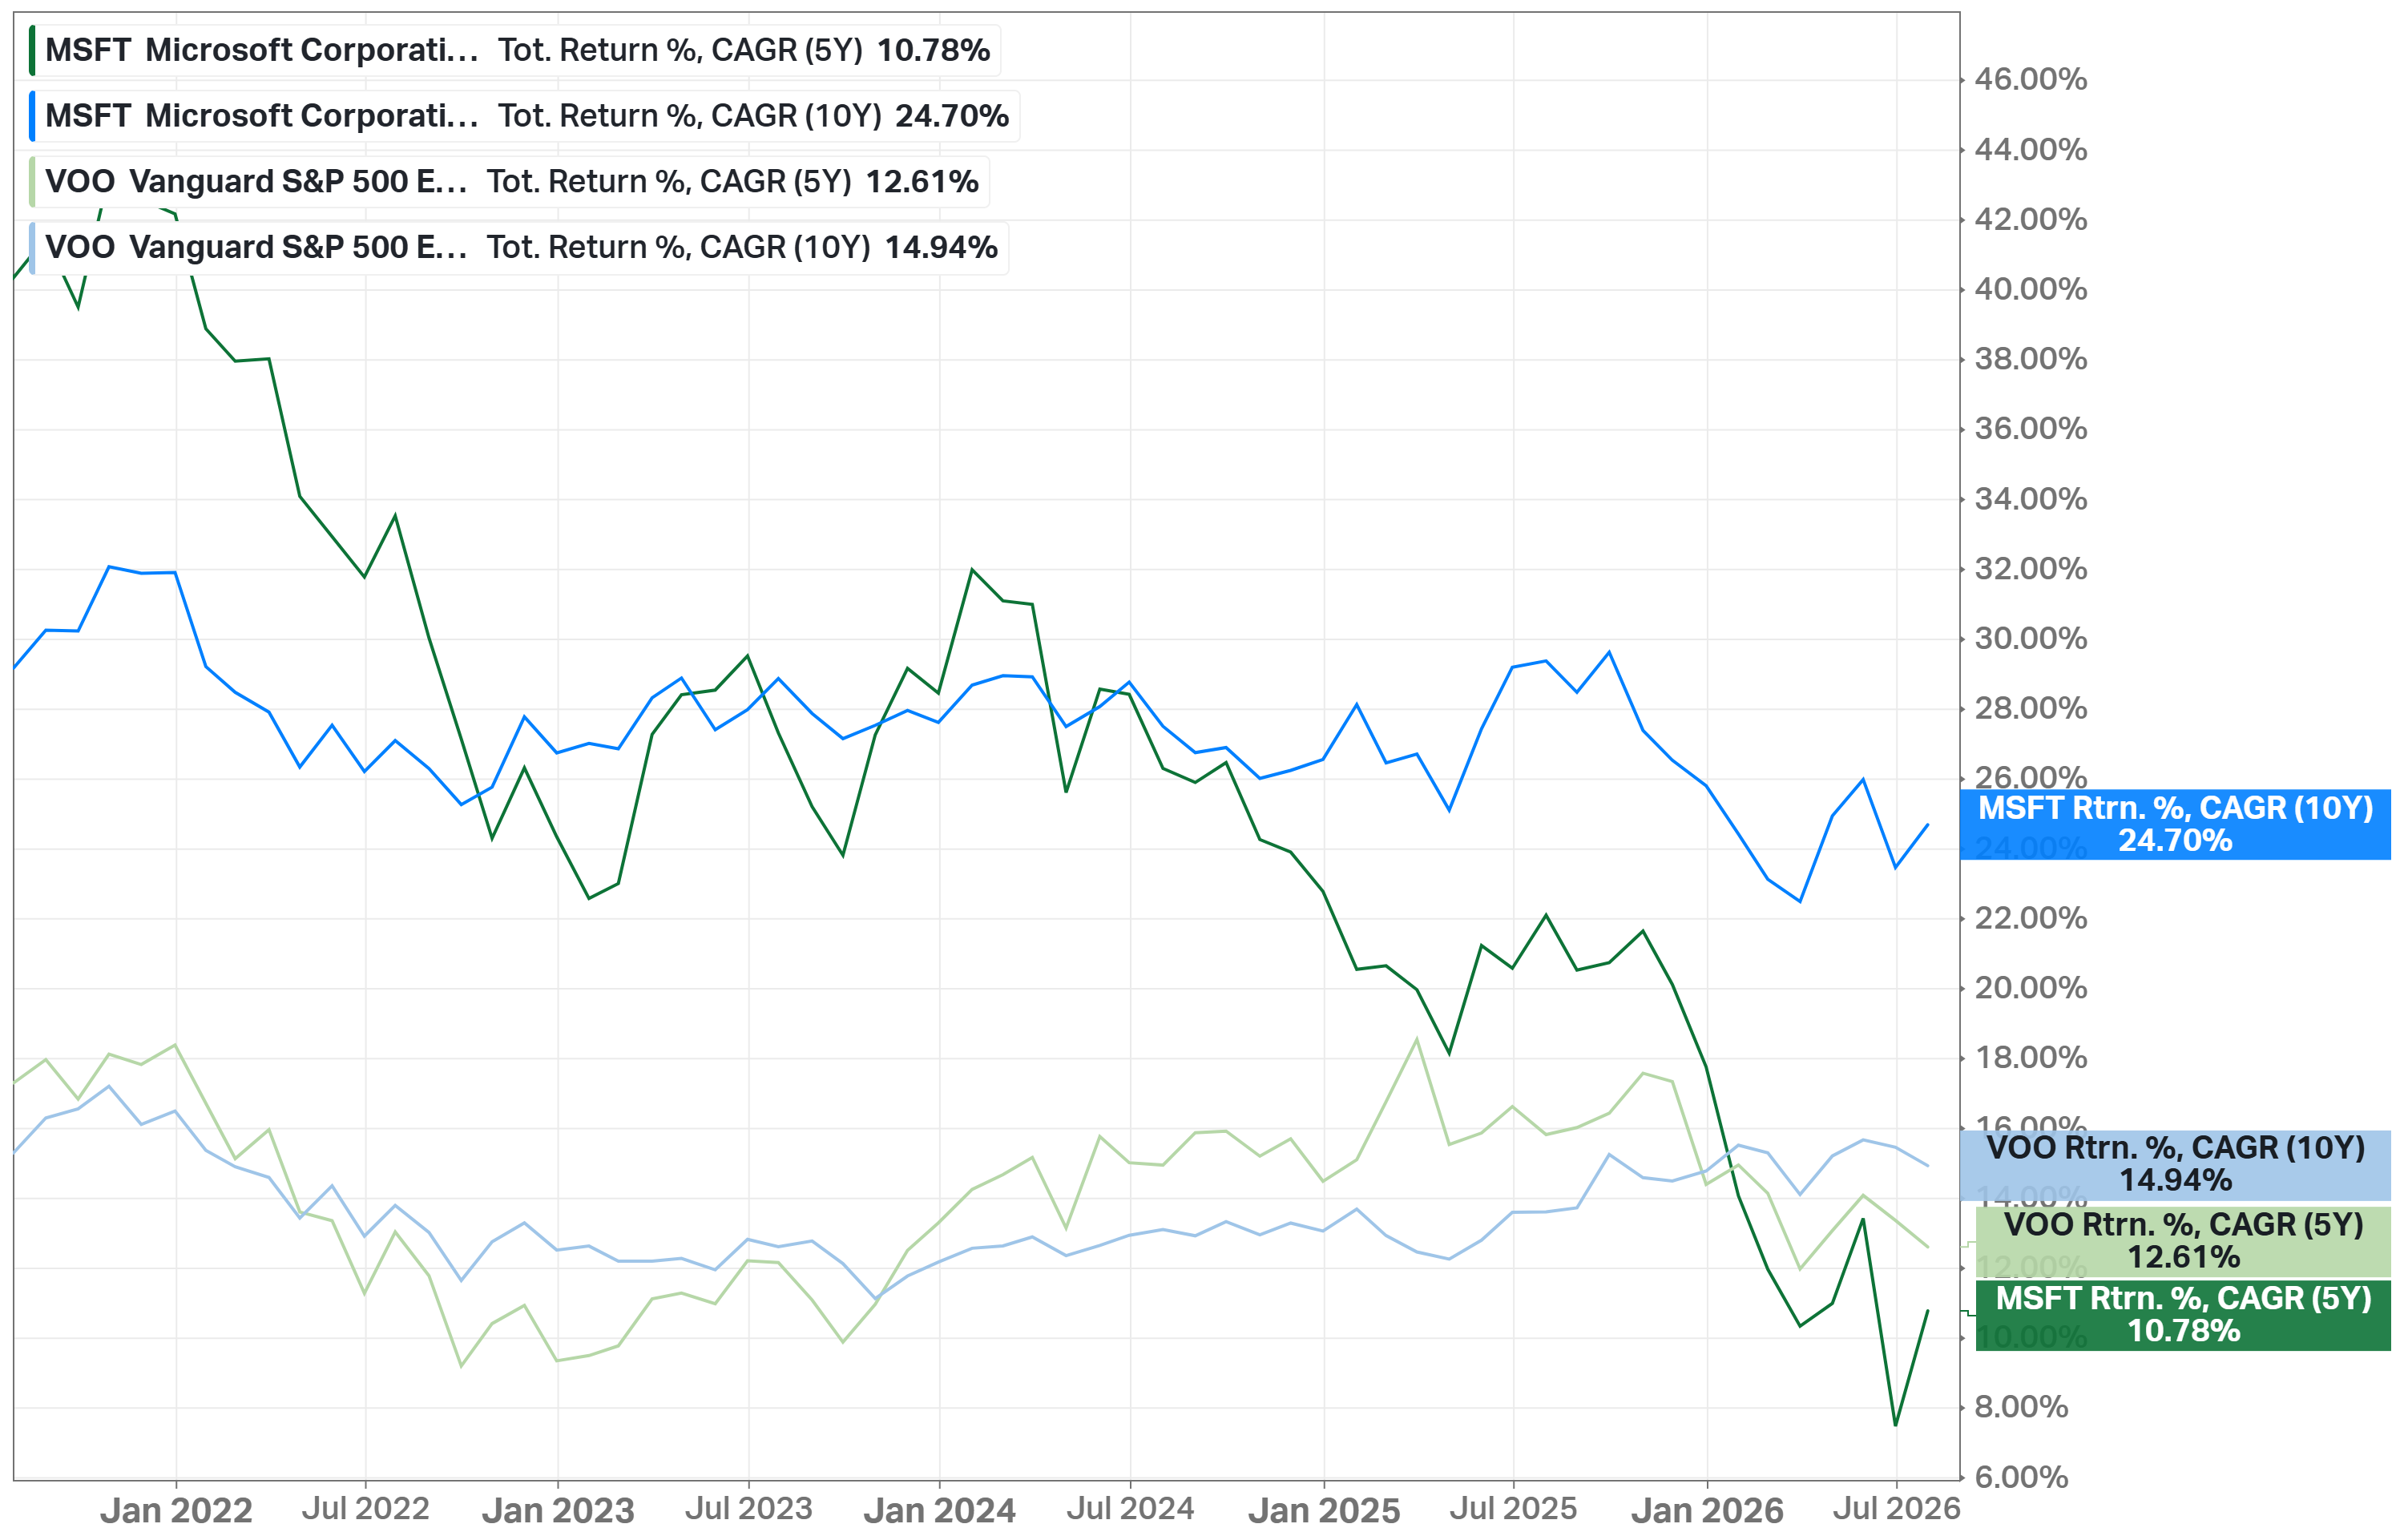
Total return CAGR: 24.7% over ten years, versus 14.9% for the S&P 500; over five years, 10.8% versus 12.6%. The stock has gone essentially sideways since 2024 while earnings compounded, which is exactly how multiples compress.
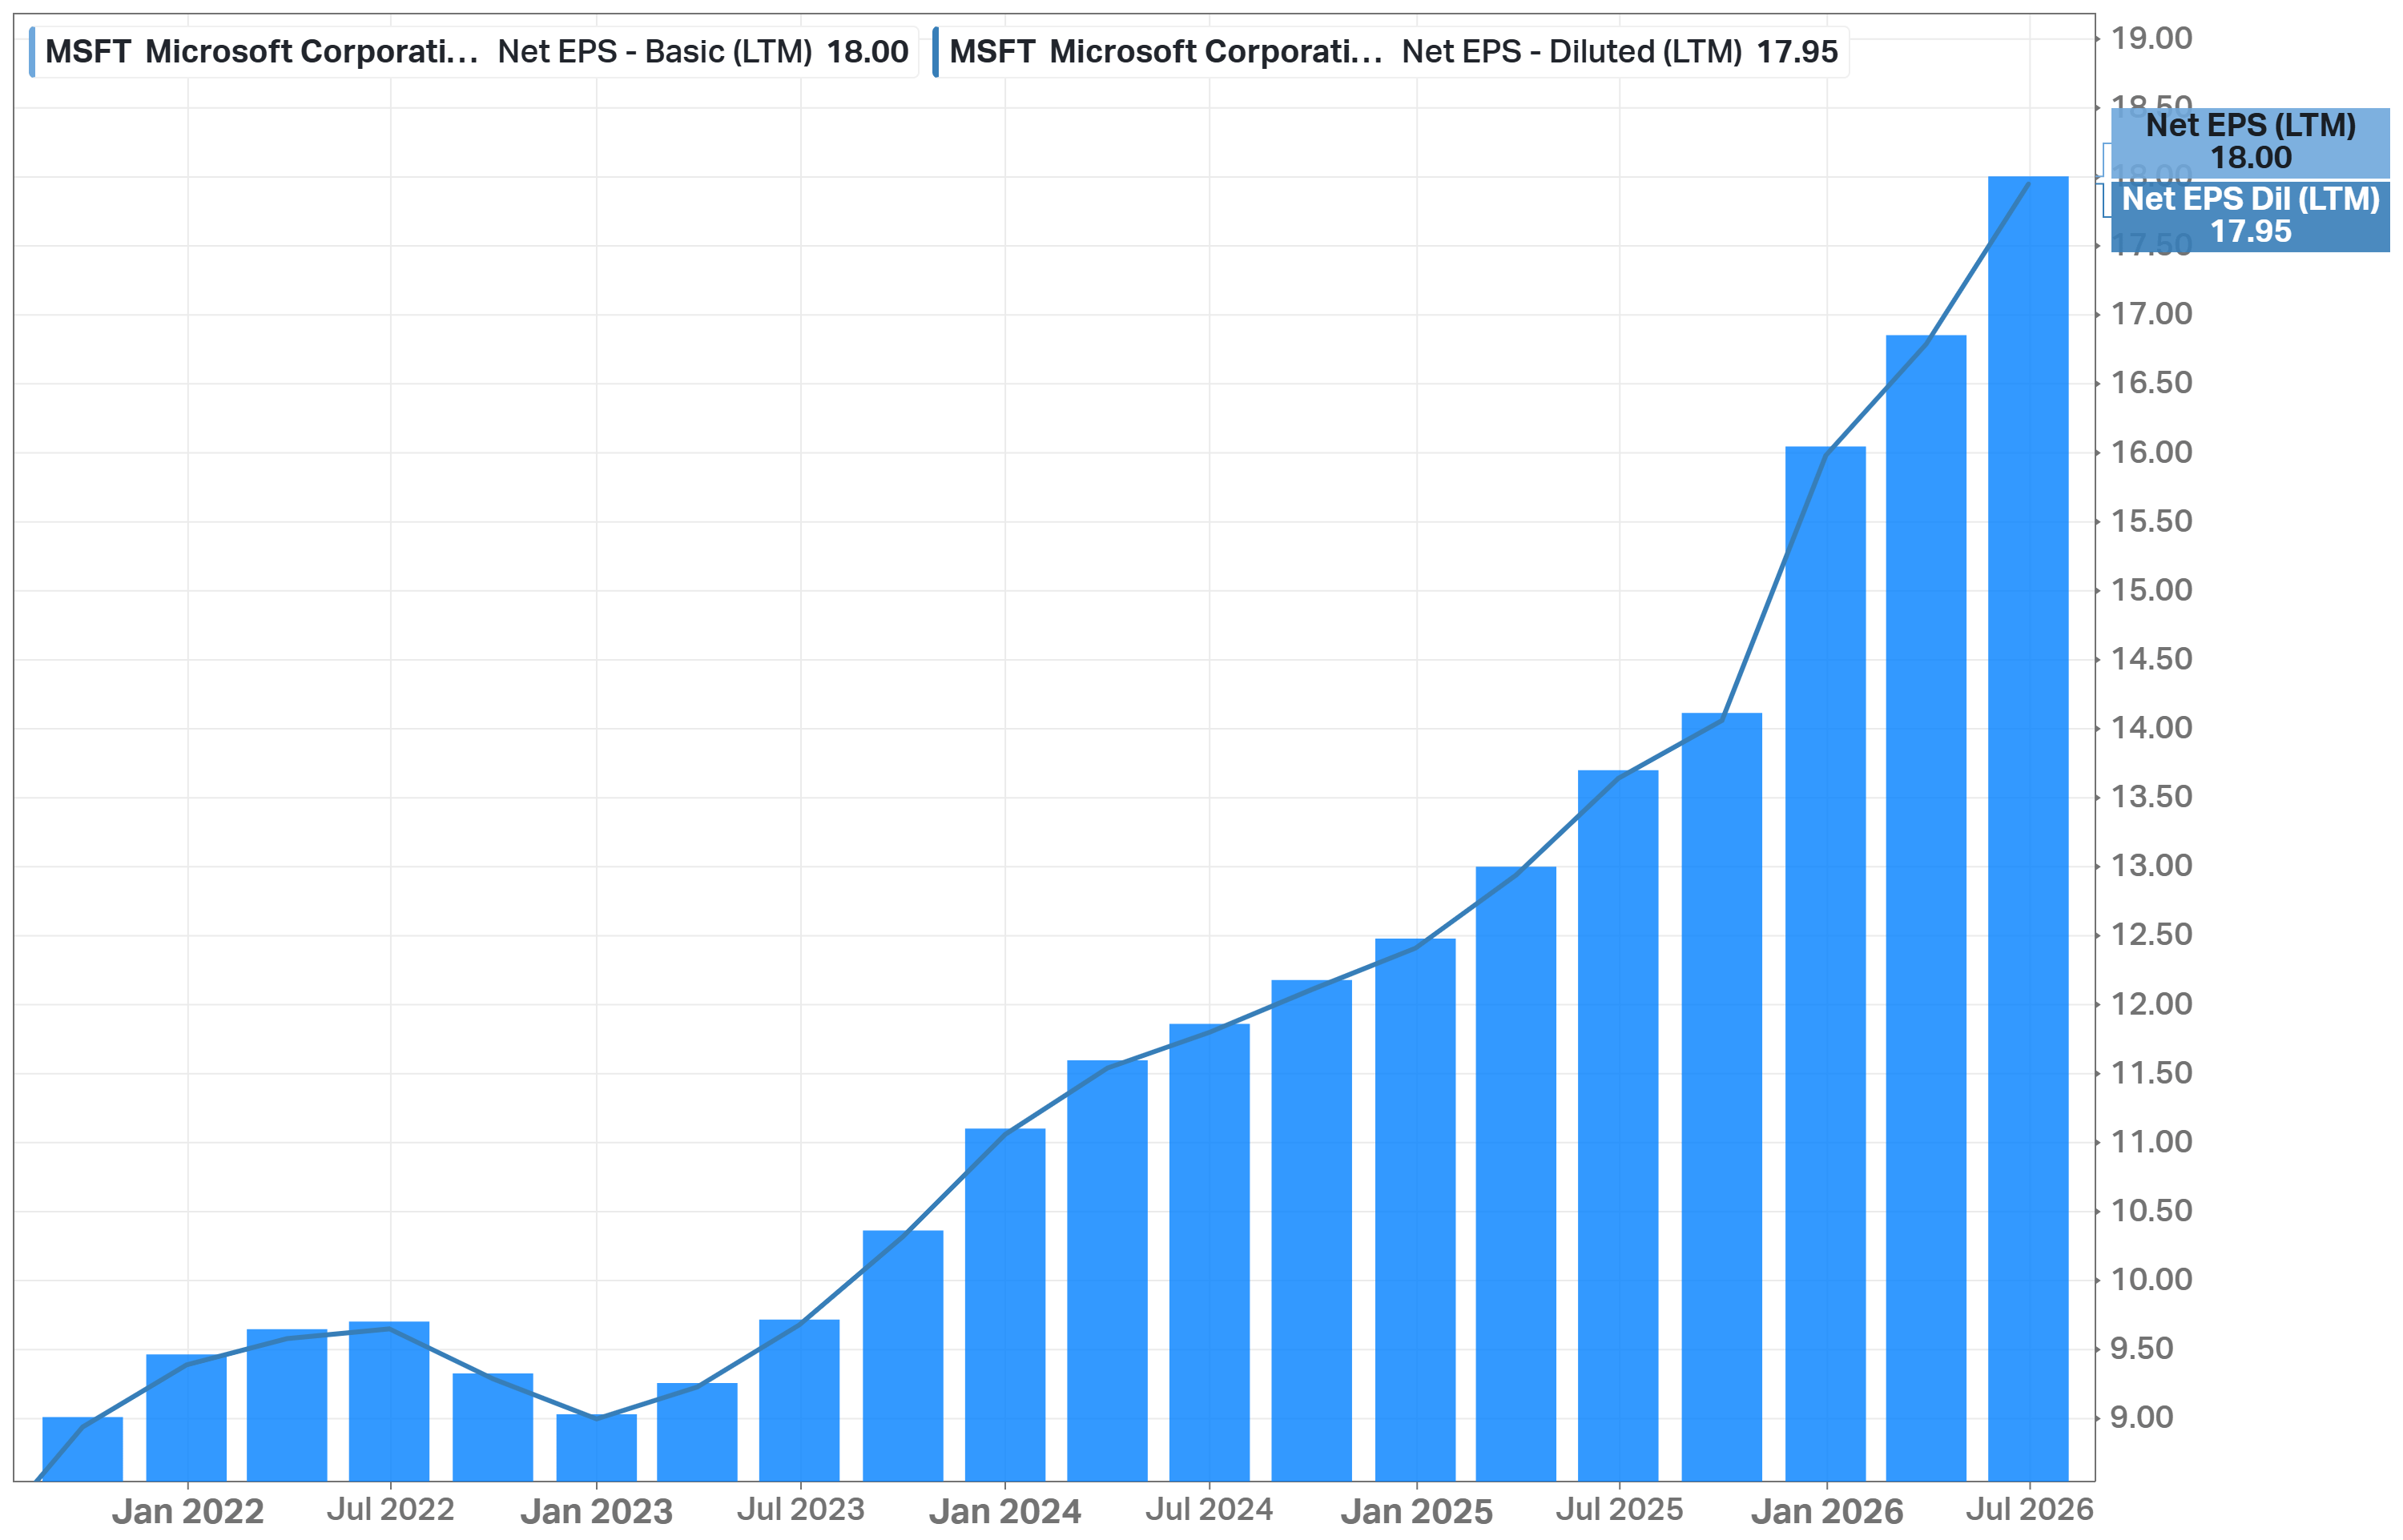
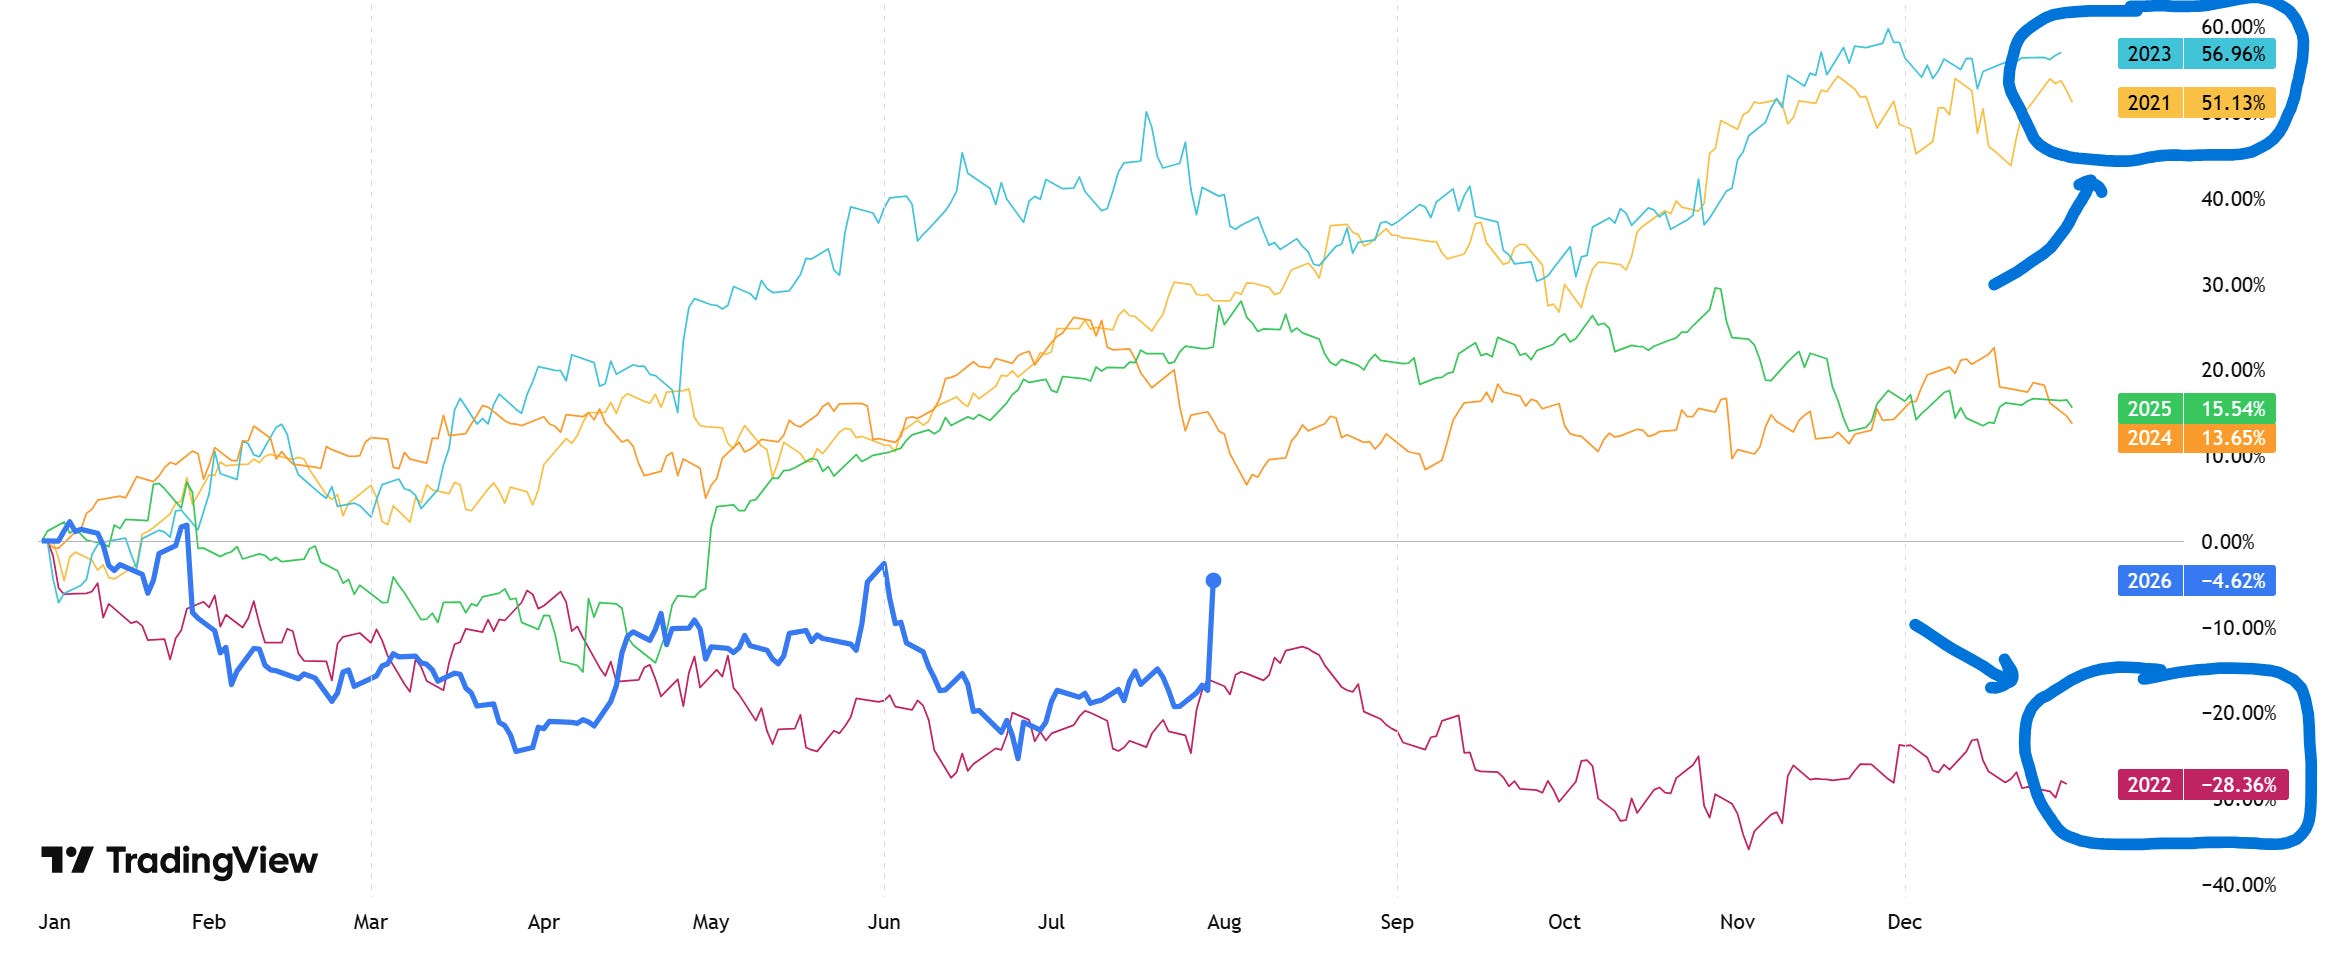
The year-by-year picture makes the setup visible: +57.0% in 2023, then +13.7%, +15.5%, and -4.6% year-to-date. Three years of a flat-to-down price against double-digit earnings growth. The worst drawdown year in recent history is 2022 at -28.4% - that is what "risk" has historically meant for this stock, versus -66% for NVIDIA in the same year.
Future
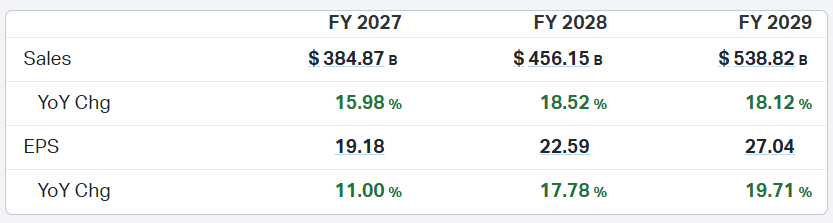
Consensus revenue: FY2027 $384.9B (+16.0%), FY2028 $456.2B (+18.5%), FY2029 $538.8B (+18.1%).
Consensus EPS: $19.18 -> $22.59 -> $27.04 (FY2027-FY2029). Growth accelerating from +11% to +19.7% as the capex depreciation wave gets absorbed. Five-year forward EPS CAGR: 15.4%.
Guidance for the next quarter: revenue of $89.85-90.95B (midpoint above the $89.7B consensus), Azure growth of ~45% in constant currency, operating margin roughly flat.
FY2027 guidance: double-digit revenue and operating income growth, operating margin down less than a point, capex growing year-over-year.
Analysts: Strong Buy (13 Strong Buy/40 Buy/3 Hold/0 Sell, 56 covering), average target $555.77, +21.4% upside. The lowest target on the street is $400.
Current Valuation
Price/Fwd Earnings: 23.9x vs 29.8x 5Y average
Price/Fwd Sales: 8.8x vs 10.4x
Price/FCF: 50.6x vs 40.7x (this is the capex distortion, not a rich price)
Price/Book: 7.7x vs 11.6x
PEG: 1.54 vs 2.23
Fwd Earnings Yield: 4.20% vs 3.05%
The stock is down 11% in a year while the forward EPS estimate rose 23%, so the multiple compressed from the mid-30s to 23.9x. On earnings, sales, book, and growth, Microsoft trades below its own -1 standard deviation band. The single expensive-looking metric, P/FCF, measures the capex cycle rather than the valuation.
The market currently pays roughly an S&P-level multiple for a business with 40% net margins and $678B of contracted demand.
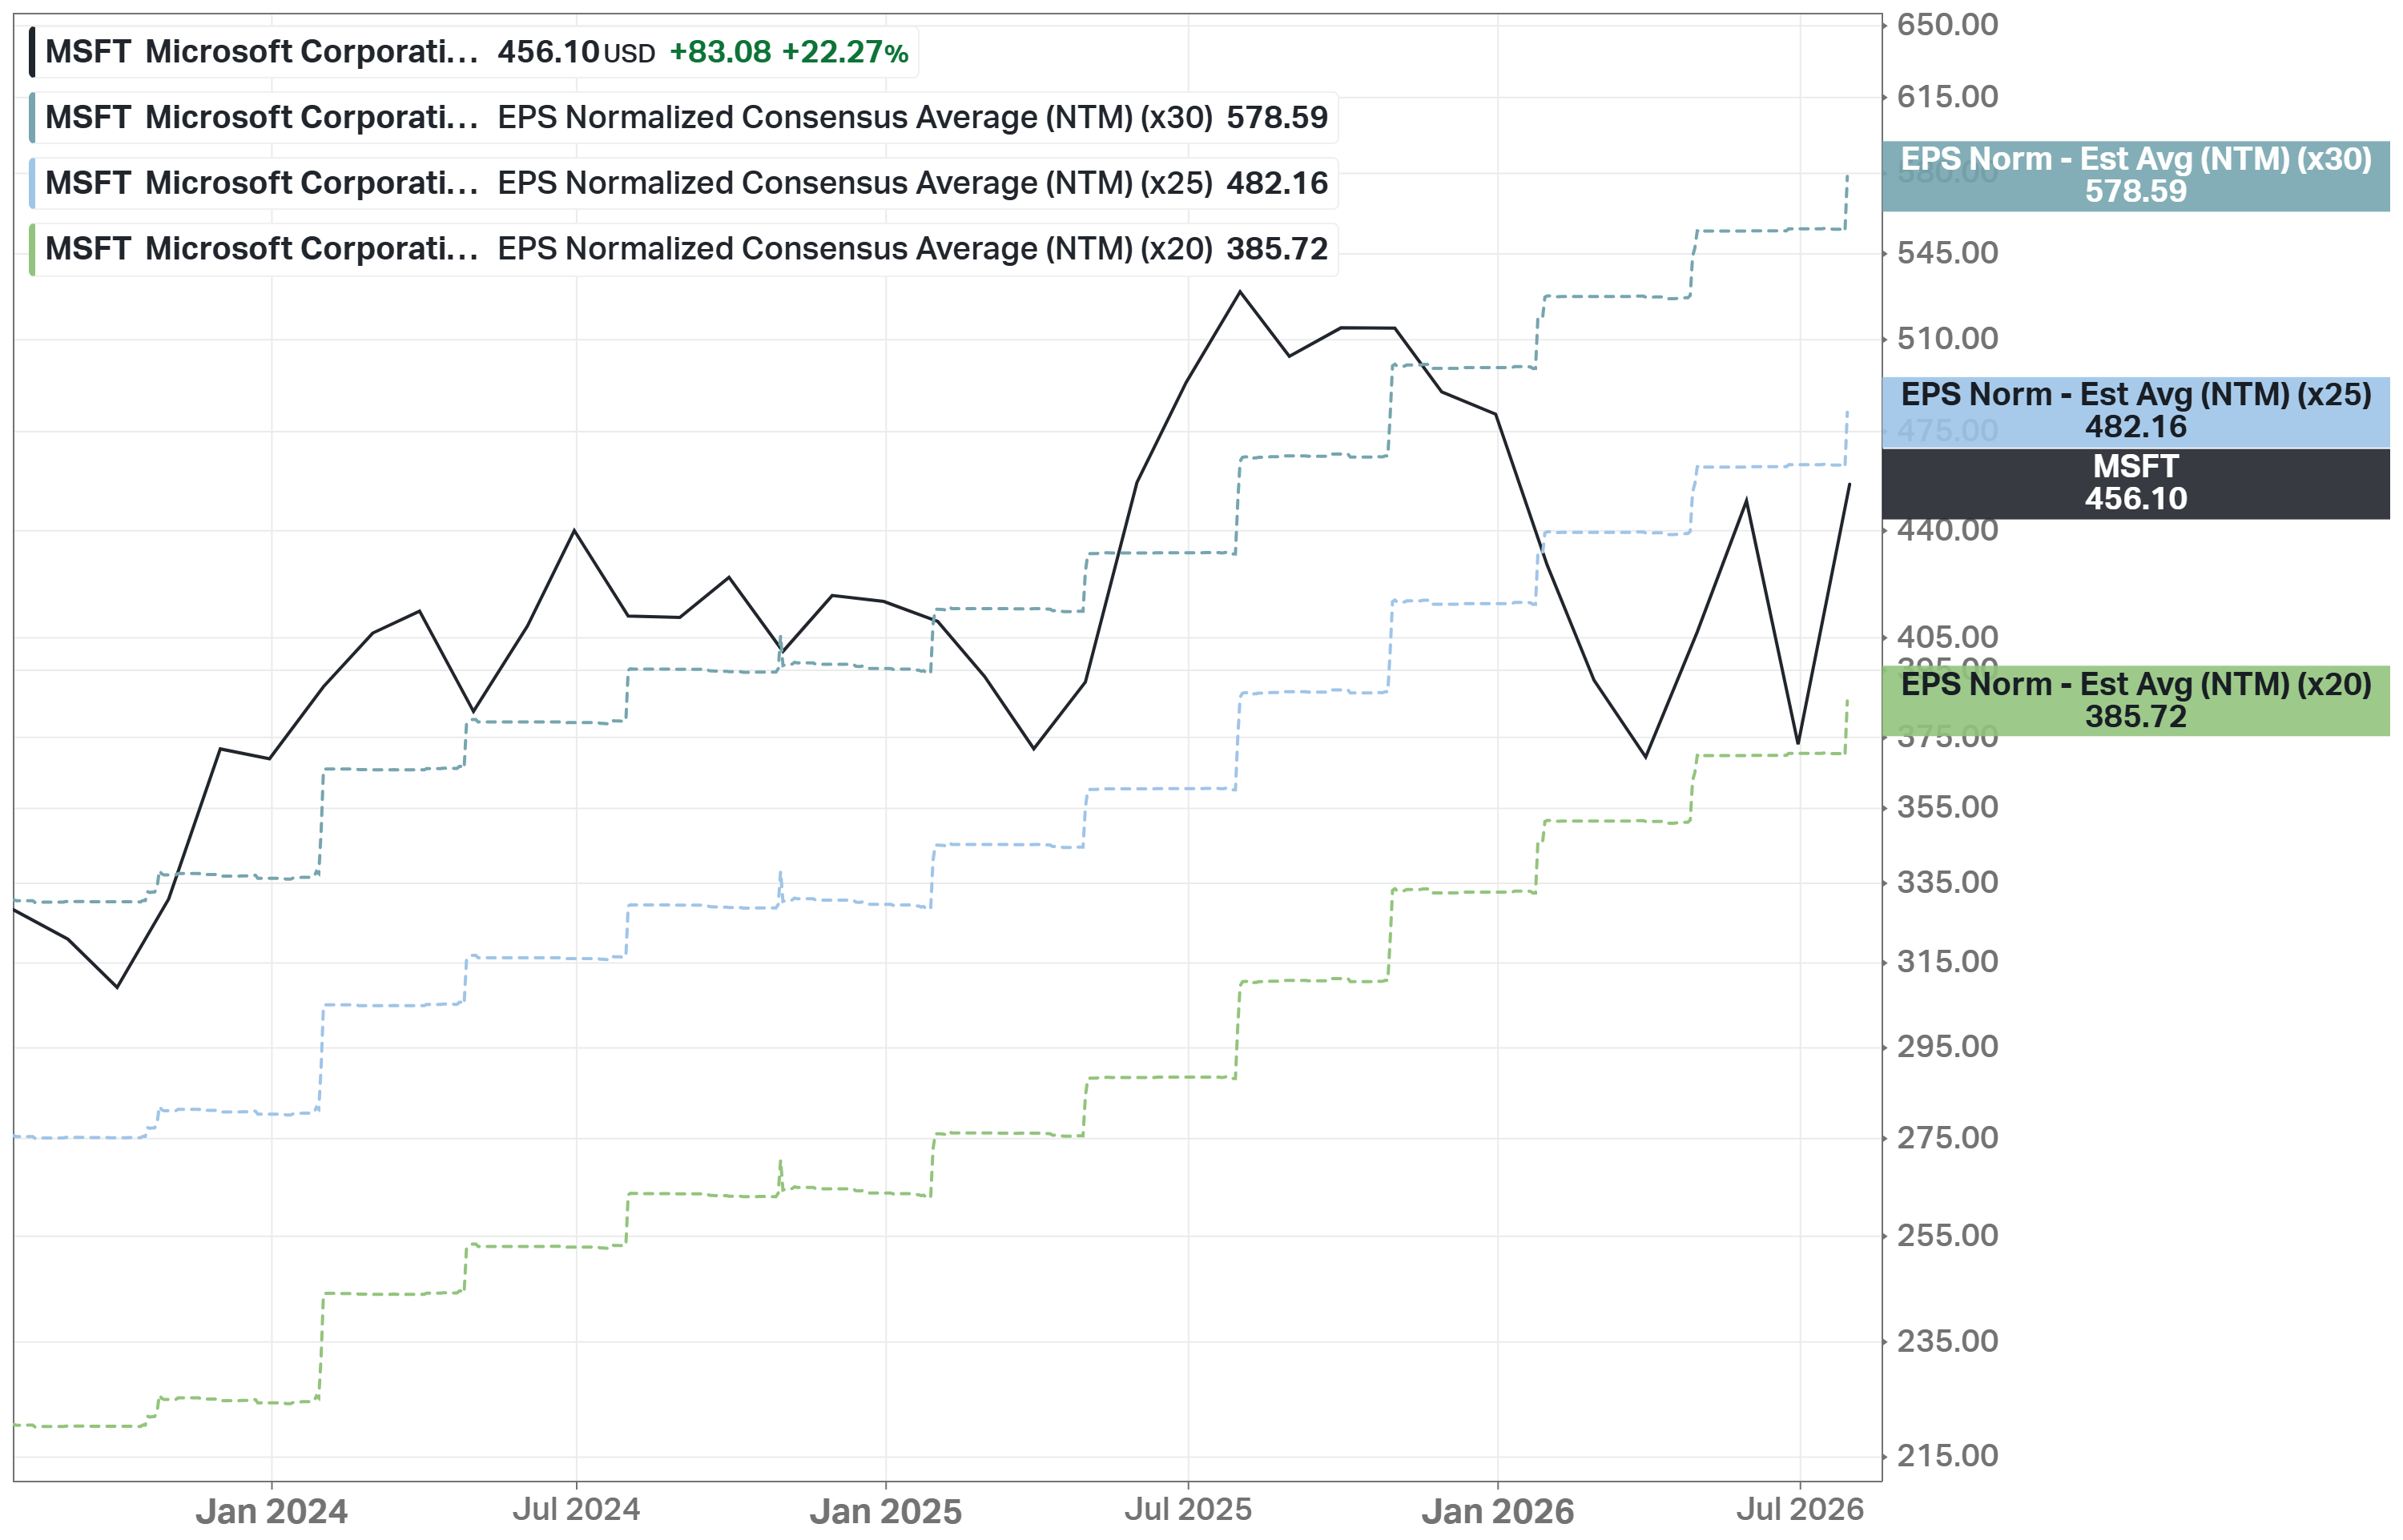
One chart frames this whole section. The corridor below takes the consensus forward EPS estimate and multiplies it by the three exit multiples from my fair price model: 20x - the July 2026 trough multiple (a market that never re-rates); 25x - roughly the -1 standard deviation band of recent years; and 30x - roughly Microsoft's own five-year average. Today that corridor runs from ~$386 to ~$579, and the price, at ~$457, is in the lower half of it, below the -1 SD line.
Fair Price
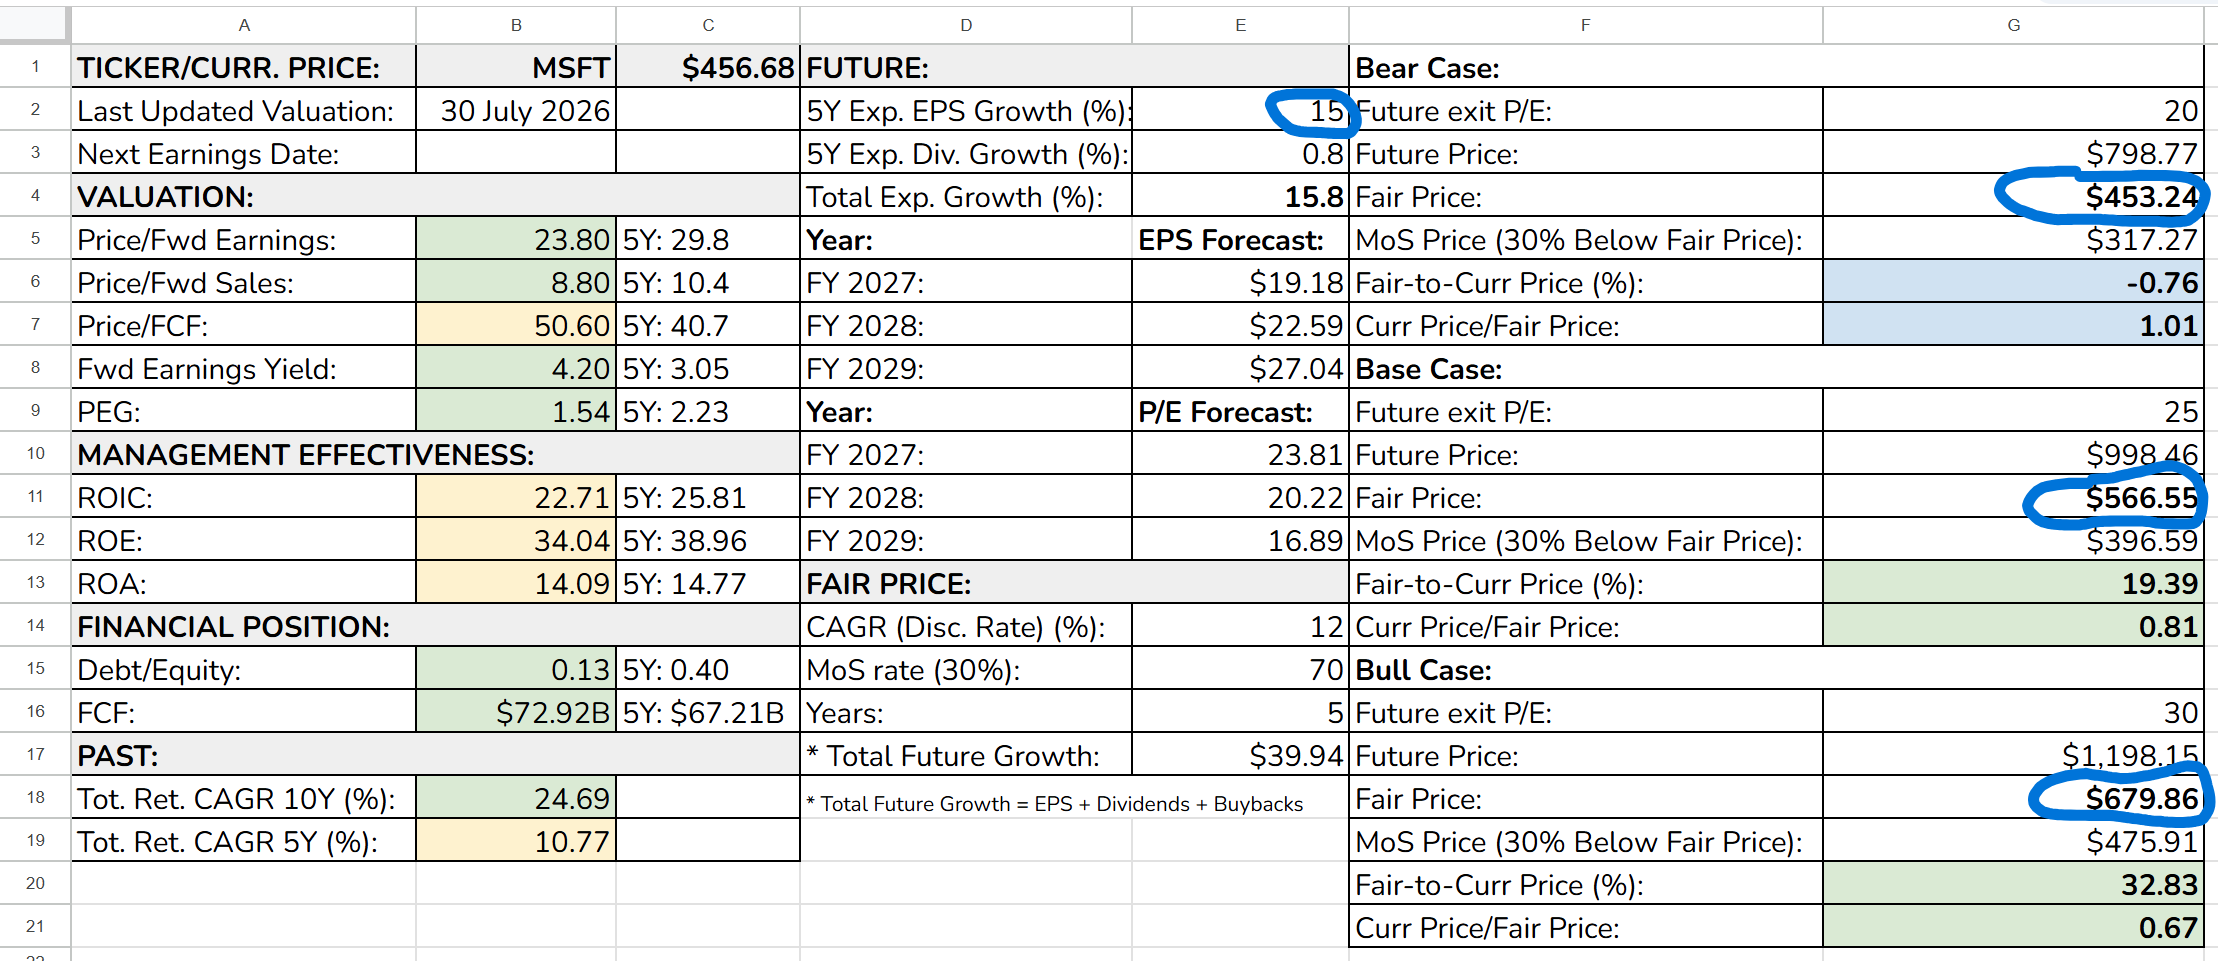
Consensus five-year EPS growth is 15.4% - I use 15%. I am not paying for a hypergrowth story - I am paying for visibility. With 0.8% from dividends, total expected growth is 15.8% a year, turning FY2027 consensus EPS of $19.18 into ~$39.94 by 2031.
The exit multiples are 20x/25x/30x: 20x is the trough the stock actually touched in July 2026 (the market never re-rates from the bottom), 25x is roughly the -1 standard deviation band of recent years (25.6x), and 30x is roughly Microsoft’s own five-year average (29.8x). Future prices are discounted at 12% a year, with a 30% margin of safety on top.
Bear case (exit P/E 20x): fair price $453 - MoS price $317
Base case (exit P/E 25x): fair price $567 - MoS price $397
Bull case (exit P/E 30x): fair price $680 - MoS price $476
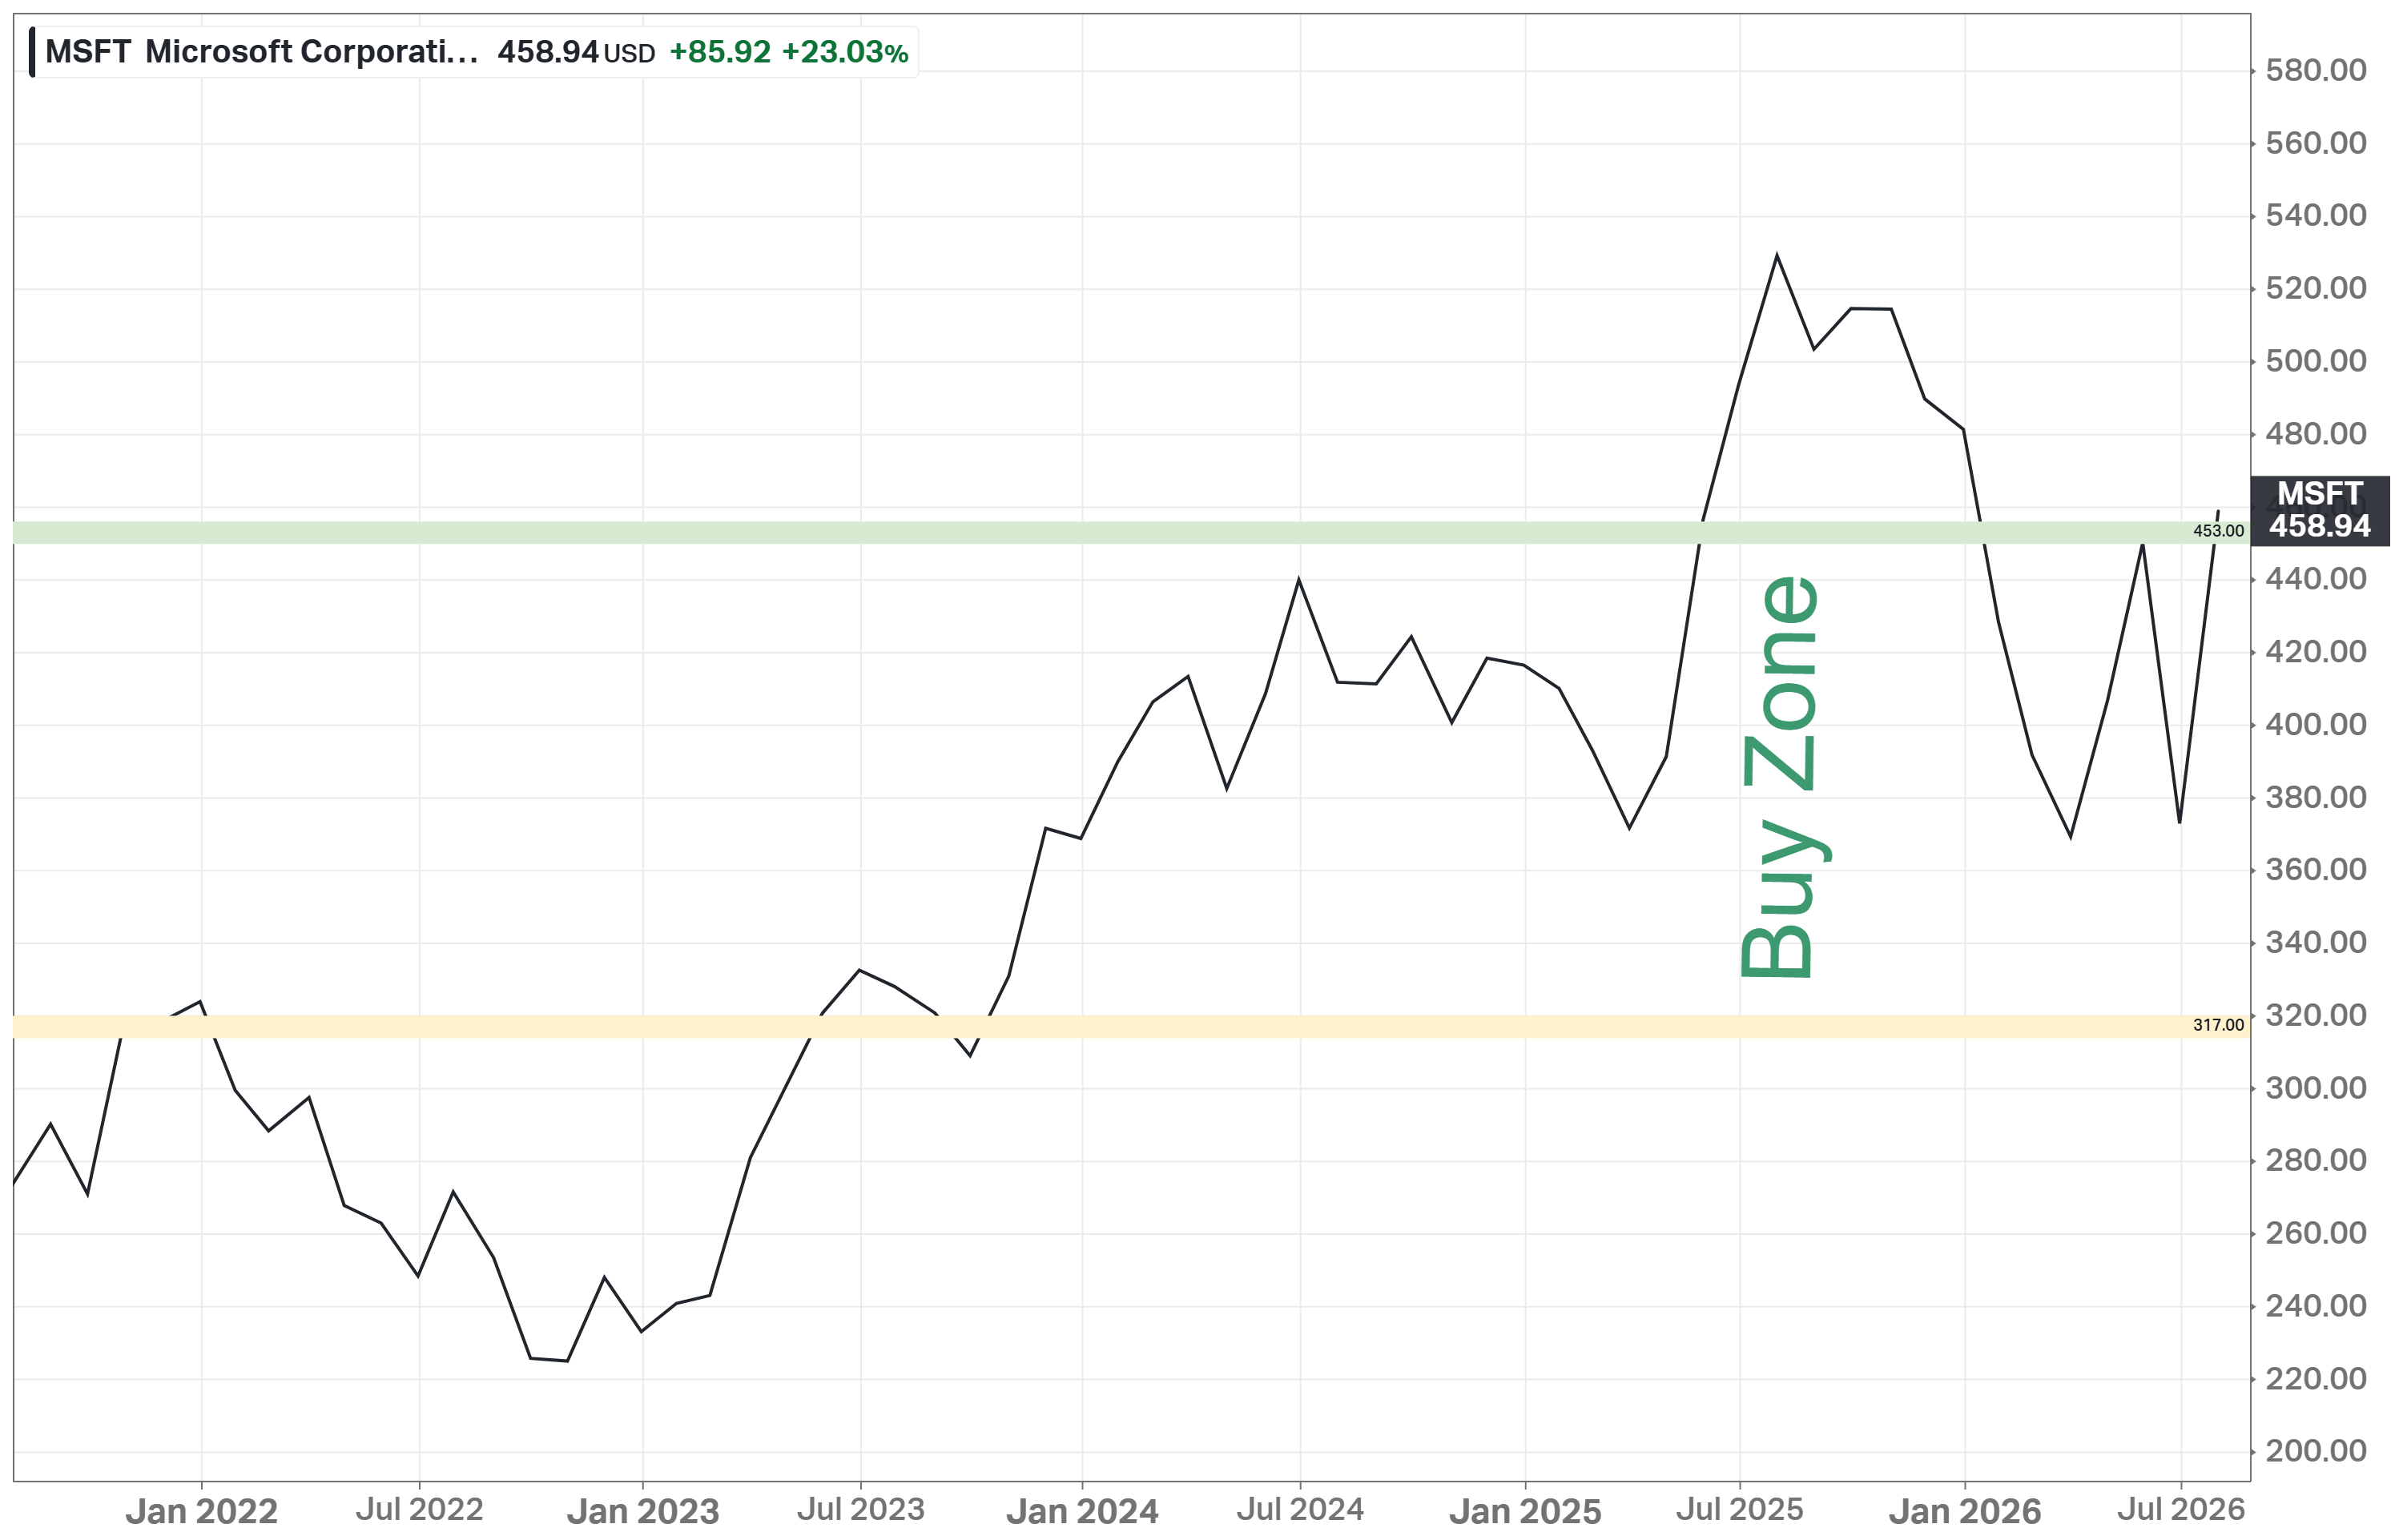
At ~$457, the stock trades right at the bear case fair price of $453 - the scenario where the multiple never recovers from its five-year trough is already fully in the price. Against the base case, the stock has ~24% upside to fair value. The accumulation zone is $317-453, and today's price is a bit above its upper edge. Consider buying the dip below $453.
Verdict: Microsoft belongs in a long-term portfolio as a core quality compounder. The lowest-risk way to own the AI buildout: the monetization runs through subscription software rather than cyclical hardware, and with a beta of 1.13, this is the calmest AI position in mega-cap tech. NVIDIA, for comparison, is at a beta of 2.21. I have been accumulating for years, and I would size up meaningfully toward the base case MoS price of $397, which roughly coincides with the lowest analyst target on the street ($400). The realistic bear case here is not a crash but dead money: two more years of multiple compression while capex digests. Buy with a multi-year horizon, and judge the thesis on Azure growth and Microsoft Cloud gross margin, not the share price.

Checklist
Profitability:
Gross margin at least 40%: 67.9%
Net margin at least 10%: 40.3%
FCF margin at least 10%: 20.2%
Management (ROIC, ROE, ROA): Yes (all above 10%: 22.7%/34.0%/14.1%)
Piotroski F-Score: 6 of 9
Revenue surprises in last 5Y: No (2022; Based on TradingView’s data)
EPS surprises in last 5Y: No (2022 and 2024; Based on TradingView’s data)
EPS growth YoY 5Y in a row: Yes
Valuation and Advantage:
Valuation below its 5Y averages: Yes (P/E, P/S, P/B, and PEG all below their -1 standard deviation bands; the one exception is P/FCF, distorted by the capex cycle)
Valuation below the industry: Mostly (P/Fwd E 23.8x vs AMZN 28.6x and GOOGL 25.1x; only ORCL is cheaper at 15.8x on 389% debt-to-equity)
Does it have a moat: Yes (wide)
Outperformed the S&P 500 10Y CAGR: Yes (24.7% vs 14.9%)
Shares:
Insider ownership at least 5%: No (under 1%, but normal for a 50-year-old mega cap)
Fewer shares outstanding YoY: Yes
Insider buys last six months: Yes (Feb; Based on FinViz’s data)
Price:
1Y stock price forecast is above 10%: +21.4%
Next 5Y EPS growth estimates (CAGR) is above 10%: Yes (15.4%)
Short Interest below 5%: Yes (1.20%)
Due Diligence
Profitability (10 of 12):
Positive Gross Profit: $225.47B
Positive Operating Income: $155.24B
Positive Net Income: $133.75B
Positive FCF: $67.0B
Exceptional 1Y Revenue Growth: 18% (FY2026)
Exceptional 3Y Revenue Growth: ~16% (per year for the last 3 years: $211.9B -> $331.8B)
Exceptional Revenue Growth Forecast: ~17.5% (per year over the next 3 years, consensus)
Exceptional ROE: 34.0%
Exceptional 5Y Average ROE: 39.0%
ROE is increasing: No (~49% in 2022 -> 34% - equity is growing faster than income during the buildout)
Exceptional ROIC: 22.7%
ROIC is increasing: No (~30% in 2022 -> 22.7% - the data center denominator effect)
Solvency (6 of 6):
Total assets ($758.4B) exceed total liabilities ($316.0B) by 2.4x
Negative Net Debt: -$20.0B (cash and short-term investments of $76.8B against $56.8B of total debt, leases included)
Low Debt-to-Equity Ratio: 0.13
Debt-to-Capital: 11.4% (5Y mean: 27.7%; the balance sheet keeps getting cleaner even through the capex cycle)
Interest coverage: ~51x ($155.2B of operating income against $3.1B of interest expense and interest income of $3.3B covers the bill on its own)
Altman Z-Score: ~8.2 (anything above 3 is the safe zone)
Watchlist Note
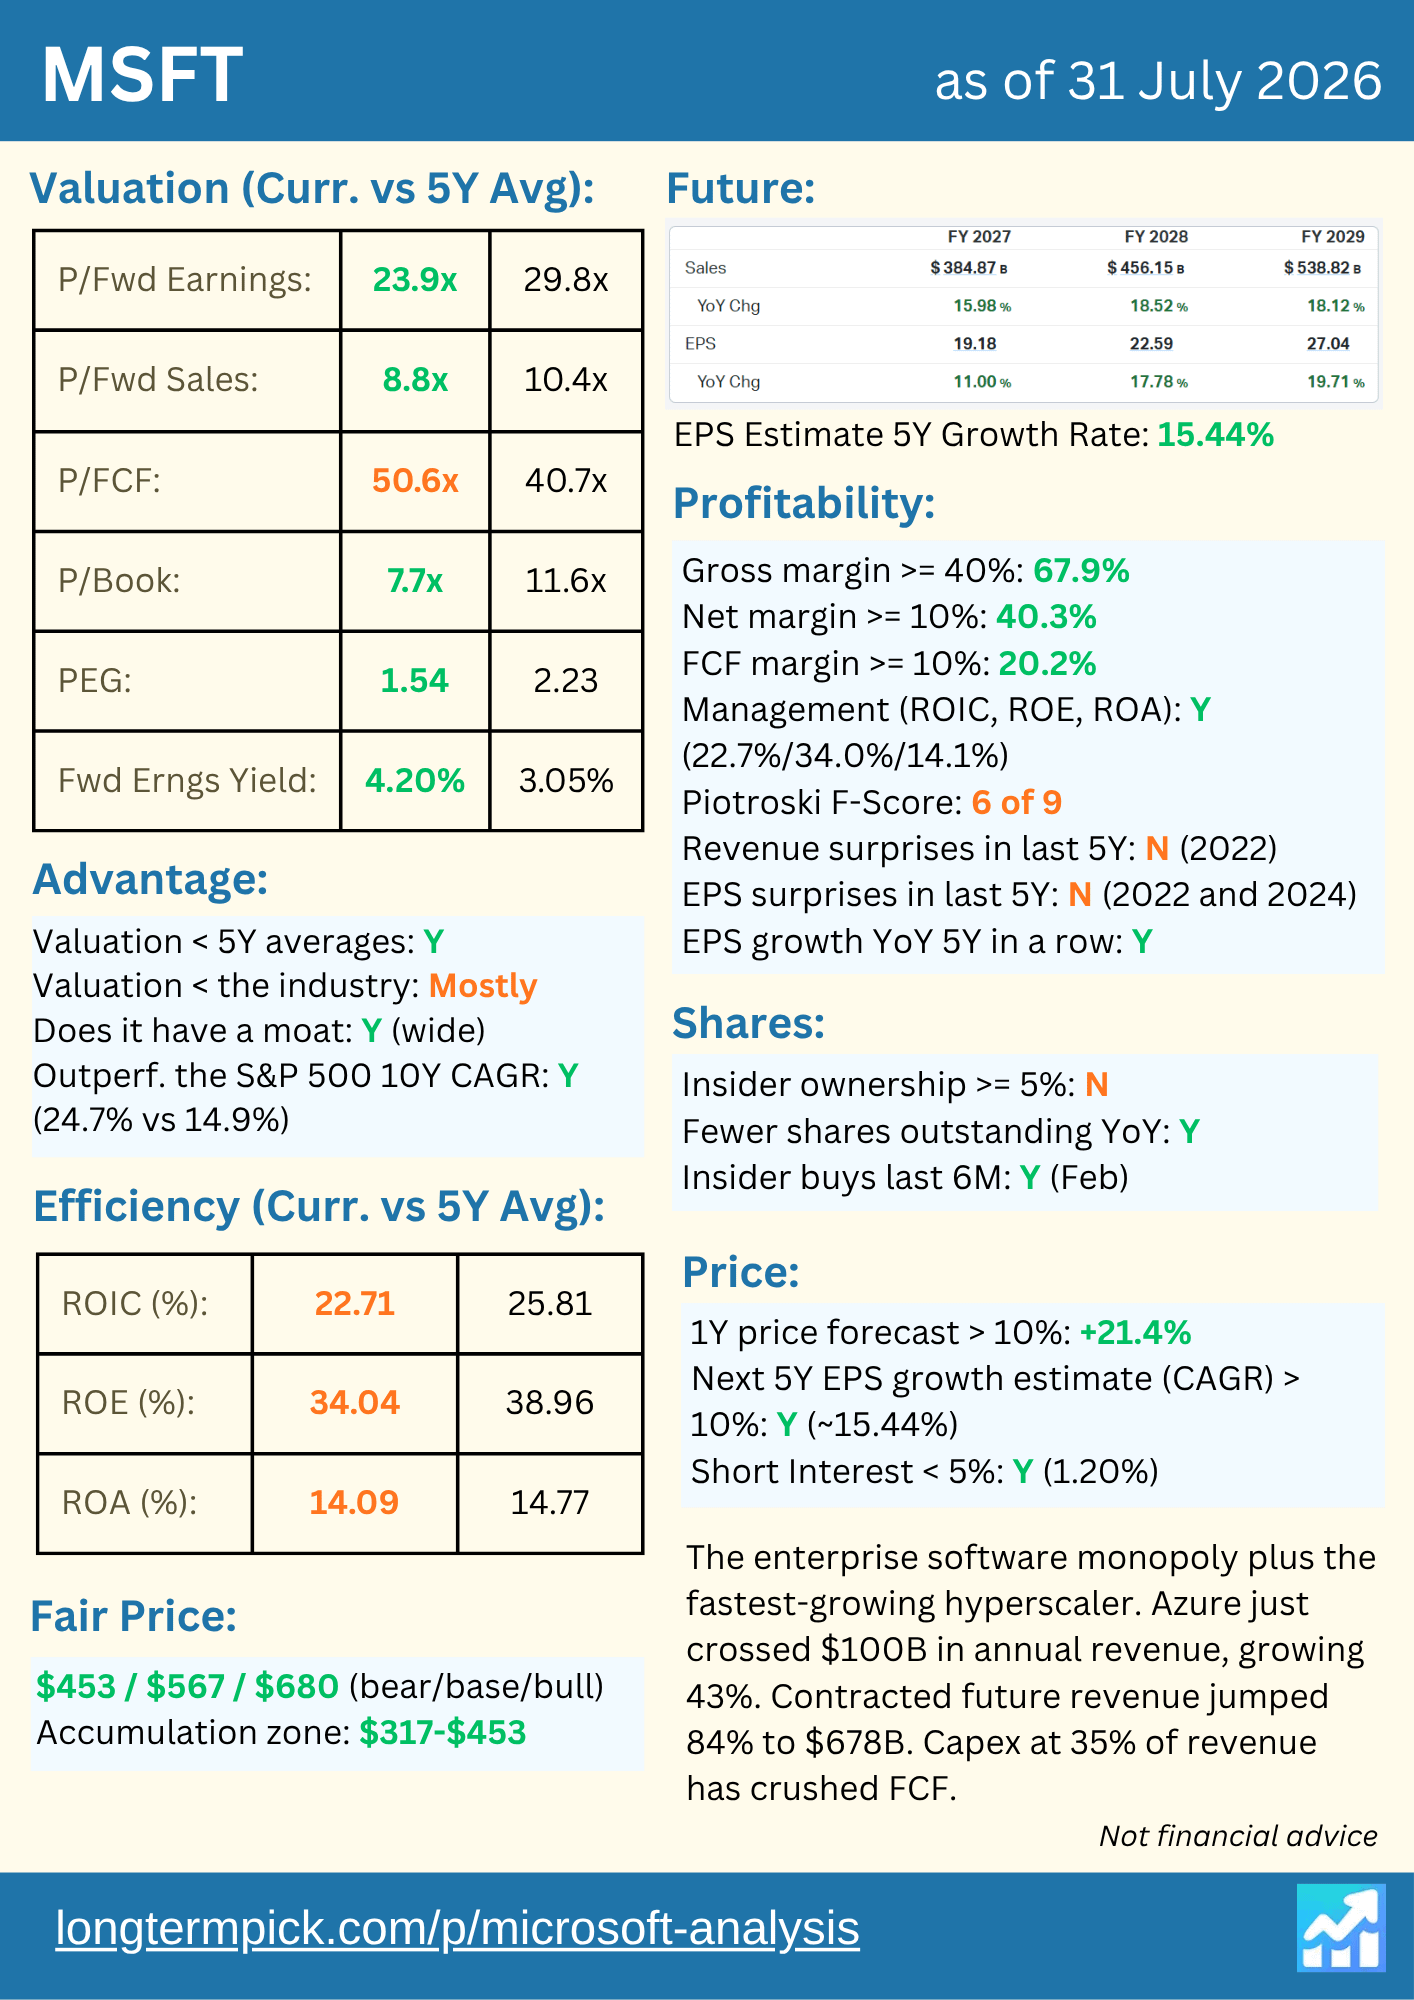
Enterprise software monopoly + fastest-growing hyperscaler (Azure $100B+, +43%). 23.9x fwd P/E vs 29.8x 5Y avg (below -1 SD) for 15.4% consensus EPS growth; PEG 1.54. 68% GM, 40% NI margin, 23% ROIC, net cash; RPO $678B +84%. Capex 35% of revenue crushes FCF - the bear case. Fair price: bear $453 / base $567 / bull $680 (15% growth). Accumulation zone $317-453. Watch: Azure >=35%, Cloud GM >=60%, capex/revenue turn. Earnings: late Oct.
One-Pager
This is not a financial or investing recommendation. It is solely for educational purposes.