

TL;DR: AppLovin (APP) owns the largest ad platform for mobile games and now sells the same full-screen ads to online shops. The Q3 2026 report answered the Q2 miss: revenue grew 55%. Even so, APP trades at 19.7x forward earnings, while consensus expects ~19% EPS growth next year. As I see it, this is one of the most profitable businesses I have analyzed. The discount comes from real doubts: growth depends on model releases, e-commerce is not proven yet, and there are lawsuits and founder control. My accumulation zone is $206-294. At $391, APP is a stock to watch, not one to accumulate: the price already allows for a lower multiple, but not a return to ~12x like in October.
Investment Thesis
In August, AppLovin missed the revenue consensus for the first time since 2022, and its adjusted EBITDA came in below its own guidance. By Oct 30, the stock had lost 69% from its December high. Then the Q3 report changed the picture: gaming grew nearly 50%, and consumer grew triple digits, even as the new model generation was only partly rolled out. Meanwhile, APP is still 47% below its high. So the question is simple. After +71% in a week, does the price still undervalue the business, or has the market already priced in the recovery?
Growth returned when bears expected a slowdown. Q3 revenue increased 55% YoY and 14% QoQ to $2.18B, the largest QoQ dollar increase in AppLovin’s history. Net income grew 72% to $1.44B, and FCF was $1.42B. For Q4, AppLovin guides for revenue of $2.365-2.395B (+43-44% YoY), ~6% above the pre-report consensus.
Consensus expects ~19% EPS growth next year; APP trades at less than 20x. The S&P Global consensus is $17.35 of EPS for 2026 and $20.70 for 2027, +19.3%. APP is at 19.7x forward earnings on Koyfin, and Koyfin’s PEG is 0.62 on a 32.01% 5Y growth estimate. On next year’s growth alone, PEG is ~1.0. So I see APP as cheap for its quality, but not as cheap as the 5Y PEG suggests.
The economics are exceptional. On an LTM basis, EBIT margin is 77.78%, FCF margin is 64.44%, and ROIC is 74.08%; each is far above its 5Y mean. Net debt is only $0.34B; AppLovin bought back $3.23B of stock LTM, about 2/3 of its FCF.
The multiple is below its mean, but the mean says little. APP trades at 19.7x forward earnings against a 25.0x 5Y mean. This mean includes the months after the 2021 IPO (~50-70x) and the 2022-2023 washout (~5-6x), when AppLovin still owned its low-margin games. A better reference, in my view, is the current business: APP traded at ~30-60x in 2025 and at ~12x on Oct 30.
The bear case is about trust - my model reflects that. Growth depends on model releases that management cannot schedule, AppLovin does not disclose how much revenue comes from e-commerce, and there are lawsuits, founder control, and large insider sales. My model prices the trust part through the Bear Case multiple: 12x, the level of the Oct 30 low. With the growth capped at 20%, the Bear Case fair price is $294 (the top of my accumulation zone) - APP is 33% above it. If growth also slows to 15%, the Bear Case falls to ~$238.
Analyst’s note:
AppLovin sold its own games (the Apps business) to Tripledot on Jun 30, 2025, for $430.6M in cash and ~22% of Tripledot’s shares. Since then, it is a pure advertising company, and I use only continuing operations for the history (the advertising business, which AppLovin called “Software Platform” before). AppLovin reports only GAAP EPS. The S&P Global consensus and the forward P/E use adjusted EPS. The price anchor is the Nov 06 close of $391.22.
Company Overview
Next Earnings Date: mid-February 2027 (estimated)
Market Cap: $129.62B
Sector: Communication Services | Industry: Advertising Technology
Type: Large Growth
Short Interest: 4.26%
AppLovin connects advertisers with the apps that show their ads. Most of these apps are mobile games, and AppLovin says its ads reach over 1 billion daily active users. A typical ad is a full-screen video or a playable mini-game that users watch for a reward or between levels. Adam Foroughi co-founded AppLovin in 2012 and has managed it as the CEO since then; Matt Stumpf is the CFO. In April 2026, Foroughi gave the Chair role to Craig Billings, an independent director, but he still controls 61.6% of the votes. AppLovin is a single segment with four products, according to the Q3 10-Q:
AppLovin Ads (the demand side): advertisers buy installs, purchases, or other actions, then the AXON models predict which user is most likely to act on which ad. It “comprises the vast majority of revenue”.
MAX (the supply side): an auction inside the app, where every ad network bids for each ad impression. AppLovin earns “a percentage of winning auction spend”.
Adjust: ad campaign measurement, sold as a software subscription.
Wurl: tools for streaming channels on connected TV (CTV).
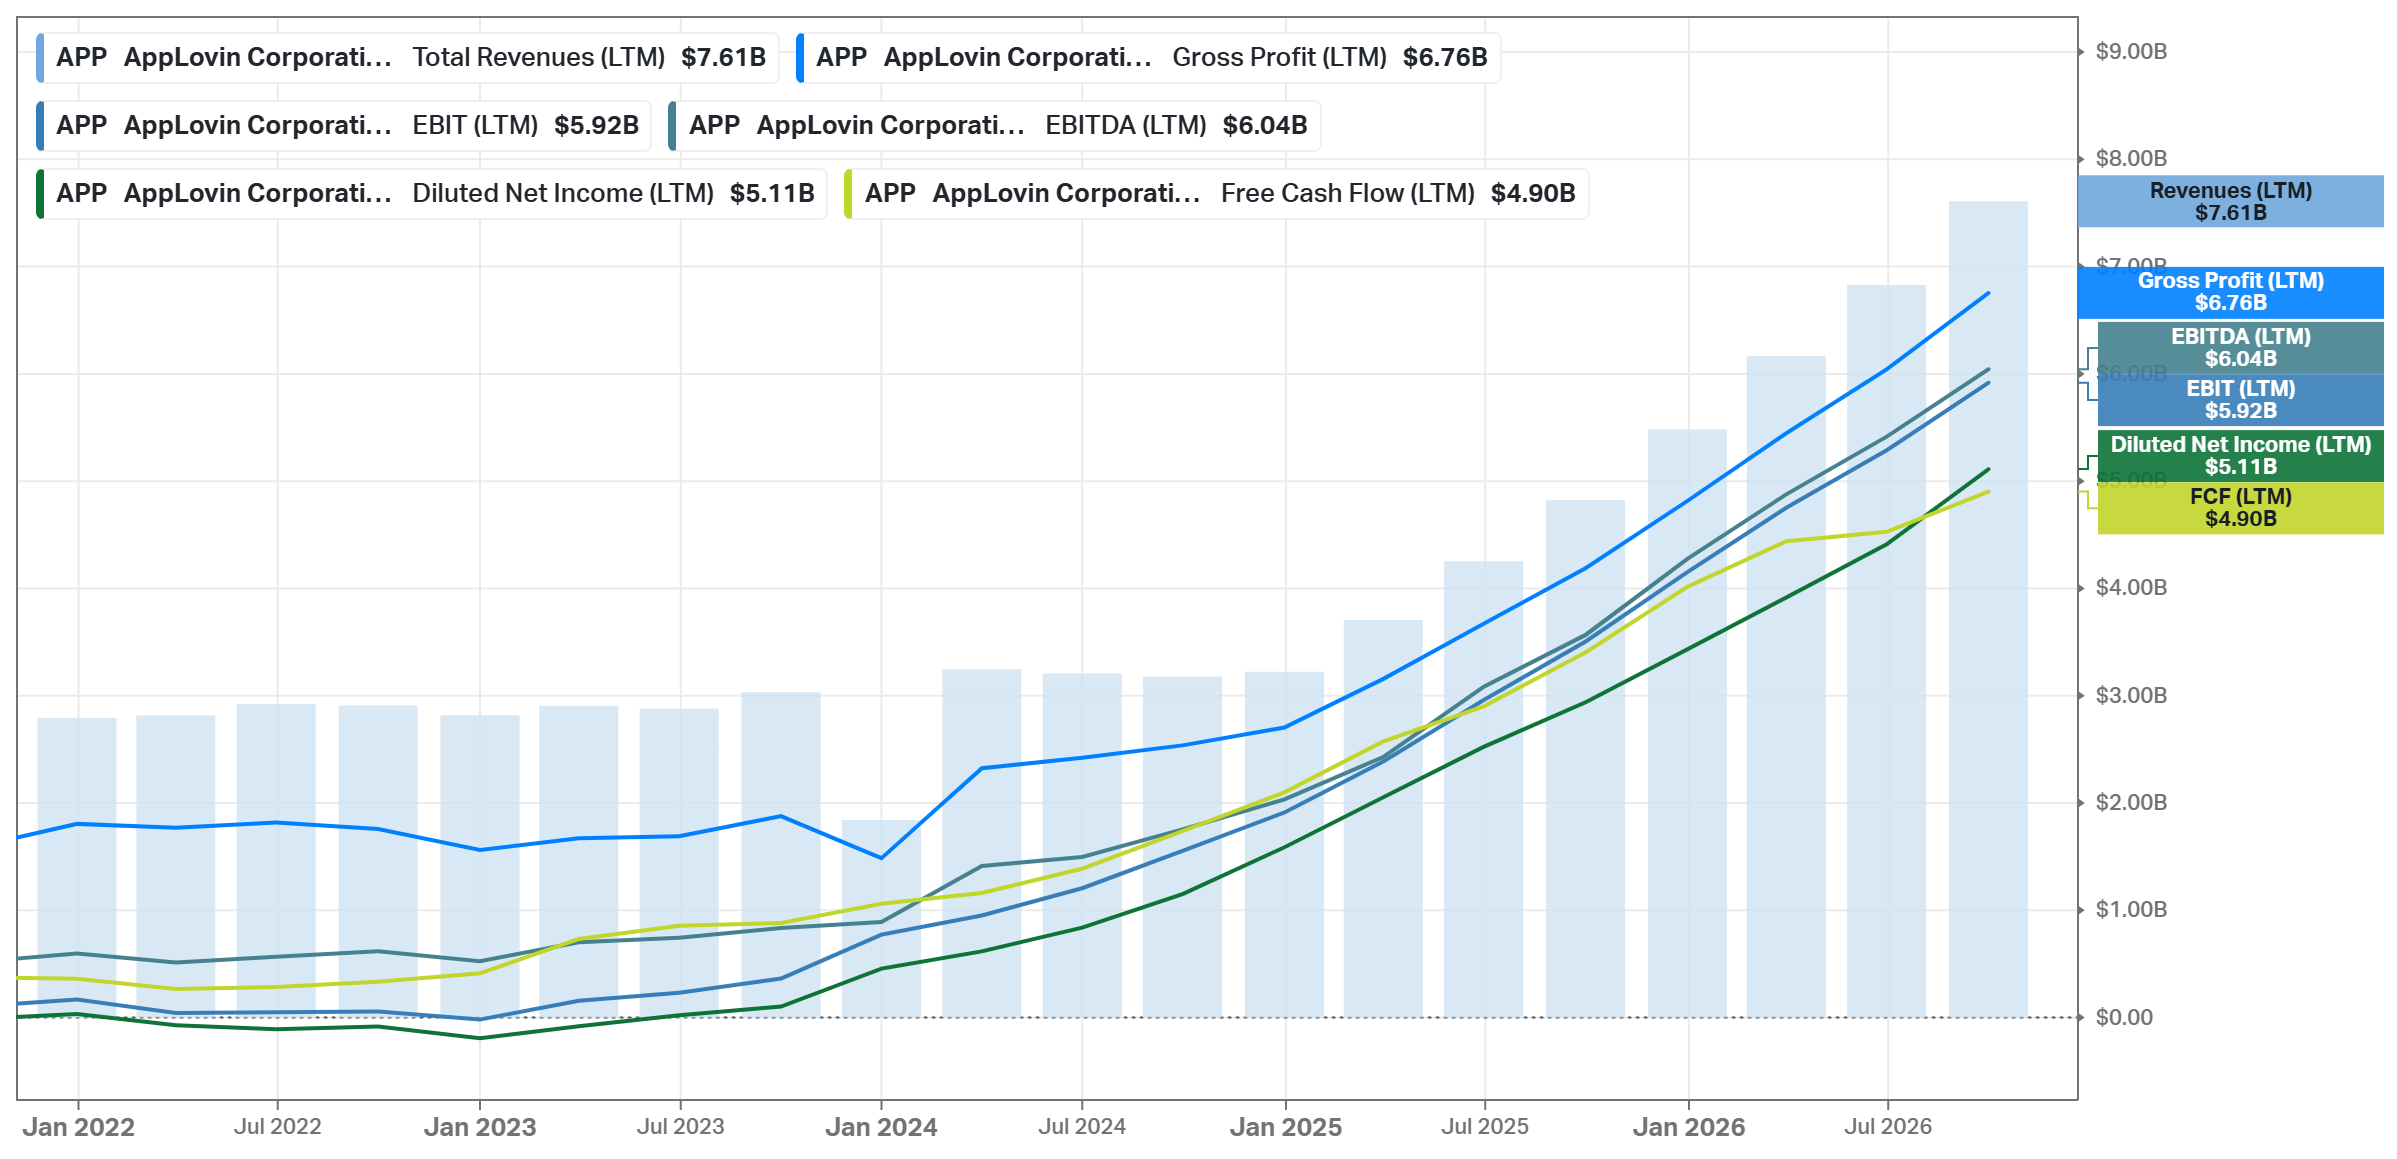
The years before mid-2025 include the Apps business.
The business model is a share of the ad dollar. AppLovin books revenue net: what advertisers pay minus what AppLovin pays app publishers. The company does not disclose gross spend, but at the All-In Summit in September, the CEO said gross spend through AppLovin’s ecosystem was approaching ~$20B annualized, and management did not correct an analyst who repeated it on the call. Against Q3 revenue times 4 ($8.74B), AppLovin keeps ~44% of every ad dollar (its take rate), by my rough estimate. If the figure also counts MAX spend that other networks win, the real share is higher - I cannot check how much.
The costs are small. Data centers were $194.6M in Q3, 8.9% of revenue, down from 10.0% a year ago. Personnel was only $53.0M, plus $84.2M of SBC, which AppLovin reports separately. This is why 88.78% of revenue becomes gross profit and 77.78% operating profit.
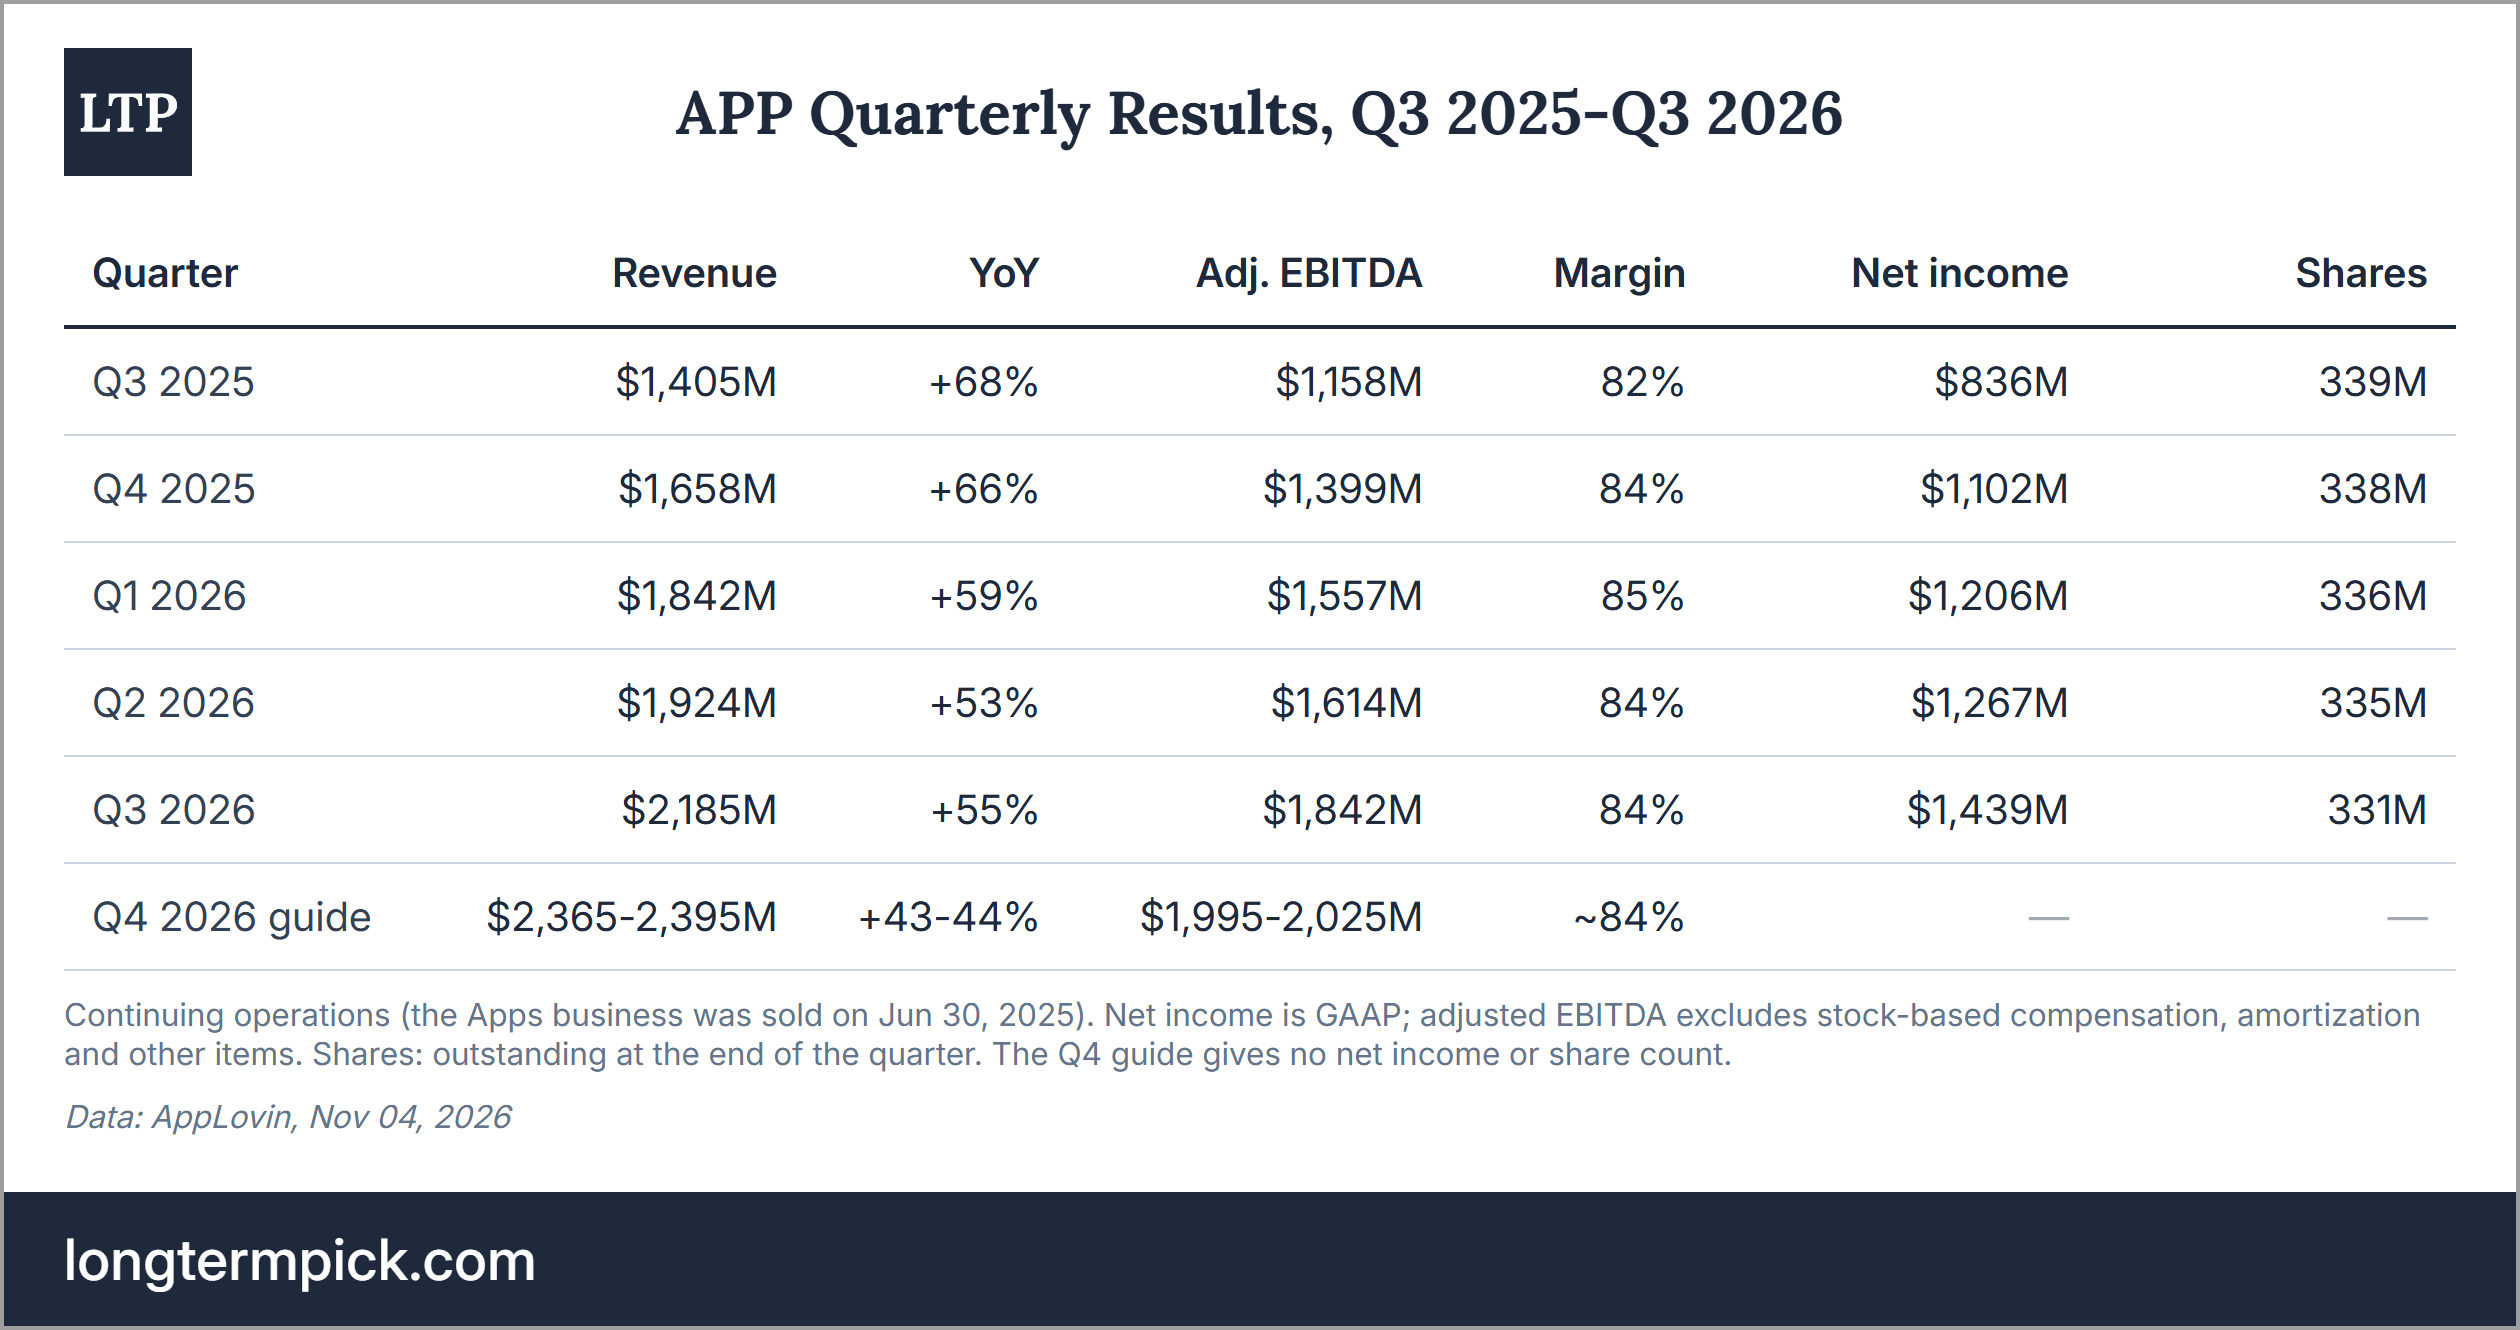
Two businesses use one auction. Gaming is still “the majority of our revenue”, as the company said in August. The second one, consumer (online shops and other non-gaming apps), has had e-commerce advertisers since 2024, first in a pilot; the self-serve platform opened on a referral basis in October 2025 and to all advertisers in June. AppLovin does not split the two: “we do not break out obviously between gaming and consumer”, the company said on the Q3 call. We only know that gaming grew “nearly 50%” in Q3, and consumer spend grew “double digits” QoQ and “triple digits” YoY.
By my rough calculation, consumer is ~8-17% of revenue now. I get this from 55% total growth, with gaming at ~48-50% and consumer at +100-150%. The last share management gave was for Q1 2025: in February, they said e-commerce was “roughly 10%” of the business then. I think this lack of disclosure is one reason for the discount.
Market Overview
The ad market grows ~10% a year; mobile apps are one of its fastest-growing segments. WARC expects global ad spend of $1.34T in 2026 (+11.9%) and $1.46T in 2027 (+8.4%). AppsFlyer reported that spending to acquire app users was $78B in 2025 (+13%). Non-gaming apps were $53B (+18%); shopping apps grew 70%. Gaming was only $25B and grew 3%.
AppLovin’s own estimate is larger. The company calls the game ads market “in the tens of billions”; at the All-In Summit, the CEO put the whole space at more than double AppLovin’s ~$20B in gross spend. The numbers differ because the sources count different things; I use the third-party figure as the floor.
Mobile games themselves are not a growth market. In the first half of 2026, game downloads and in-app purchases decreased (in-app purchases by 2%), while game ad spend grew 8%, according to Sensor Tower. The reason is simple: game publishers spend more on ads to win players from each other - AppLovin earns from this competition. At the same time, it means AppLovin’s gaming growth comes from a larger share and better models, not from a growing pie. In 2025, the company said AppLovin’s penetration of gaming was “materially higher than 70%”; in November, they said, “We have every mobile gaming company live, probably.”
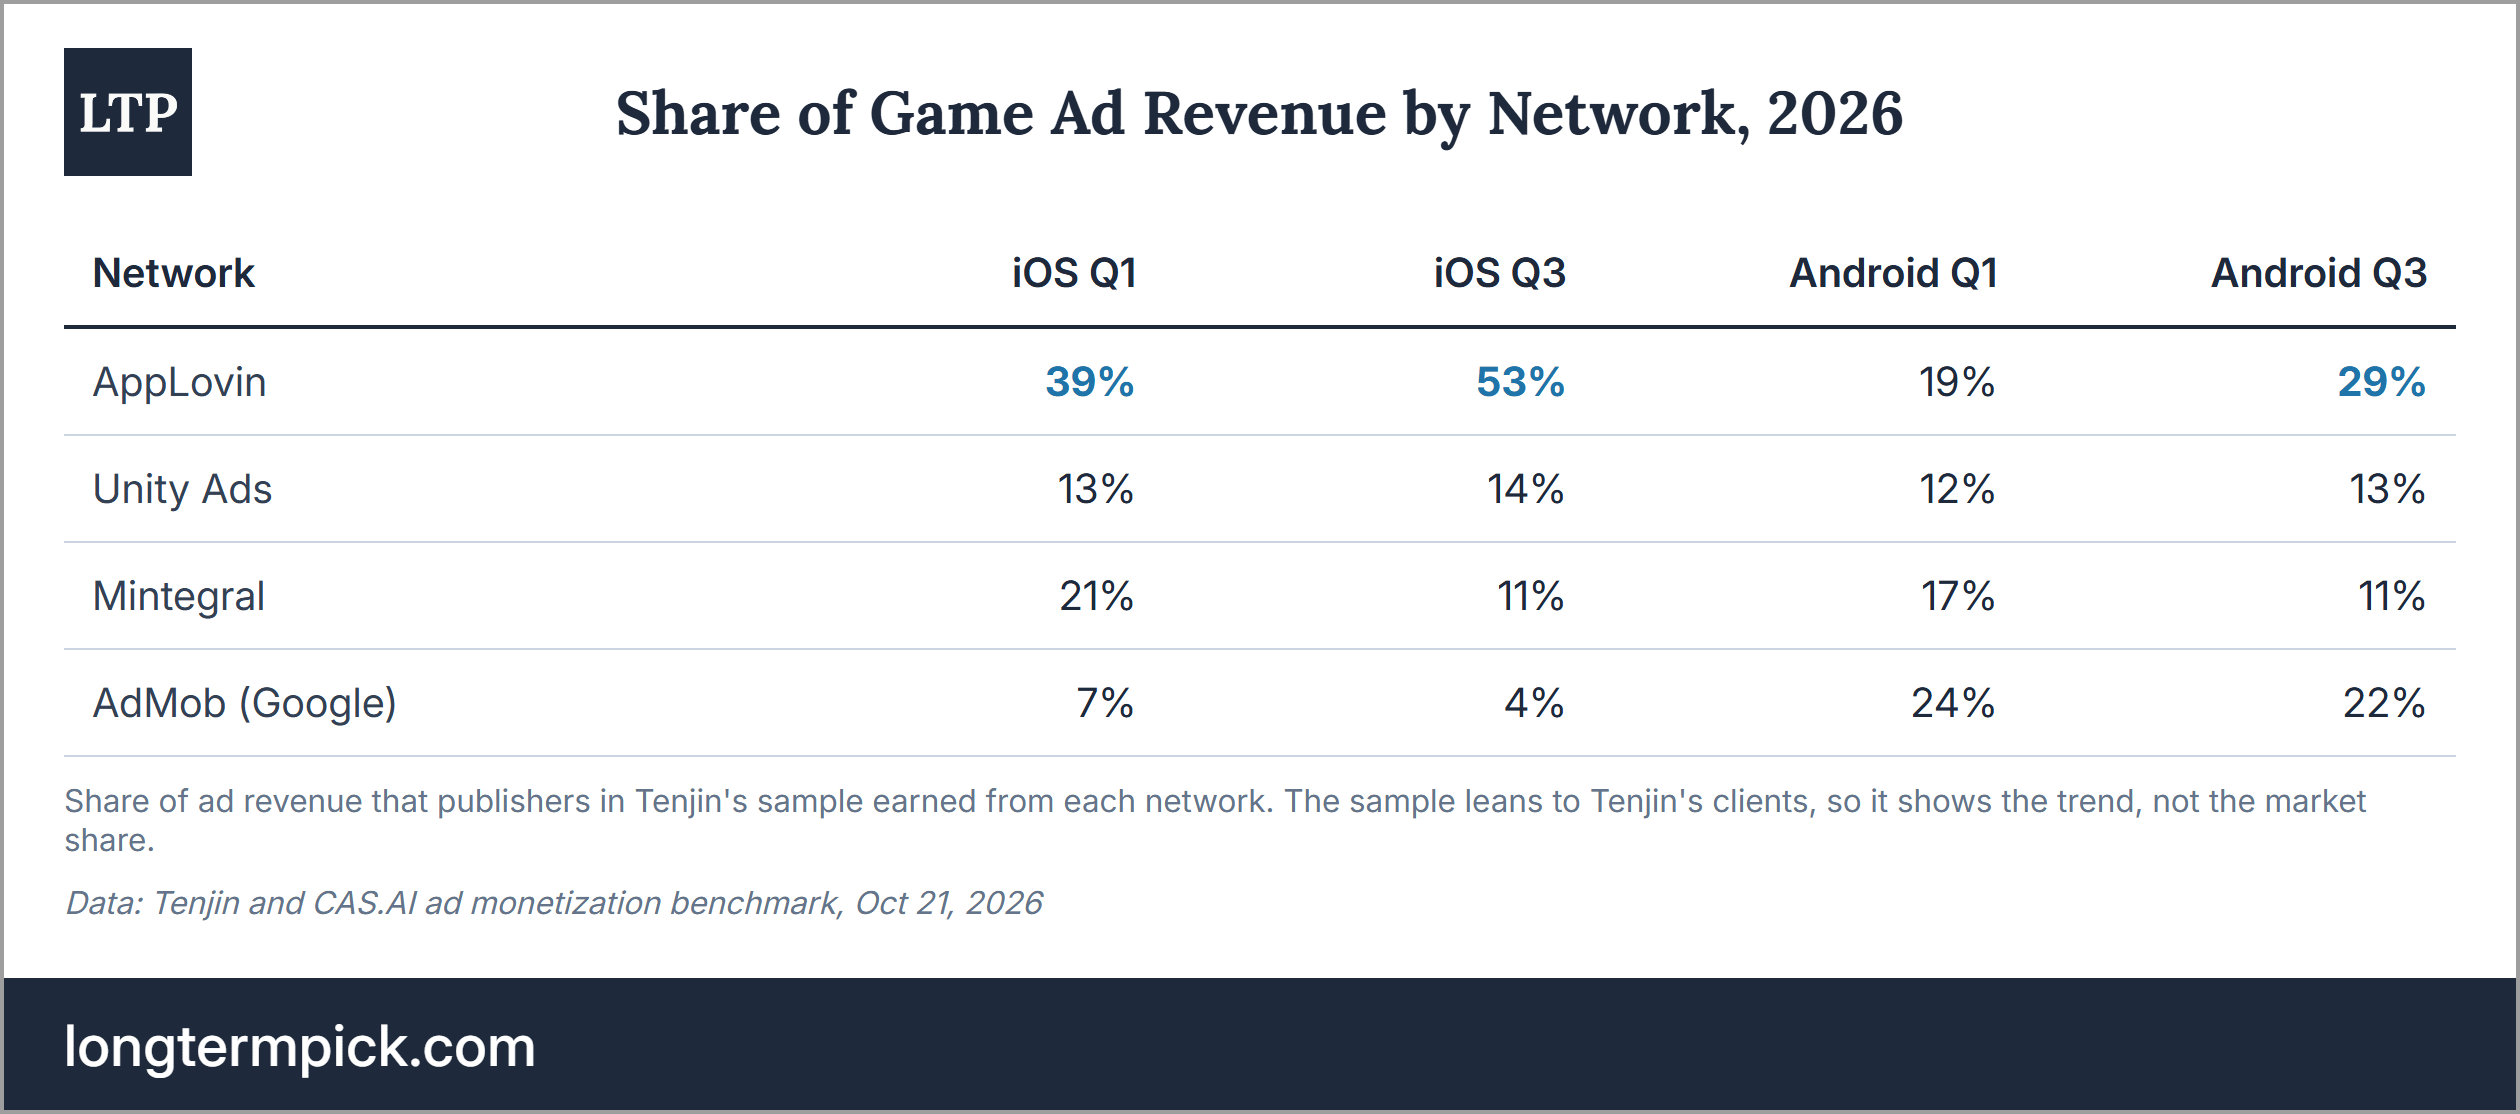
AppLovin gains share in game ads, and the competition grows too. In Tenjin’s Oct 21 benchmark, AppLovin earned 53% of game ad revenue on iOS in Q3 2026, up from 39% in Q1 and 42% a year earlier. On Android, it is first with 29%. AppLovin and Google’s AdMob together have 65% of mobile game ad revenue, according to Sensor Tower. In Tenjin’s sample, Mintegral and AdMob lose share, while Unity is flat. And Unity is not standing still: its Vector ad platform grew 126% YoY in Q3, and Unity guides for 105-107% growth of Strategic Grow (its ad revenue without the ironSource network it closed in Q2) in Q4. The company’s answer is that the market “is not zero sum”.
Additionally, the two companies are in court. Unity’s Ad Quality tool reads data inside MAX (the revenue, creatives, and engagement of the ads AppLovin wins), and AppLovin says Unity may have used this data to train its models. In September, AppLovin asked a court to stop it; on Oct 02, the court refused a temporary order (a quick ban before the full case), and Unity called it “a classic case of a dominant incumbent resorting to litigation and intimidation”. As I see it, this shows the weak spot of owning the auction while being its largest bidder: if Unity bids more inside MAX, AppLovin’s take rate (the share of each ad dollar it keeps) can decline.
E-commerce is the larger market. Social media ads alone will be $394.6B in 2026, according to WARC, so even a small share would be large for AppLovin. The best independent data I found is from Haus, which sells brands tests of whether an ad brought sales that would not have happened anyway. In its tests, AppLovin beat the typical channel in 63-85% of the cases per quarter in 2025, but only 53% in Q1 2026 and 50% in Q2 2026; at 50%, it was no better than the average channel. At the same time, ~66% of the customers AppLovin brought were new to the brand, and the brands that tested it in 2026 raised their AppLovin spend by more than 50%. Wells Fargo counted only ~6,000 e-commerce sites on AppLovin in June, against 118,000 for Snapchat, and does not expect an inflection before 2027. This suggests the channel works, but the early, easy returns are over, and growth now depends on AppLovin’s models and the advertisers’ creatives.
The platform owners set the rules. Apple’s App Tracking Transparency (ATT) limits data about iPhone users; Meta today bids in mobile app auctions only on traffic with a device ID. The company said in February that Meta “might very well bid on no ID traffic in the next couple of quarters”. As far as I found, it has not happened yet. On Android, the company admits it “is more competitive because there’s a very big competitor out there”, Google. In my view, this is the market’s main structural risk: AppLovin builds on platforms it does not control.
Economic Moat
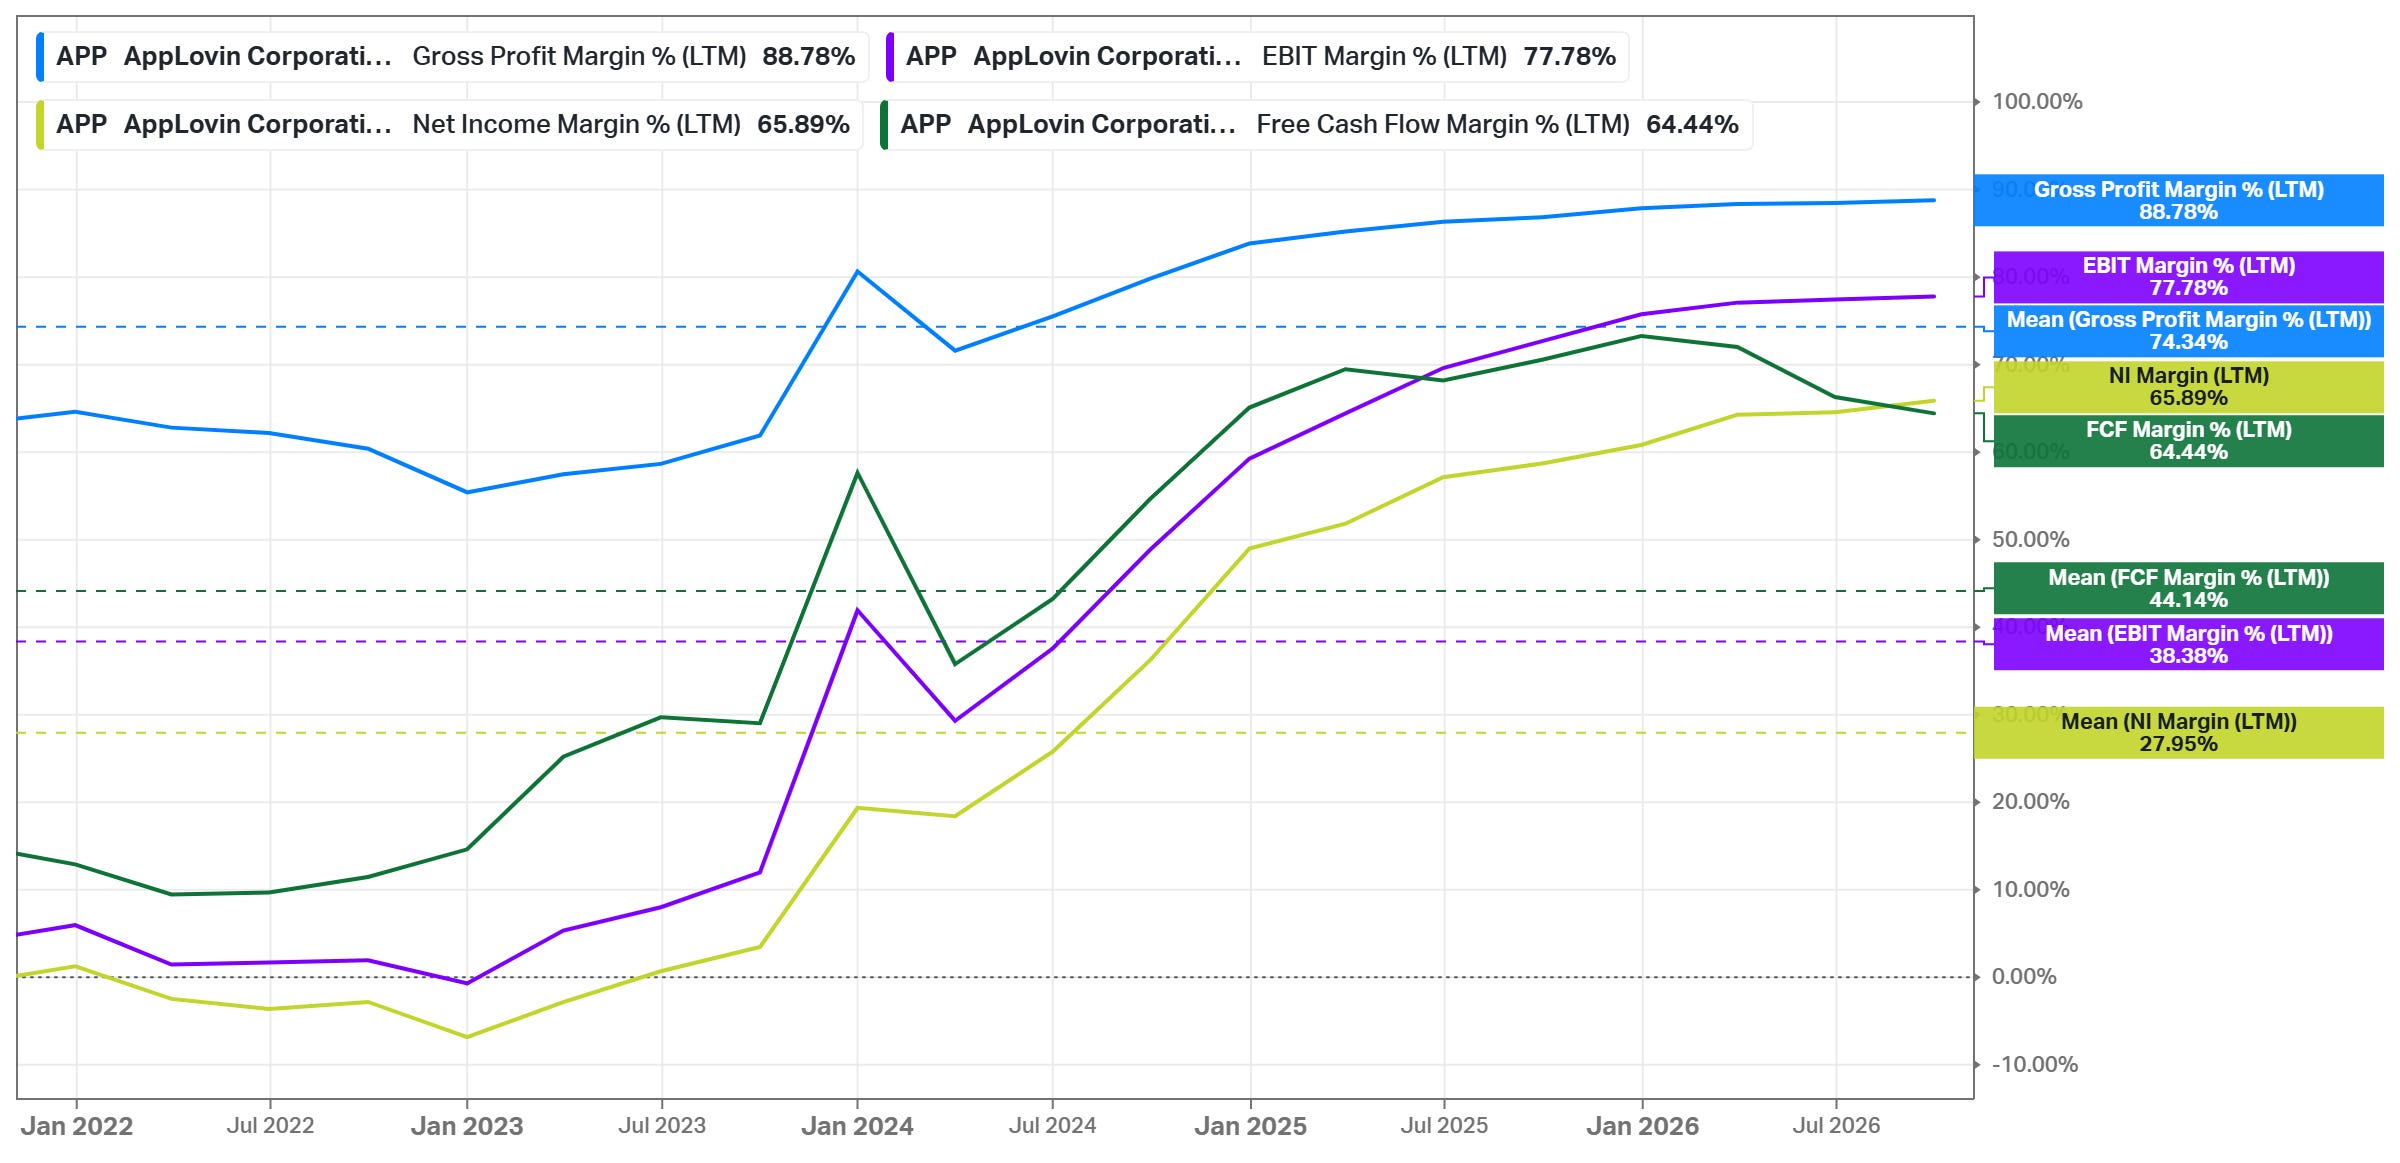
Every margin is far above its 5Y mean. On an LTM basis, gross margin is 88.78% vs. a 74.34% 5Y mean, and EBIT margin is 77.78% vs. 38.38%. Net margin is 65.89% (mean: 27.95%), and FCF margin is 64.44% (mean: 44.14%). Those means are low because they include 2022-2023, when AppLovin owned games with much lower margins.
Still, the FCF margin fell this year from ~72% at the start of 2026 because of the timing of cash taxes. Stumpf now expects FCF of 70-75% of adjusted EBITDA for the full year, against “approximately 75%” in May; the first 9 months were 71%.
The moat is a loop of supply, data, and models. MAX is in most of the top ad-supported games (73% of the top-downloaded ones in March 2025 data), so AppLovin sees a huge number of auctions every day and learns from every ad it wins. Better predictions let advertisers bid more for the same impression; publishers earn more, so they keep MAX, and more supply comes in. A newcomer needs supply and data at the same time, and neither comes without the other. The company described the MoPub purchase in 2022 as the deal that made MAX what it is: “we put it out of business in 90 days. But we got all the customers over to our platform”.
The best evidence is revenue that grows faster than the cost of serving it. In Q3, revenue increased 55%, while data center costs grew 38%. Personnel costs are the exception. With SBC, they grew 64%, from $83.8M to $137.2M, faster than revenue; without SBC, only 6%. Even with SBC, personnel is only 6.3% of revenue. AppLovin trained bigger models this quarter, and still “data center costs declined as a percentage of revenue.” Of the extra revenue QoQ, 87% reached adjusted EBITDA (which excludes SBC). This suggests the advantage is in the models, not in spending.
The moat’s weak point is that it must be renewed every year. The company explains the risk in plain terms: “If we innovate at the rate of the market, the market pricing stays consistent... If we fall way behind... our take rate will contract”. Q2 2026 showed what a lighter quarter looks like: “Our pace of meaningful model improvement was lighter than normal”, and revenue came in below the midpoint of the guidance. So the moat is not a network that protects itself, like Visa’s; it is a lead in technology and data that AppLovin has to maintain.
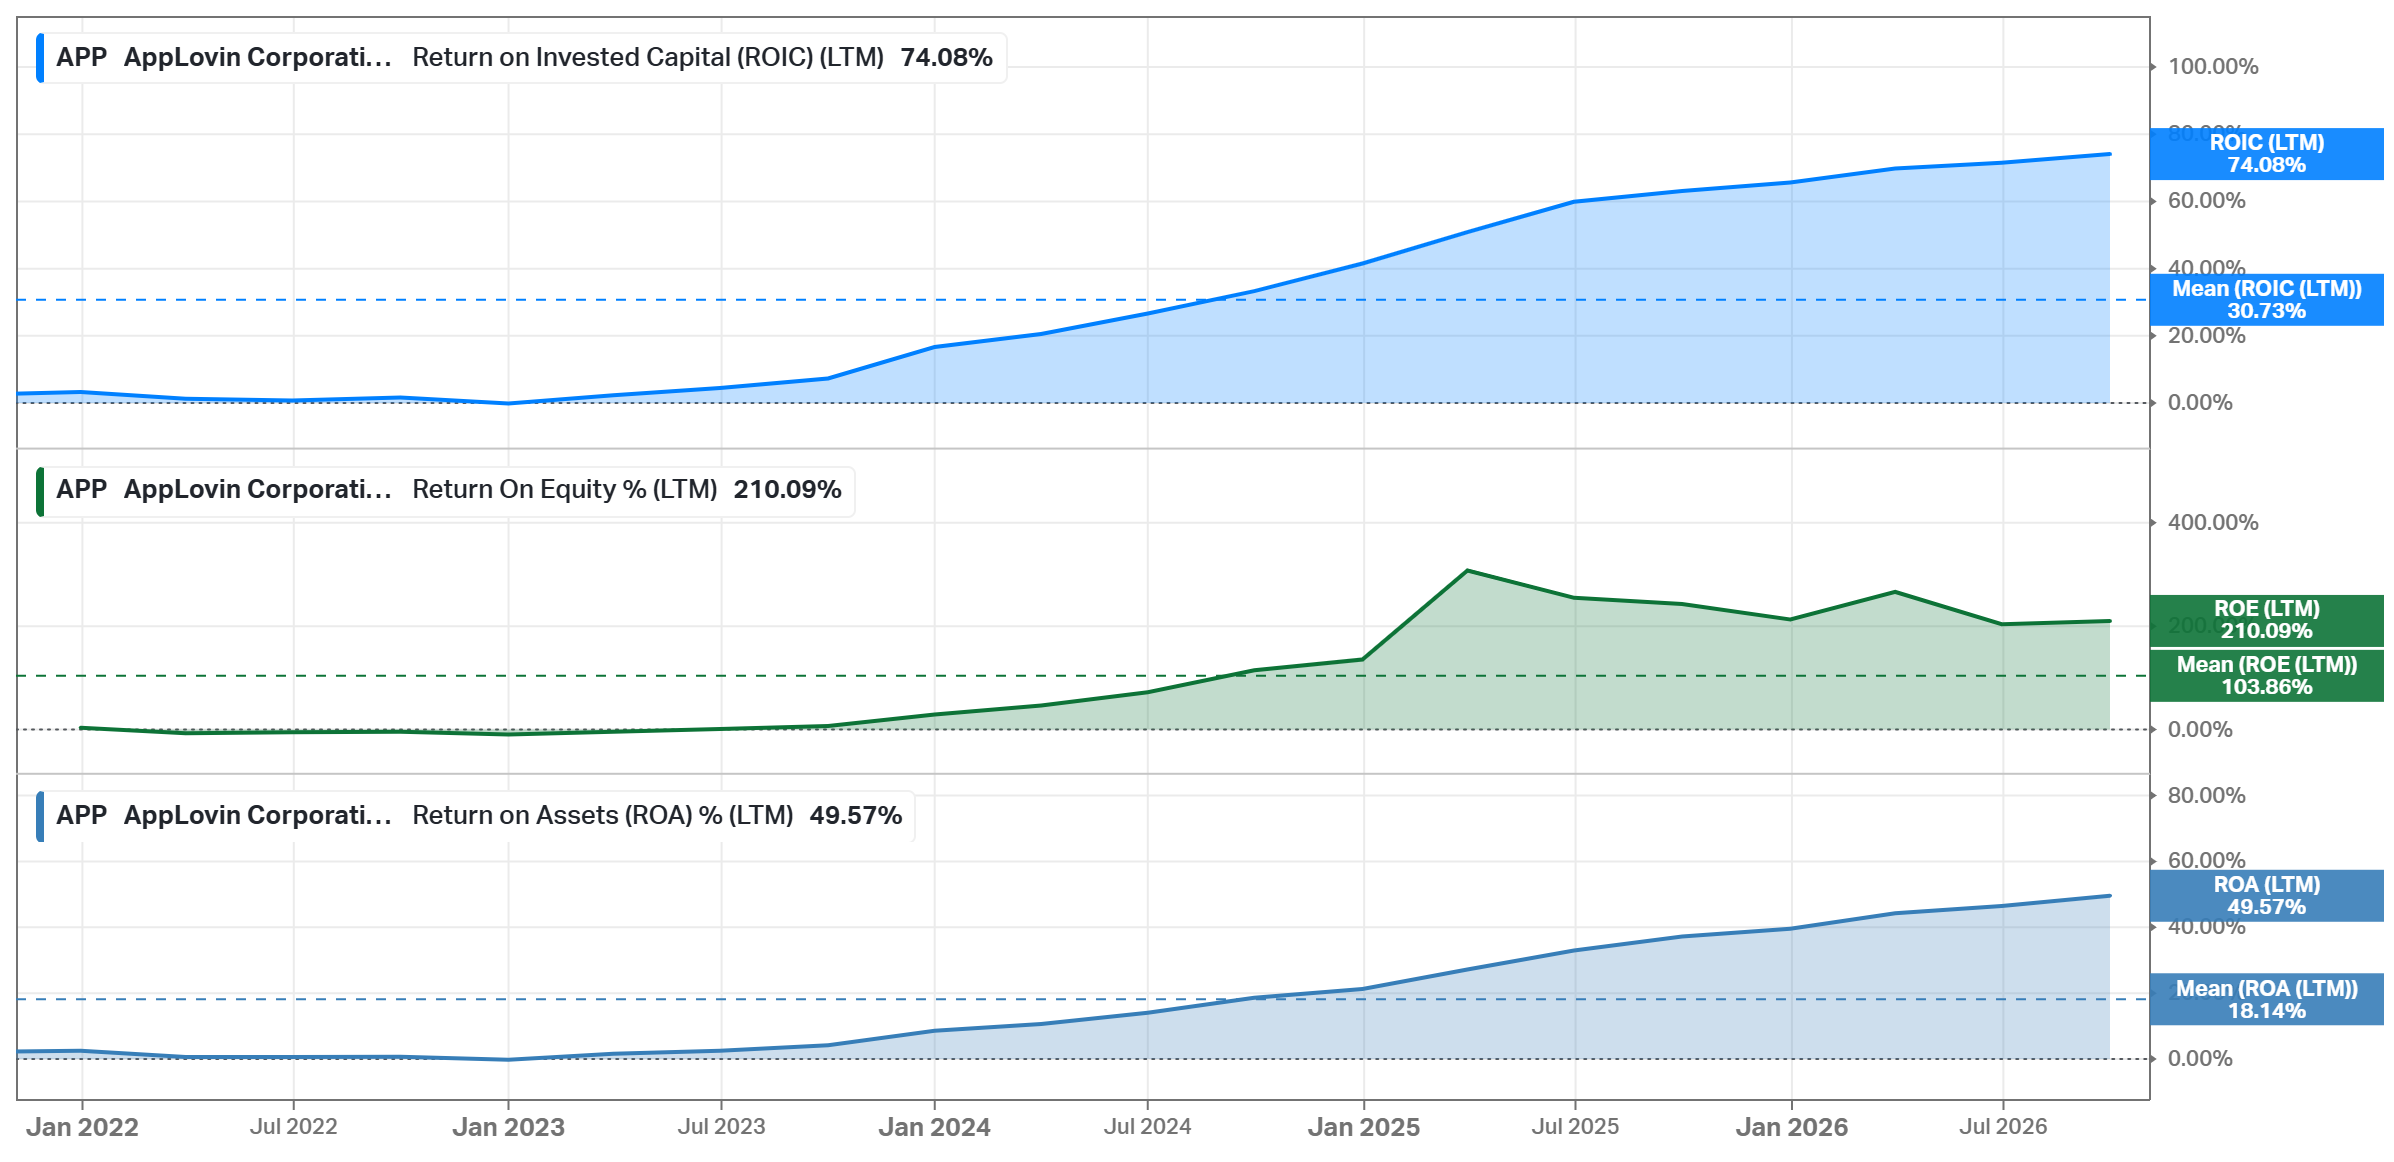
The returns are extreme. ROIC is 74.08% against a 30.73% 5Y mean. ROE is 210.09% (mean: 103.86%), and ROA is 49.57% (mean: 18.14%). Of the three, ROE looks inflated, since buybacks keep equity low ($3.30B against $5.01B of LTM net income). ROIC and ROA do not have this problem; both have increased every quarter since 2023. In my opinion, AppLovin has a narrow moat: the returns prove a real advantage today, but it depends on staying ahead in models and on platforms that Apple and Google own.
Business Strategy
A new model generation, rolled out in parts. In Q3, AppLovin “partially rolled out the next generation of our models”, and the company compares its technical complexity with Axon 2.0, the 2023 upgrade that started the current growth. The new architecture lets AppLovin train bigger models on more compute, and it works better “where data is sparser”, which is where consumer advertisers are. Management does not promise a date: “We cannot tell you or commit to when we can actually see a full rollout”. From my perspective, this is the main source of upside and of risk at once, since the Q2 miss had the same cause in the other direction.
Consumer: from games to every app advertiser. In June, AppLovin opened its self-serve platform, AppLovin Ads Manager, to all advertisers. The plan is “mid-market advertisers first”, then the long tail. It works “really well for the customers that we either handhold or they come in and are sophisticated”, the company said, but a small business with little data is “still further into the future”. Partnerships with agencies and platforms are now the main channel for new customers. Worth noting that e-commerce changes the seasonality: “we should see bigger Q4s followed by tougher Q1s”.
Creative is the bottleneck. An AppLovin ad is watched for over 35 seconds on average, so an online shop needs much more video than on social media. In May, management said the video generation tool was “days away” from rollout; in August, the company said a good 30-60 second video “out of the box” is “still work in progress”. On the Q3 call, he described the answer as “both”: better AI video models and new ad formats such as dynamic product ads. The securities lawsuit filed in September is built largely on this gap between May and August.
CTV, a long option. AppLovin has pilot campaigns on connected TV, and the company sees it as “what mobile looked like to us 10, 15 years ago”. At the same time, he said, “I wouldn’t bank on it at all for being accretive to numbers anytime soon”. I agree, and my model does not include anything for it.
Buying data instead of waiting for it. The new models are “going to be starved for data”, and AppLovin is open to “some sort of data acquisition”: buying customer relationships, as with MoPub. As I see it, the logic is sound, but a large acquisition would also use the cash that now goes to buybacks.
Capital Allocation
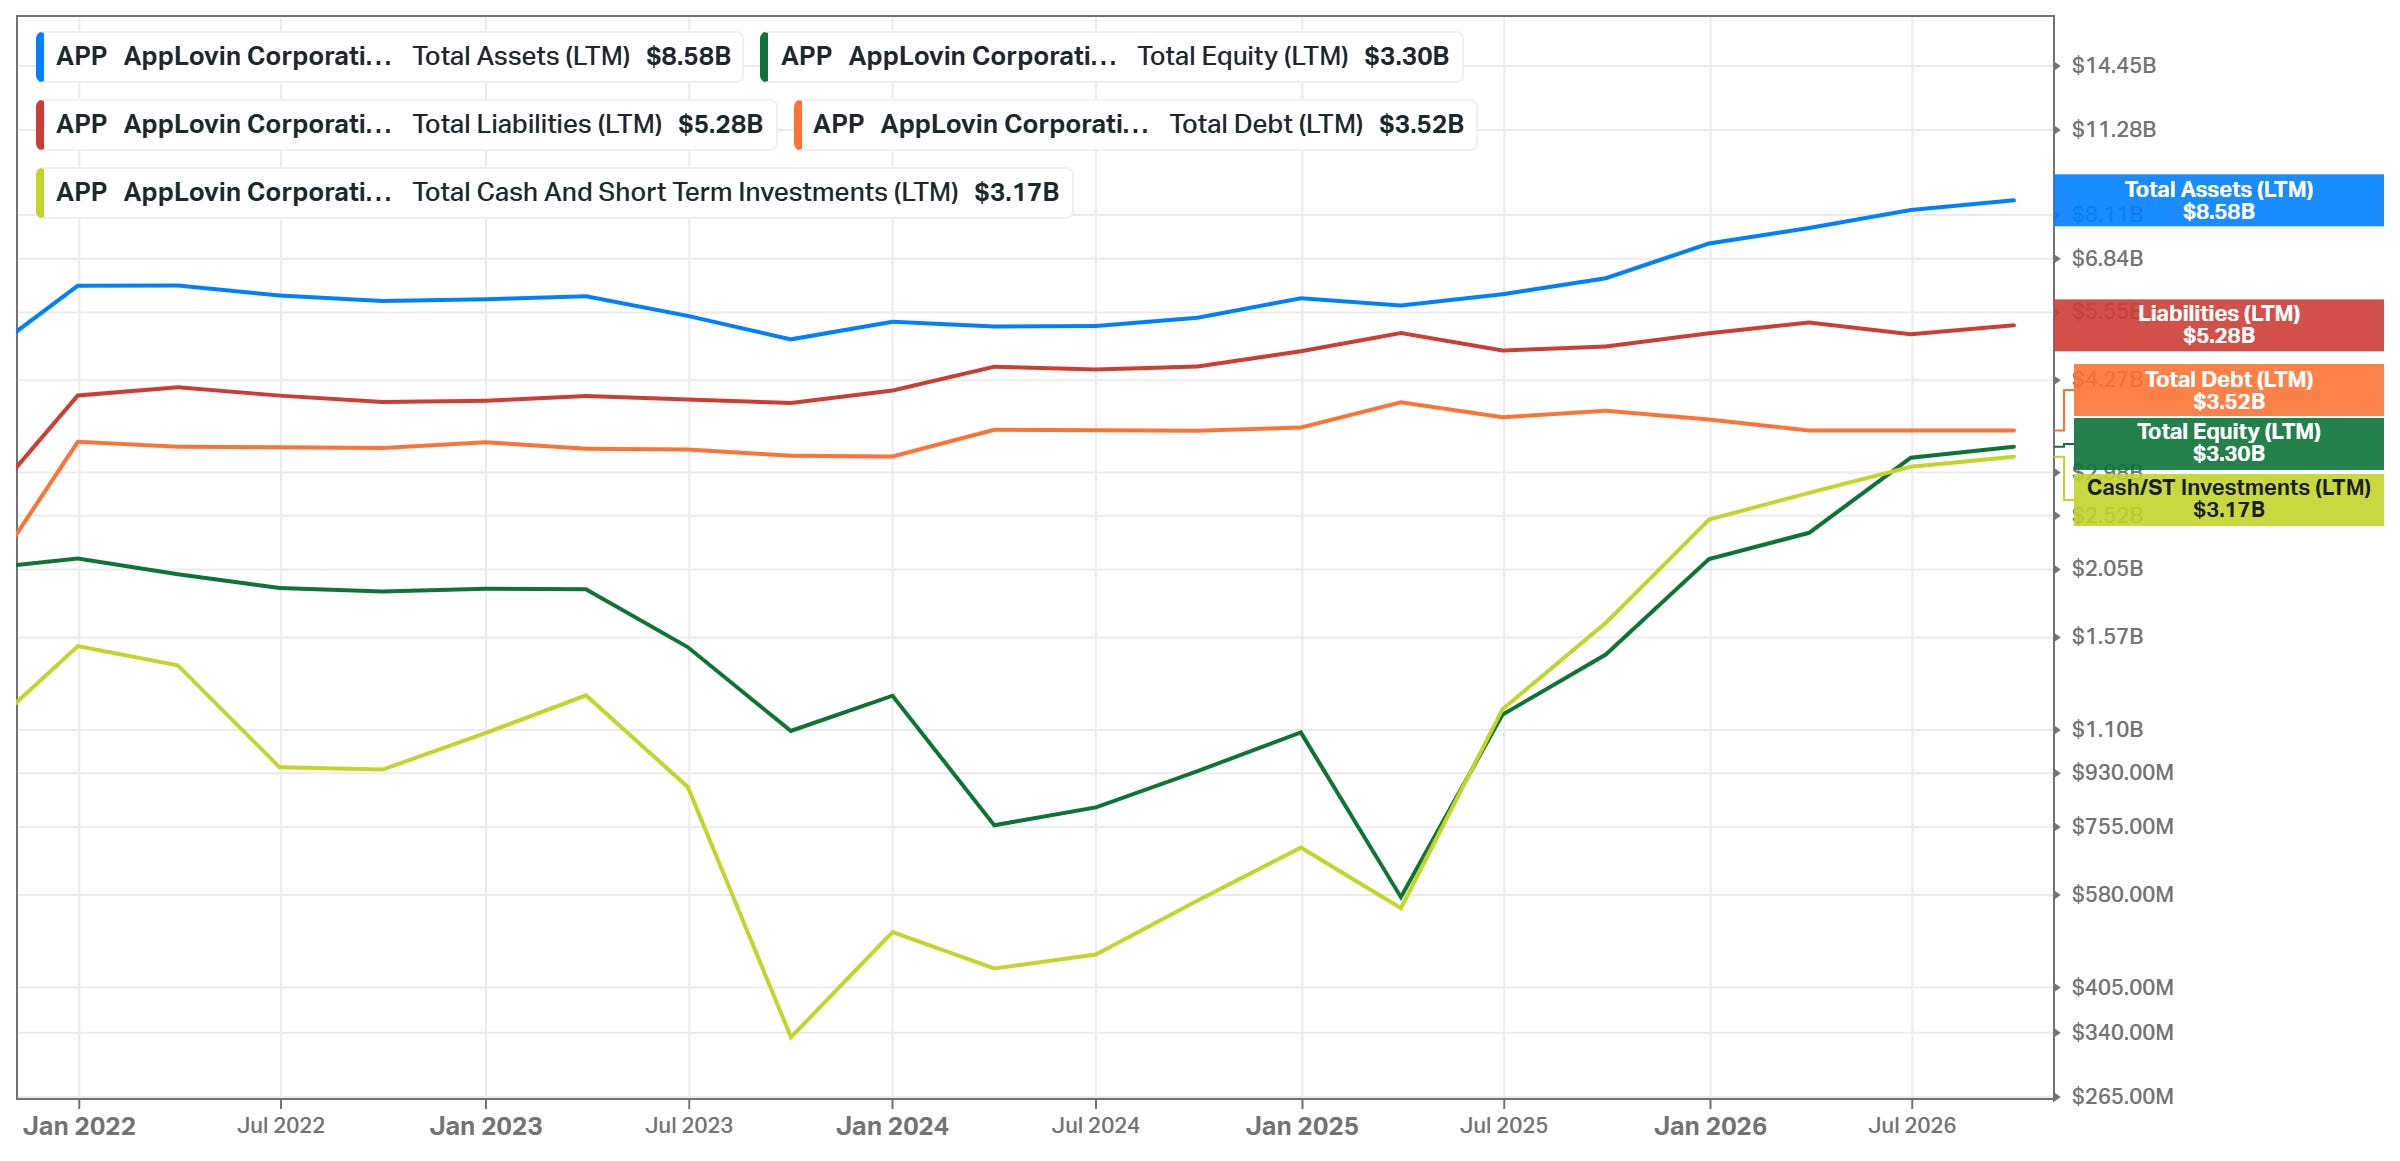
Net debt is almost gone. At the end of Q3, AppLovin had $3.17B of cash and $3.52B of debt, so net debt was $0.34B, ~0.07x of LTM FCF. The debt is four notes with coupons of 5.125-5.950%, and nothing matures before December 2029.
Based on my calculations from the quarterly balance sheets, Debt/Equity is 106.6% vs. a 248.2% 5Y mean; Debt/Capital is 51.6% vs. 68.0%. In 2023-2024, net debt was ~$2.6-2.8B on a much smaller business.
There is room to borrow. Management targets net leverage of ~1x adjusted EBITDA; in that case, AppLovin could borrow ~$6B more for a large deal or buyback, by my estimate.
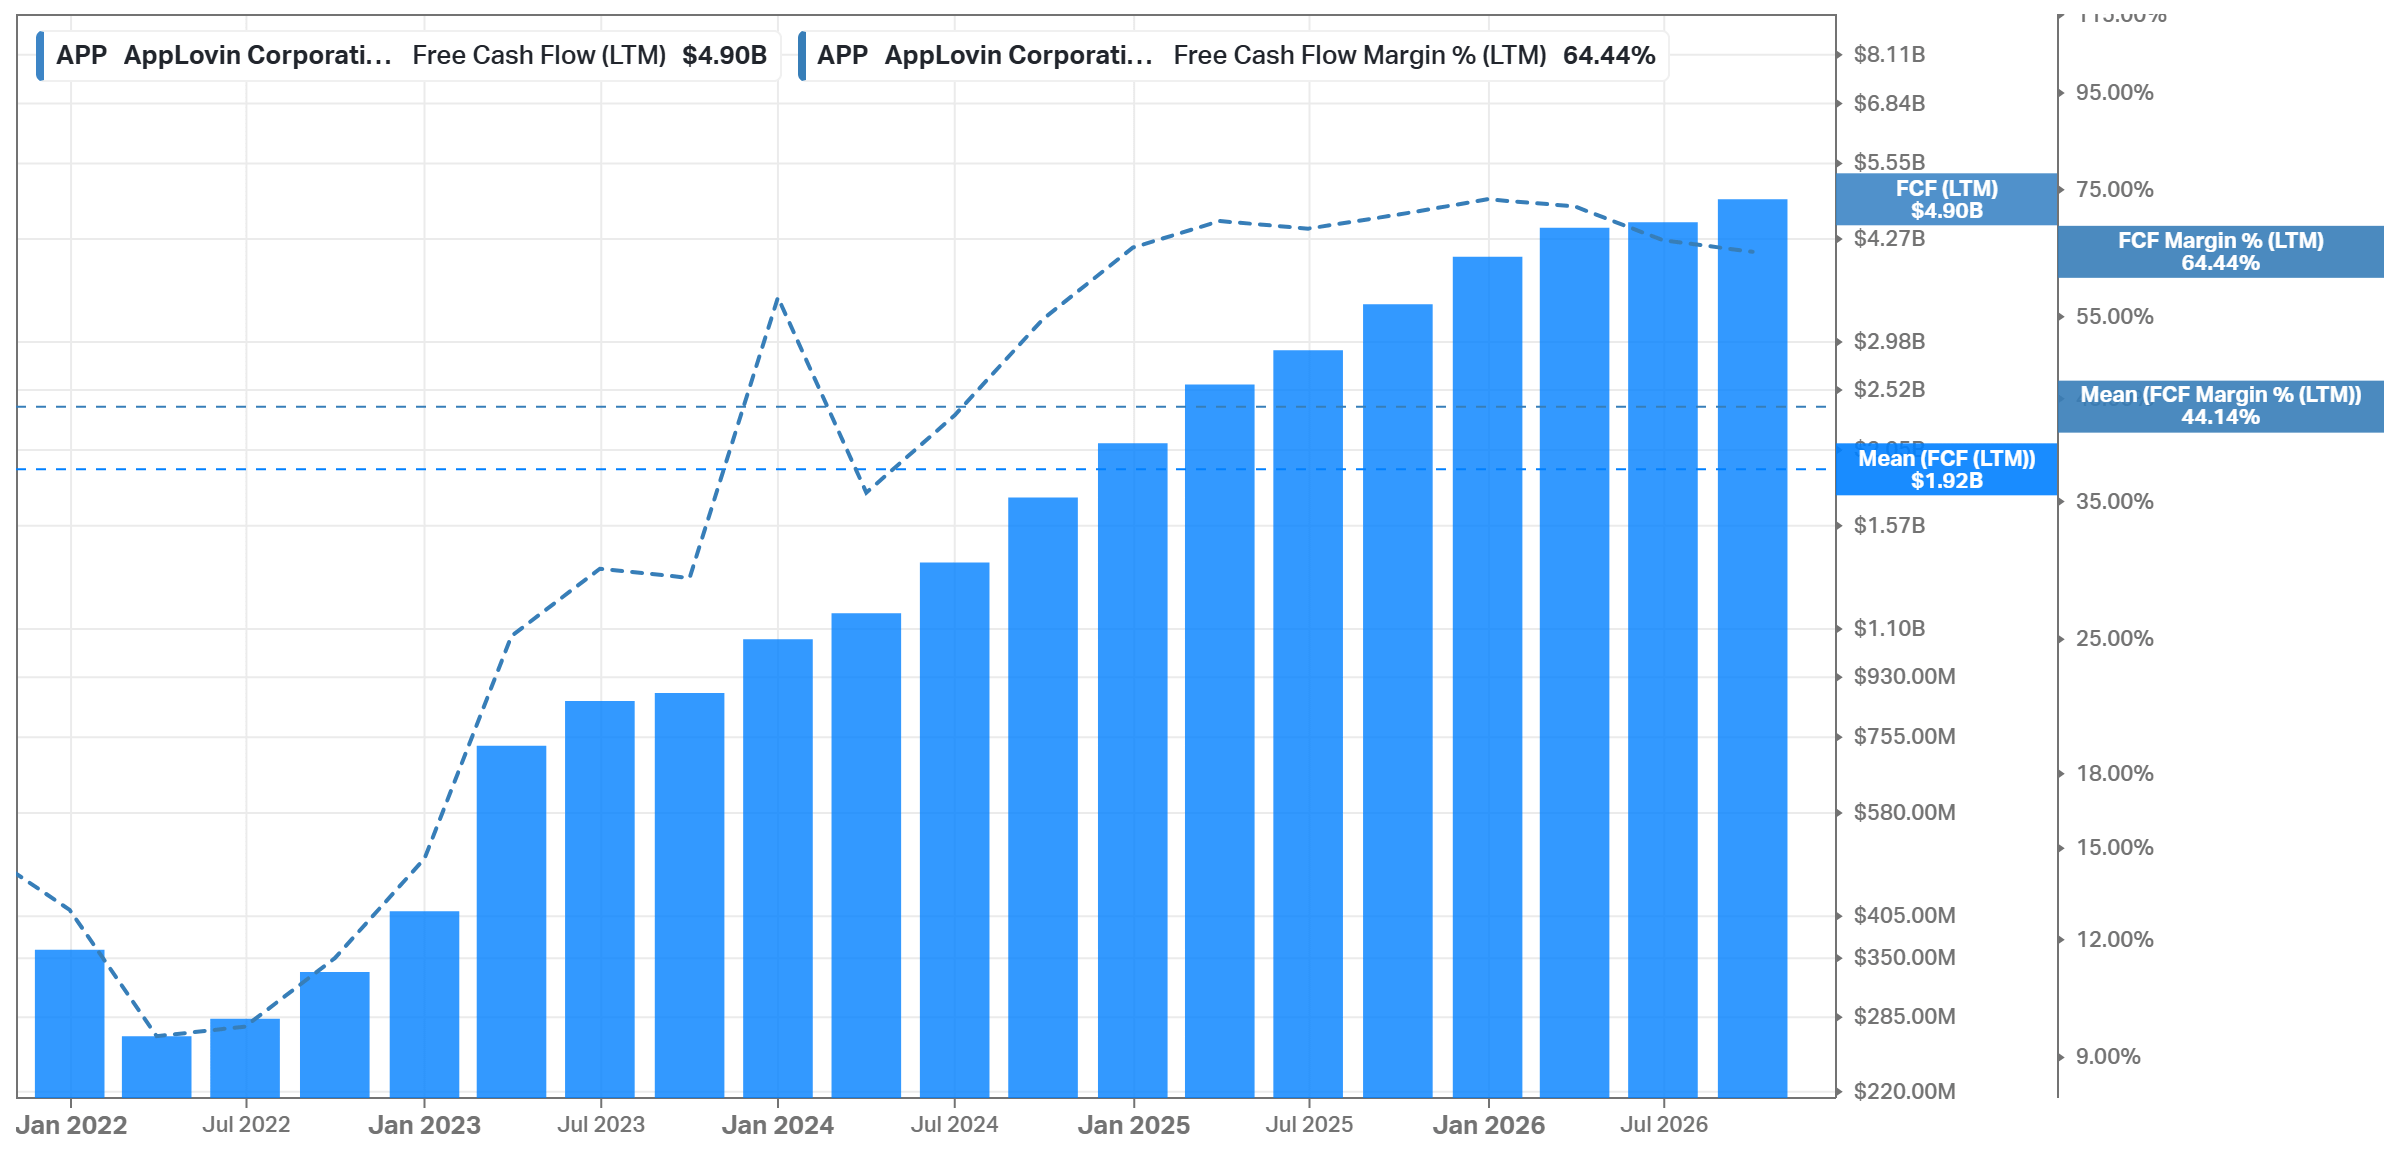
FCF is close to net income, but not above it this year. LTM FCF is $4.90B on Koyfin ($4.88B on AppLovin’s definition, which also subtracts finance lease payments), against a $1.92B 5Y mean. In Q2, FCF was only $863M because of the timing of cash taxes, and Q3 came back to $1.42B, 77% of adjusted EBITDA. Over the first 9 months, operating cash flow was $3.59B, below net income of $3.91B. Receivables increased $571M with the growth, and AppLovin paid $926M in cash taxes against a $770M tax expense. Capex is almost zero, under $10M LTM.
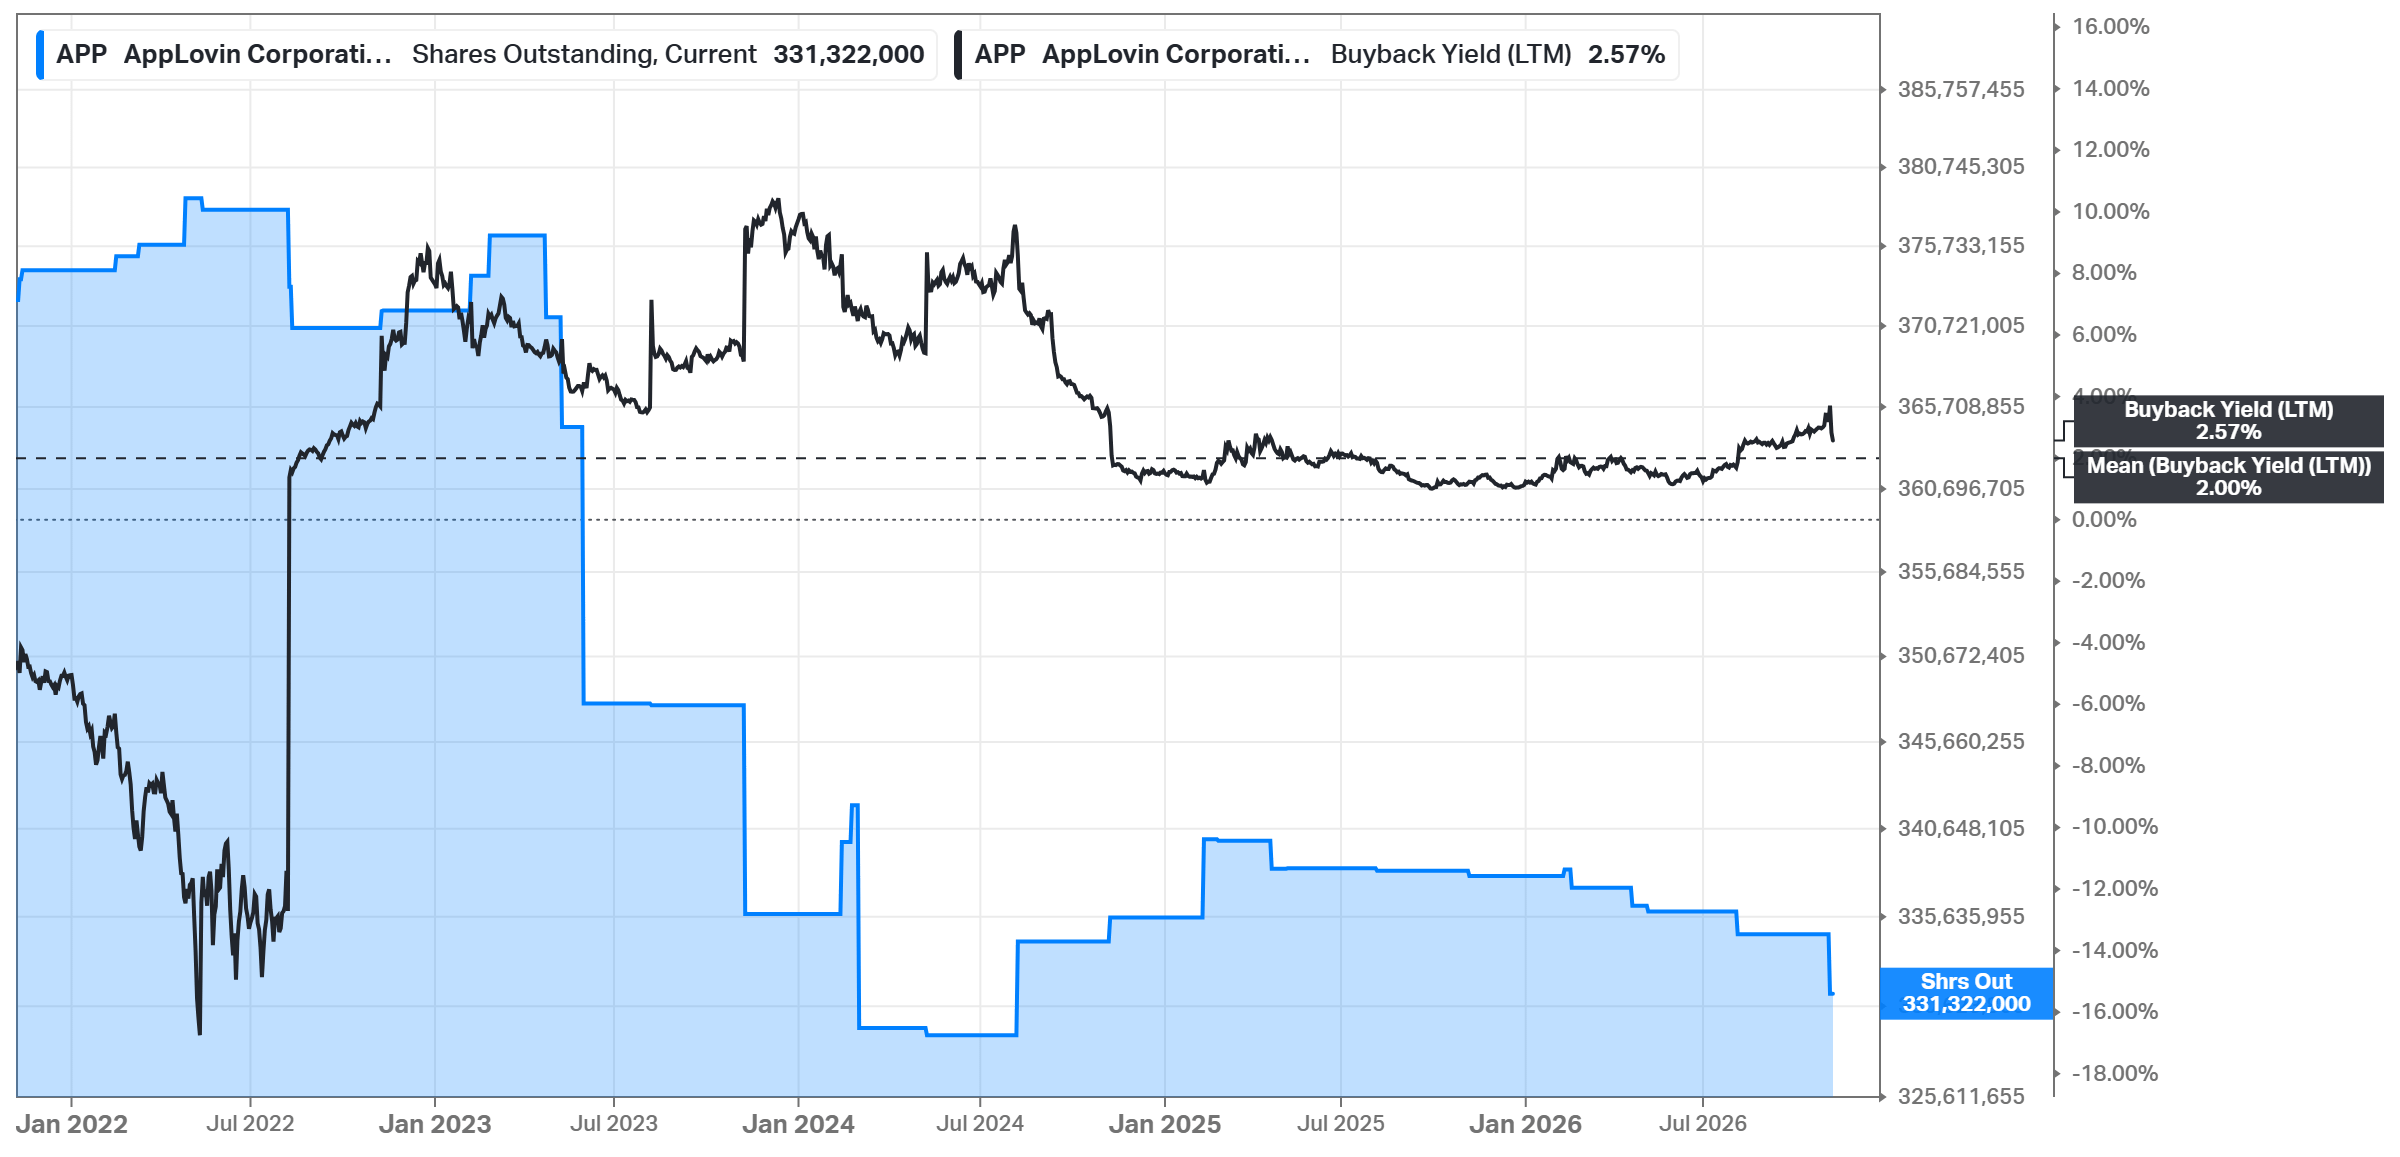
In Q3, the buybacks were well timed. The company bought back 7.3M shares for $2.9B in the first 9 months, ~$396 per share. Q3 alone was 4.1M shares for $1.4B, ~$339 on average, after the stock fell; AppLovin called it “opportunistically ramping up the buyback”. Then, in October, the board added $3.2B, bringing the remaining authorization to $3.6B (2.8% of the market cap).
The longer record is strong too. Since the program started in 2022, AppLovin has bought back 104M shares for $9.4B, ~$90 per share. The share count decreased from 338.5M to 331.3M in a year, and by 11.3% over 5 years; the LTM buyback yield is 2.57% (5Y mean: 2.00%). The company pays no dividend.
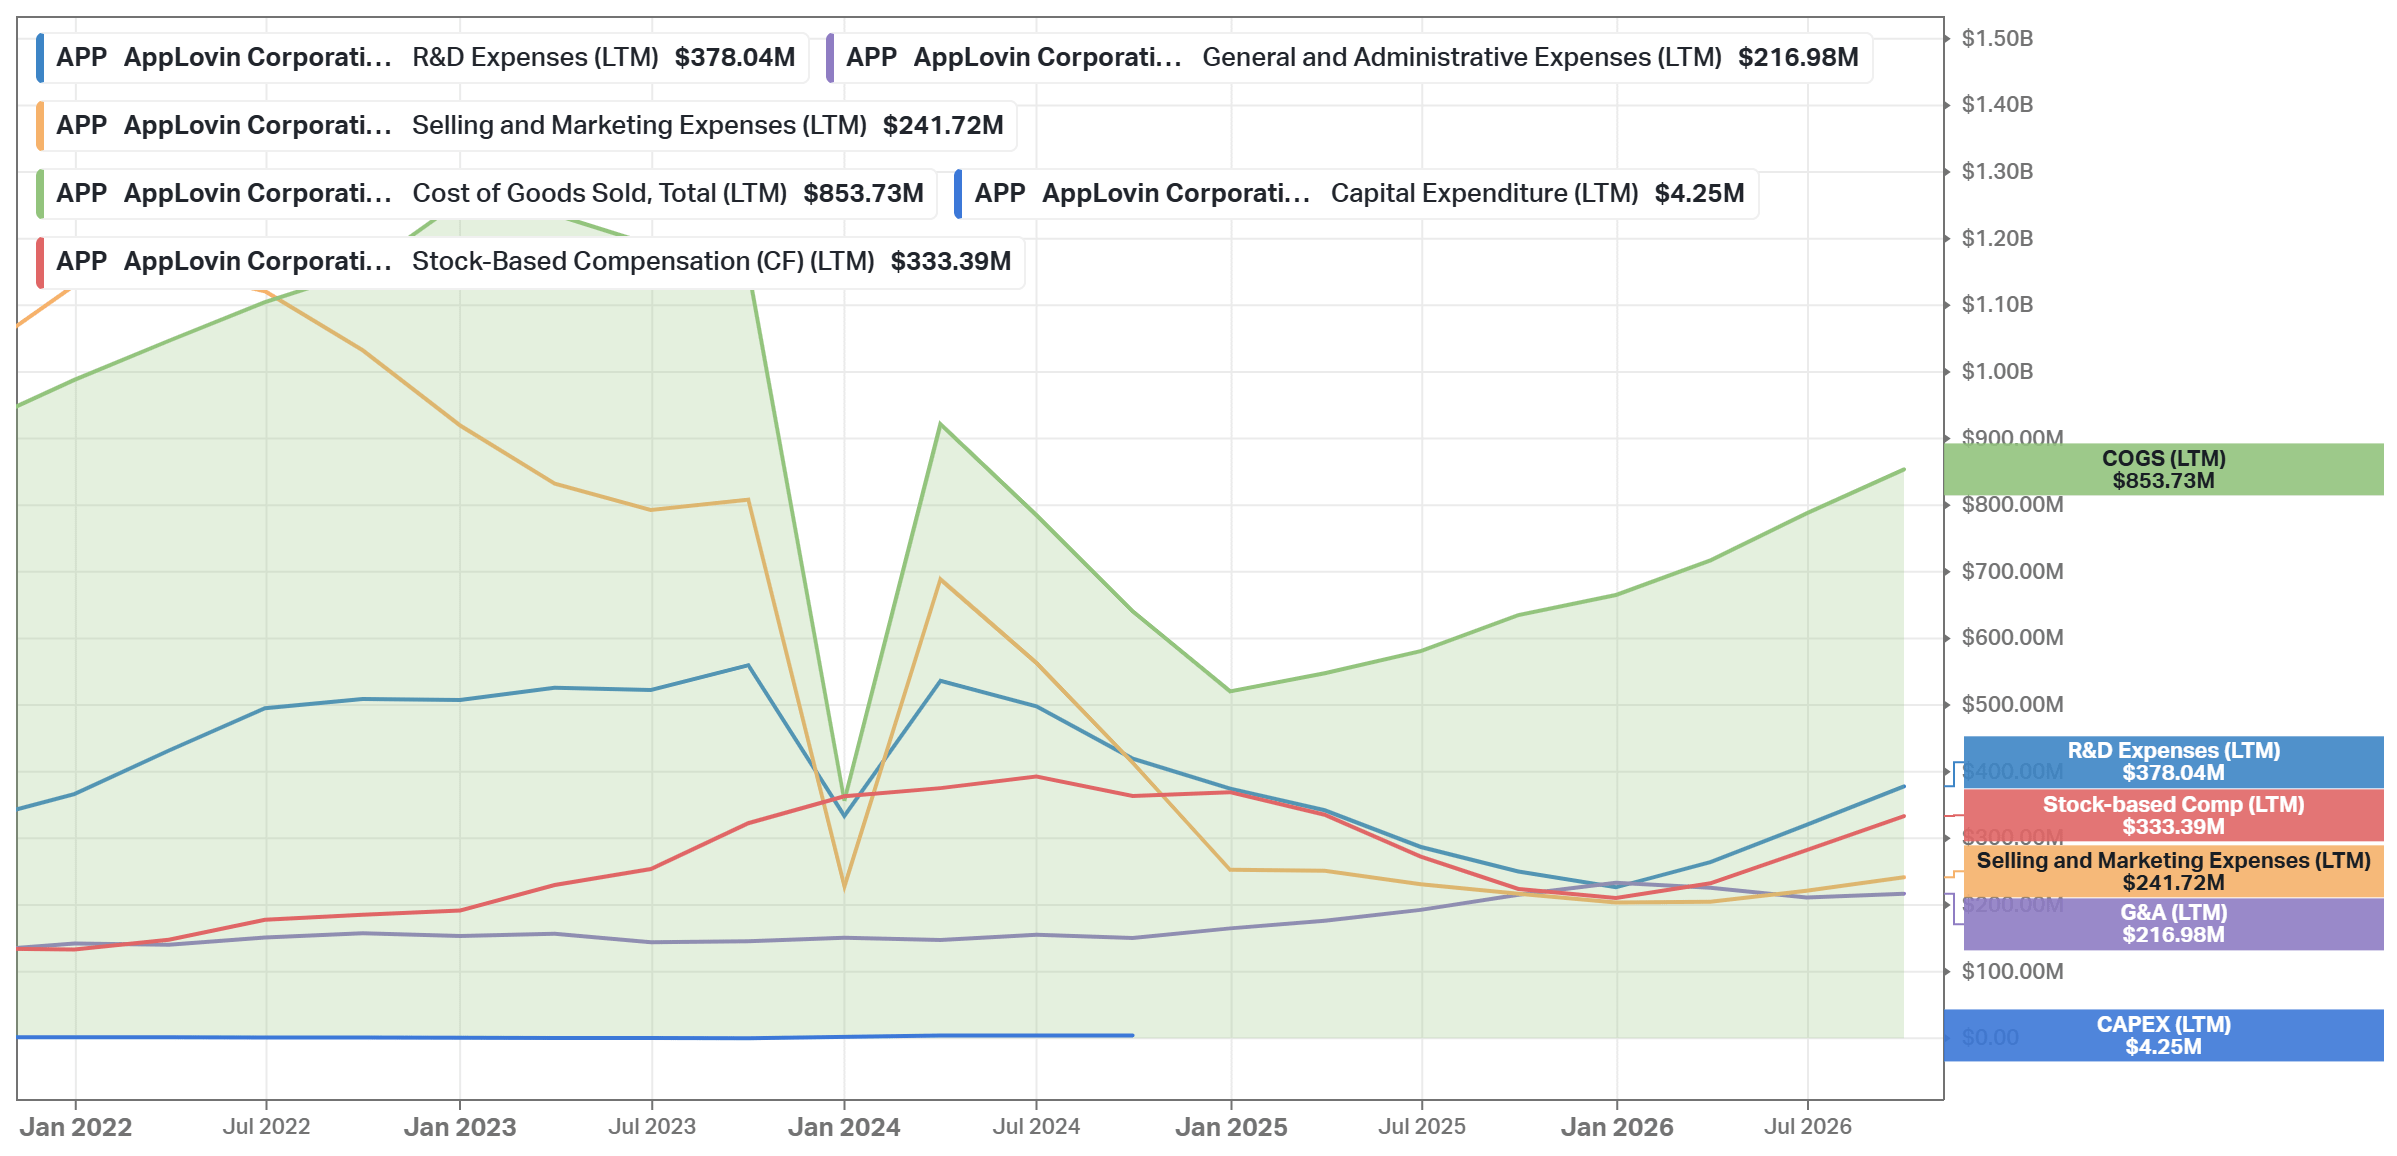
Stock-based compensation is growing again. SBC was $84.2M in Q3, up 2.5x from $33.8M in Q3 2025, and $333M LTM, or 4.4% of revenue. In addition, R&D expense, which includes most of the SBC, increased 132% YoY in Q3. LTM, it was $378M. Buybacks still reduce the share count, so dilution is covered for now.
The timing of the new grants is worth noting. On Oct 29, at a $254.91 close and 4 trading days before the report, the board granted new awards to executives: 128,055 RSUs to Foroughi (Form 4), and 91,467 RSUs plus 182,224 performance units tied to the market cap to Giovanni Ge, the new CTO. A week later, the stock was 53% higher.
Governance is the weak part of capital allocation. Foroughi has 61.6% of the votes with 9.0% of the shares, and all directors and officers together have 64.0% of the votes, according to the 2026 proxy. On Oct 29, Foroughi, Herald Chen (a director), and related holders approved the move from Delaware to Nevada by written consent, so the other shareholders have no real vote; AppLovin has not stated a reason. In 2026, insiders sold $372.5M of stock on the open market, all between March and July at $447-600, and nobody bought below $300, according to their Form 4 filings. As I see it, this doesn’t change the business, but it is one reason the market pays less for it.
In my opinion, management allocates the cash well, and the guidance is credible. AppLovin beat revenue consensus in 13 of the last 14 quarters, and the Q3 buybacks were made at ~$339, 13% below today’s price. The H1 buybacks were less well timed: ~$1.5B at ~$466 per share, while insiders sold at $447-600 between March and July. Still, the governance record is weaker than its capital-return record.

Advantages
The leader in mobile game ads. 53% of game ad revenue on iOS and 29% on Android in Tenjin’s Q3 benchmark; MAX in most of the top ad-supported games.
Economics that few companies have. An EBIT margin of 77.78%, an FCF margin of 64.44%, ROIC of 74.08%, and almost no capex.
A second growth market. Consumer spend grows triple digits YoY, and the ad market outside games is many times larger than the game ad market.
Strong cash returns. $3.23B of buybacks LTM and 11.3% fewer shares in 5 years, while net debt is only $0.34B.
A record of beating its own guidance. Revenue above the consensus in 13 of the last 14 quarters, and Q3 ~$100M above the top of the guidance.
Disadvantages
Growth depends on model releases that nobody can schedule. Q2 2026 missed the revenue consensus because model improvement was “lighter than normal”, and management “cannot... commit to when” the new generation is fully rolled out.
The consumer business is unproven and undisclosed. No revenue split, Haus’s win rate down from 63-85% in 2025 to 50% in Q2 2026, and tougher Q1s ahead as e-commerce grows.
Competition and the platforms. Unity’s Vector grew 126% YoY in Q3; Meta may start bidding on iPhone traffic without an ID; Apple and Google control the data AppLovin depends on.
Lawsuits and governance. Two securities class actions (2025 and September 2026), derivative suits (shareholders suing the directors on the company’s behalf), a San Diego County suit over ads in children’s games, a Dutch privacy class action, as well as a founder with 61.6% of the votes and $372.5M of insider sales in 2026.
Lower-quality earnings. SBC 2.5x YoY in Q3, ~$0.12 of Q3 EPS from an unrealized gain on private equity funds, and operating cash flow below net income in the first 9 months.
What the bears get right: Gaming is close to its ceiling. AppLovin already works with almost every mobile game company, game downloads are declining, and Wells Fargo argued in August that AppLovin has ~50% of the money mobile games spend on user acquisition and is near a “plateau” in wallet share. So the 30% long-term growth that management targets needs consumer to become a large business, and the independent data on consumer weakened in 2026.
The history adds to the doubt. In 10 months, the stock fell 69% on a short-seller attack, an SEC inquiry that, according to AppLovin, ended with no action, one weak quarter, and doubts about e-commerce. The market already paid 12x for this business on Oct 30, and it can do so again. If EPS grows only 15% per year and APP trades at 12x in 2031, the fair price is ~$238, 39% below today’s price; with 20% growth and 12x, it is my Bear Case, $294.
One risk is outside the multiple. San Diego County claims that AppLovin used fingerprinting (identifying a device by its technical traits, without an ad ID) to collect children’s data, and short sellers made similar claims in 2025, which AppLovin called false. If Apple found this true and acted against AppLovin, the iOS economics would change, and no exit multiple in my model covers that.
Competitors
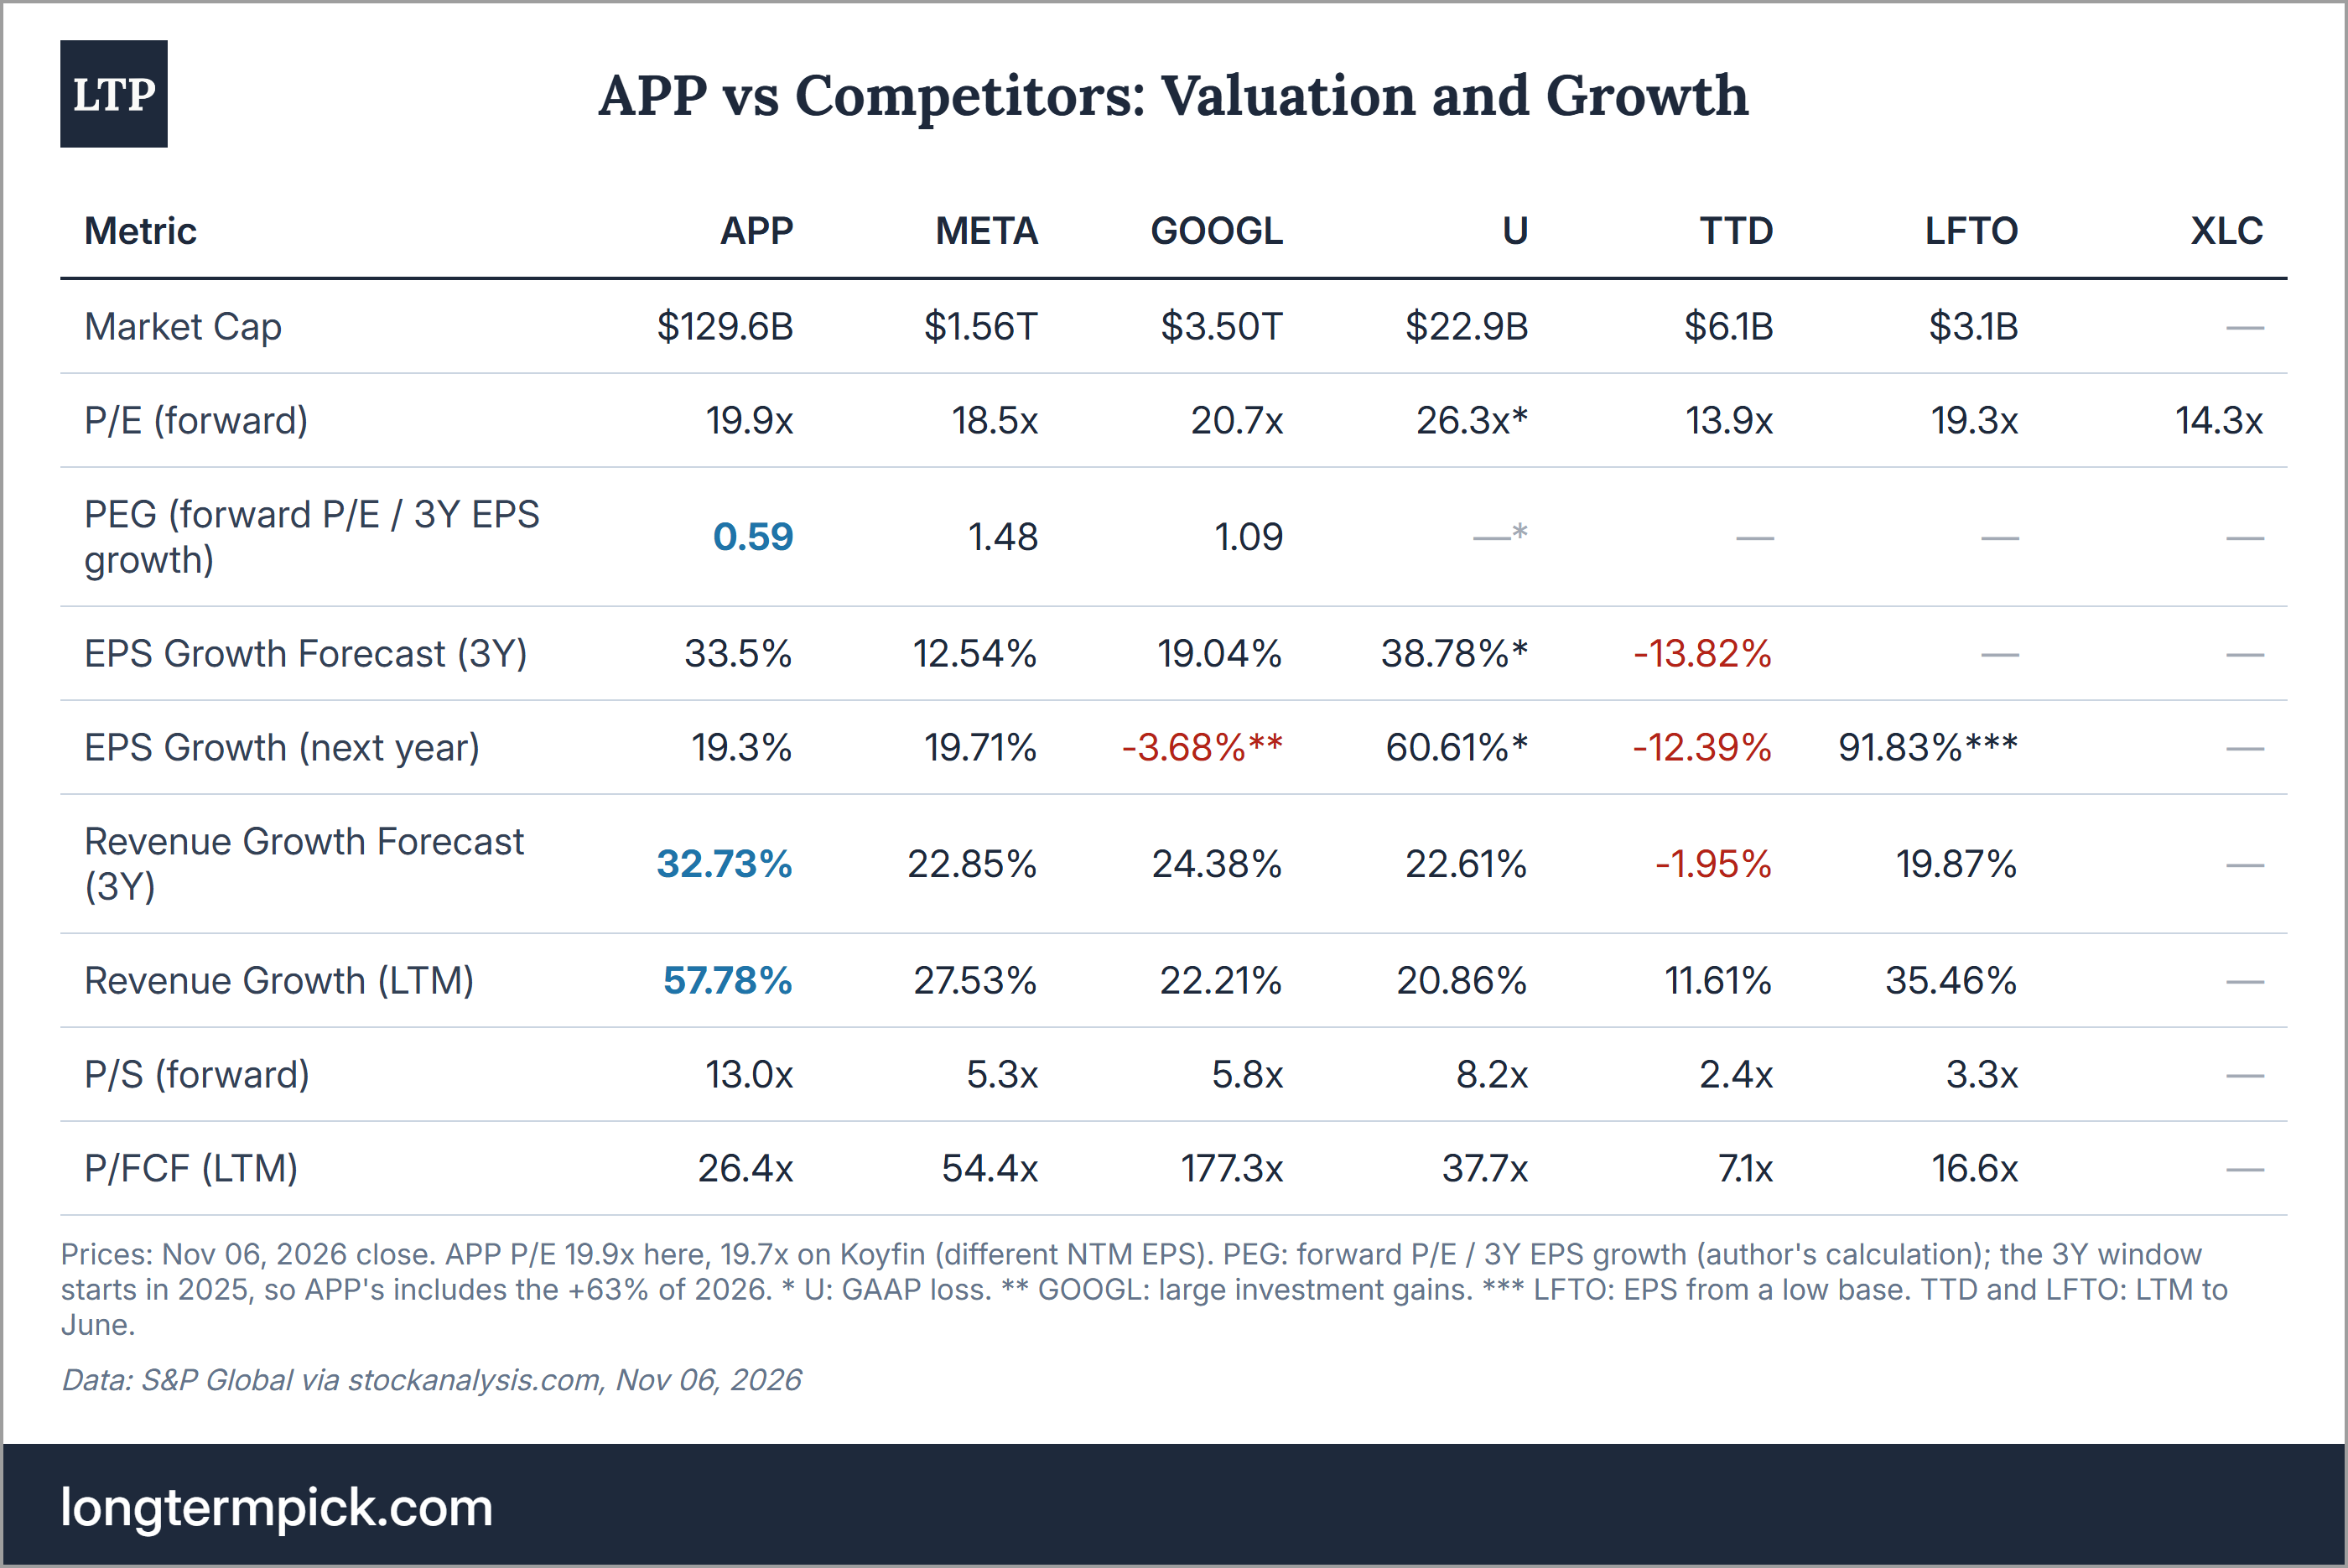
I compare AppLovin with 5 companies. Unity (U) is the closest competitor: an ad network (Vector) and a mediation platform (LevelPlay) for mobile games. Liftoff (LFTO) is also a mobile ad network. Meta (META) and Alphabet (GOOGL) are the largest performance advertising platforms, and Google’s AdMob competes directly in game ads. The Trade Desk (TTD) is the largest independent ad platform outside mobile apps. XLC, the Communication Services ETF (APP is 5.8% of it), is the benchmark.
On forward P/E, APP is in the upper half of the table: META, LFTO, TTD, and XLC are cheaper. S&P Global data puts APP at 19.9x forward earnings (19.7x on Koyfin), against 18.5x for META, 20.7x for GOOGL, and 14.3x for XLC. TTD is cheaper at 13.9x, but its EPS is expected to decline 12% next year. Unity trades at 26.3x on adjusted EPS from a low base and an LTM GAAP loss, though in Q3 it earned $101M of GAAP operating income, up from a $126M loss a year ago.
The 3Y forecast gives APP PEG of 0.59 versus 1.48 for META, but this comparison flatters APP: the 3Y window starts in 2025, so it includes the +63% EPS growth in 2026, which is mostly already reported. For next year’s growth, APP and META are almost the same: +19.3% against +19.7%, so PEG is 1.03 against 0.94.
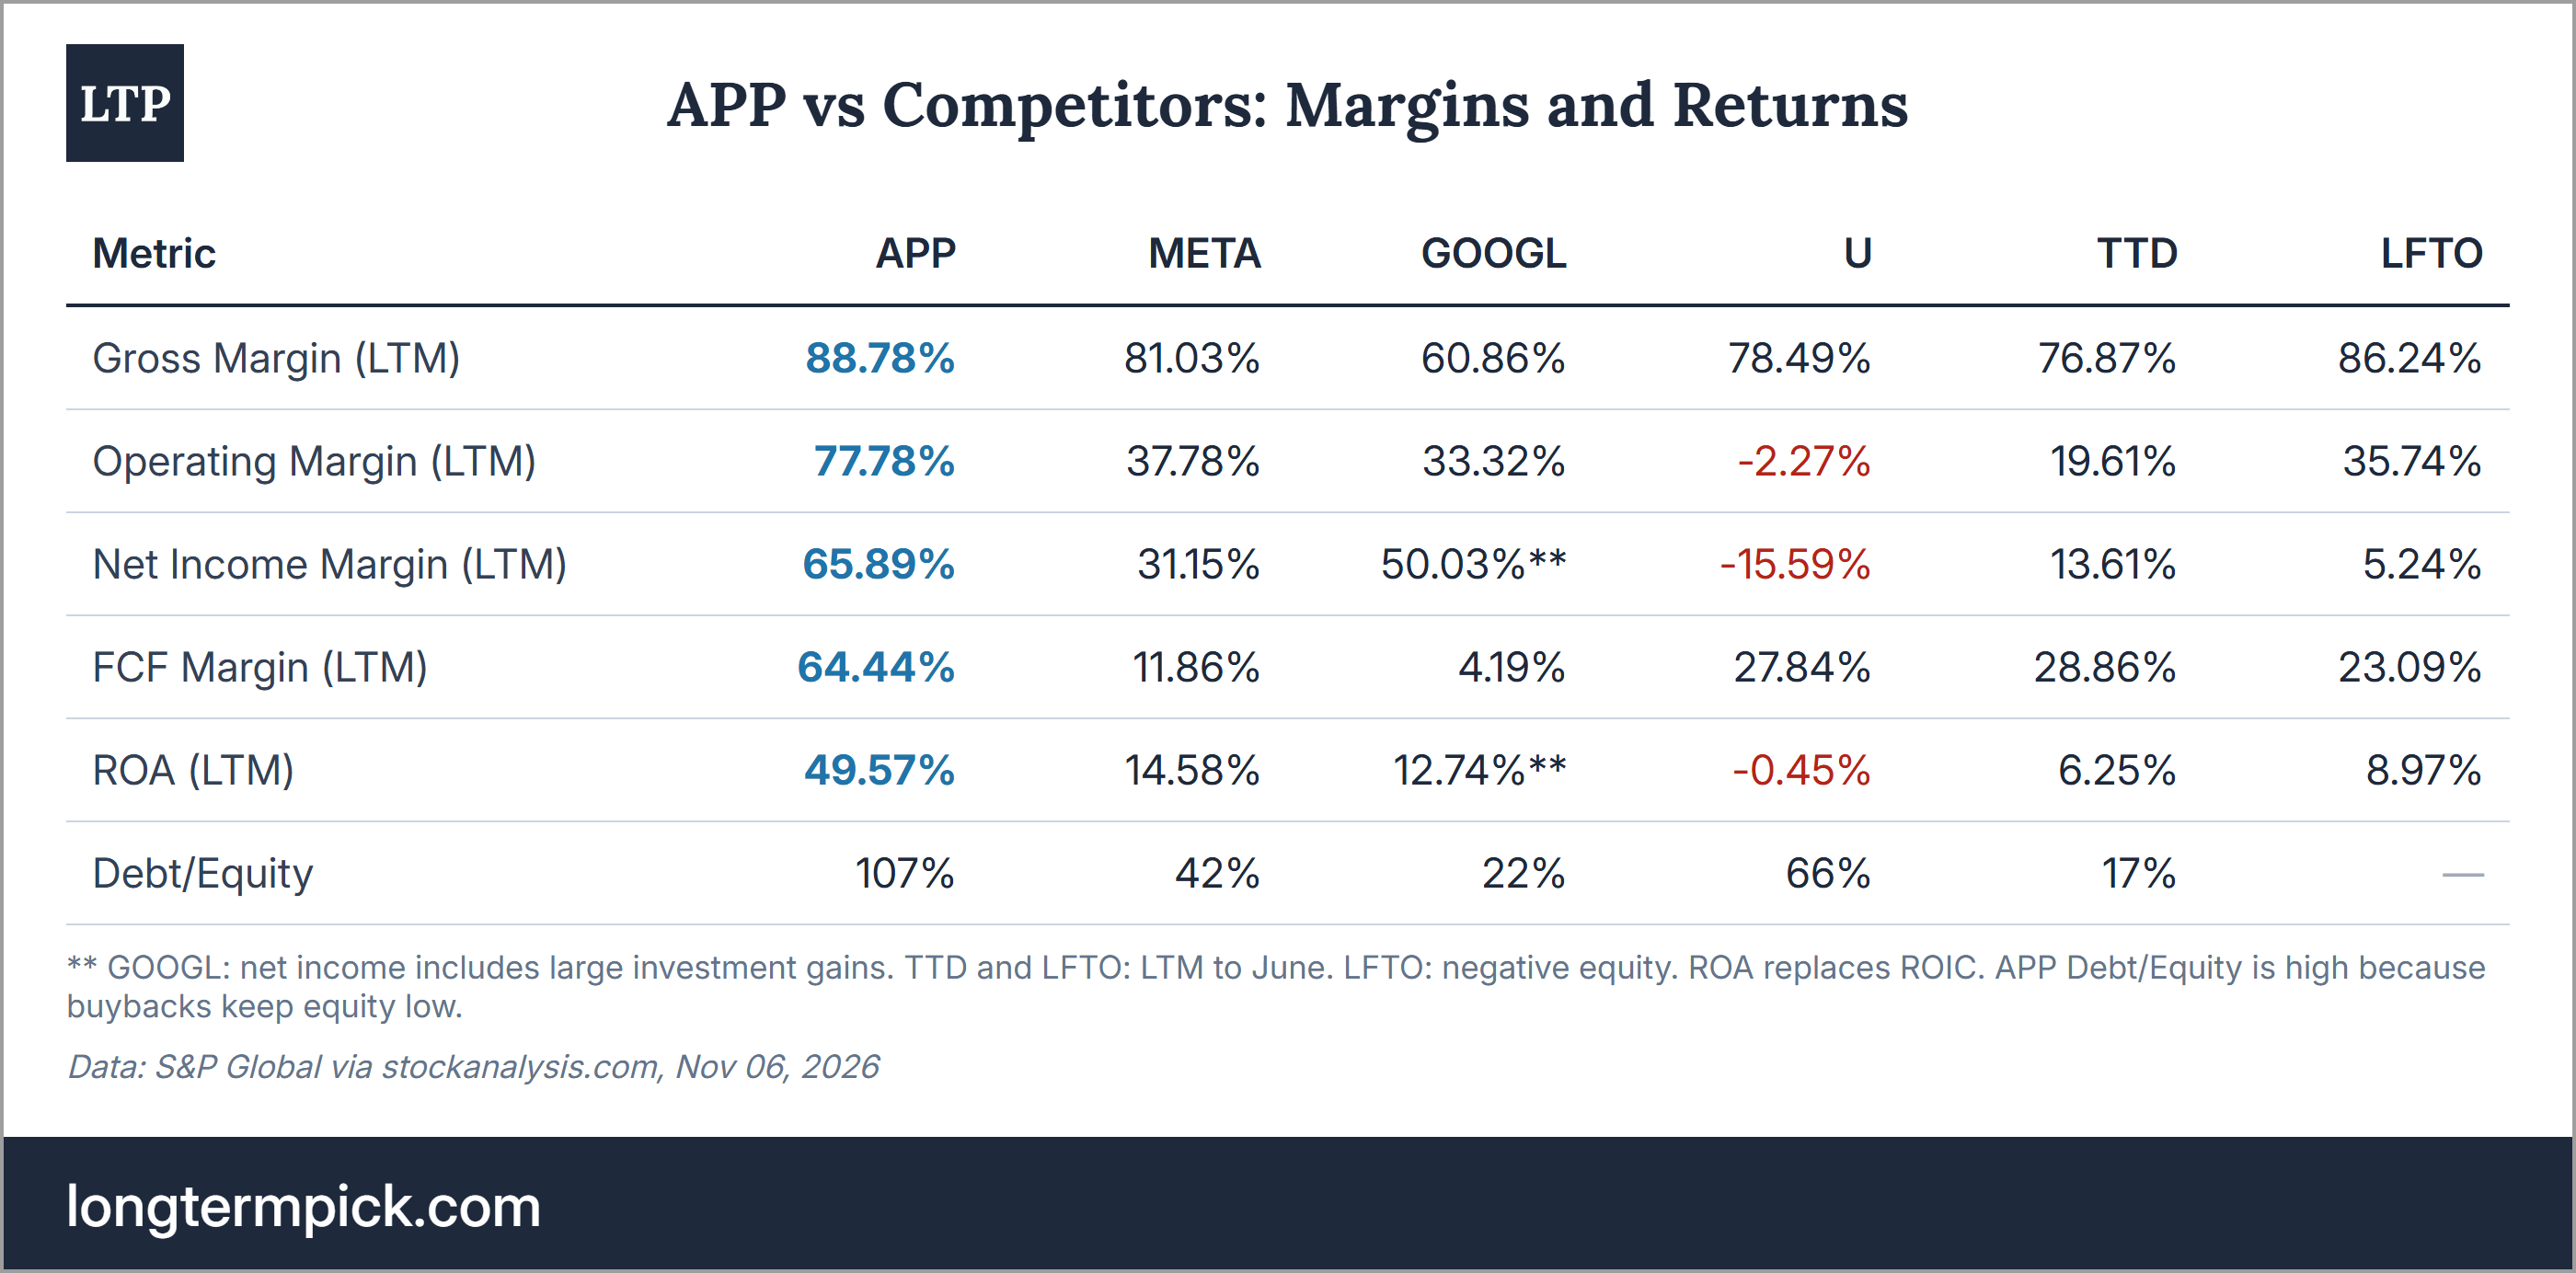
On margins and cash, AppLovin is far ahead of everyone. Its LTM operating margin is 77.78%, against 37.78% for Meta, 33.32% for Alphabet, and 35.74% for Liftoff. The FCF margin is 64.44%, against 11.86% for Meta and 4.19% for Alphabet, since both spend heavily on AI data centers.
As a result, APP is at 26.4x FCF in the first table, against 54.4x for META and 177x for GOOGL. ROA is 49.57%, more than 3x Meta’s. AppLovin’s Debt/Equity of 107% looks high only because buybacks keep its equity low; net debt is $0.3B.
The latest quarter is strong across the sector, and AppLovin still grew fastest at its size. Meta’s ad revenue grew 26%, Alphabet’s revenue 25% (Google Network, where AdMob reports, only ~1%), and Unity’s 32%. Liftoff grew 35% in Q2. The Trade Desk guides for a ~12% decline in Q3. Stumpf put it this way: the largest platforms grew “between roughly 10% and the mid-20%s”, and AppLovin 55%.
LFTO is cheaper on every multiple, but it has debt and slower growth ahead. It is at 19.3x forward earnings, but it has $1.1B of net debt and negative equity, and its growth is expected to slow to ~16% in 2027.
In my view, Meta is the next-best alternative. It has almost the same forward multiple and the same expected EPS growth next year, a much more diversified business, and its own first-party data, with less exposure to ad-network auctions. AppLovin’s advantages are its margins and FCF (26x FCF vs. 54x), and faster revenue growth (2027 consensus: +25% vs. +22% for Meta). As I see it, an investor in APP is paid for the higher risk with more FCF per dollar of the price, not with a lower P/E.
Worth noting that Meta’s EPS is flat in 2026 ($29.73 against $29.68), so part of its +19.7% in 2027 is a rebound. At $391, I see no clear reason to prefer APP over META on price; at the top of my accumulation zone ($294), APP would trade at ~15x NTM EPS (the consensus for the next 12 months), ~20% below META.
Analyst’s note:
I wrote this analysis before The Trade Desk reported Q3 on Nov 09, so the TTD numbers here (the comparison table and its Q3 guidance) are from before that report. The TTD report itself gets its own short note with a one-pager.
Past
Q3 2026 (ended Sep 30, all USD, YoY):
Revenue +55% to $2.18B, against the $2.08B Zacks consensus; the top of the guidance was $2.085B
Diluted EPS +76% to $4.30, against the $3.94 Zacks consensus; ~$0.12 of it came from an unrealized gain on private equity funds, a third of the $0.36 beat
Net income +72% to $1.44B; adjusted EBITDA +59% to $1.84B, an 84% margin
FCF $1.42B; buybacks $1.4B (4.1M shares)
Revenue in the US +60% to $1.10B, outside the US +52% to $1.09B
Q4 guidance: revenue $2.365-2.395B (+43-44%), against ~$2.25B of pre-report consensus; adjusted EBITDA $1.995-2.025B
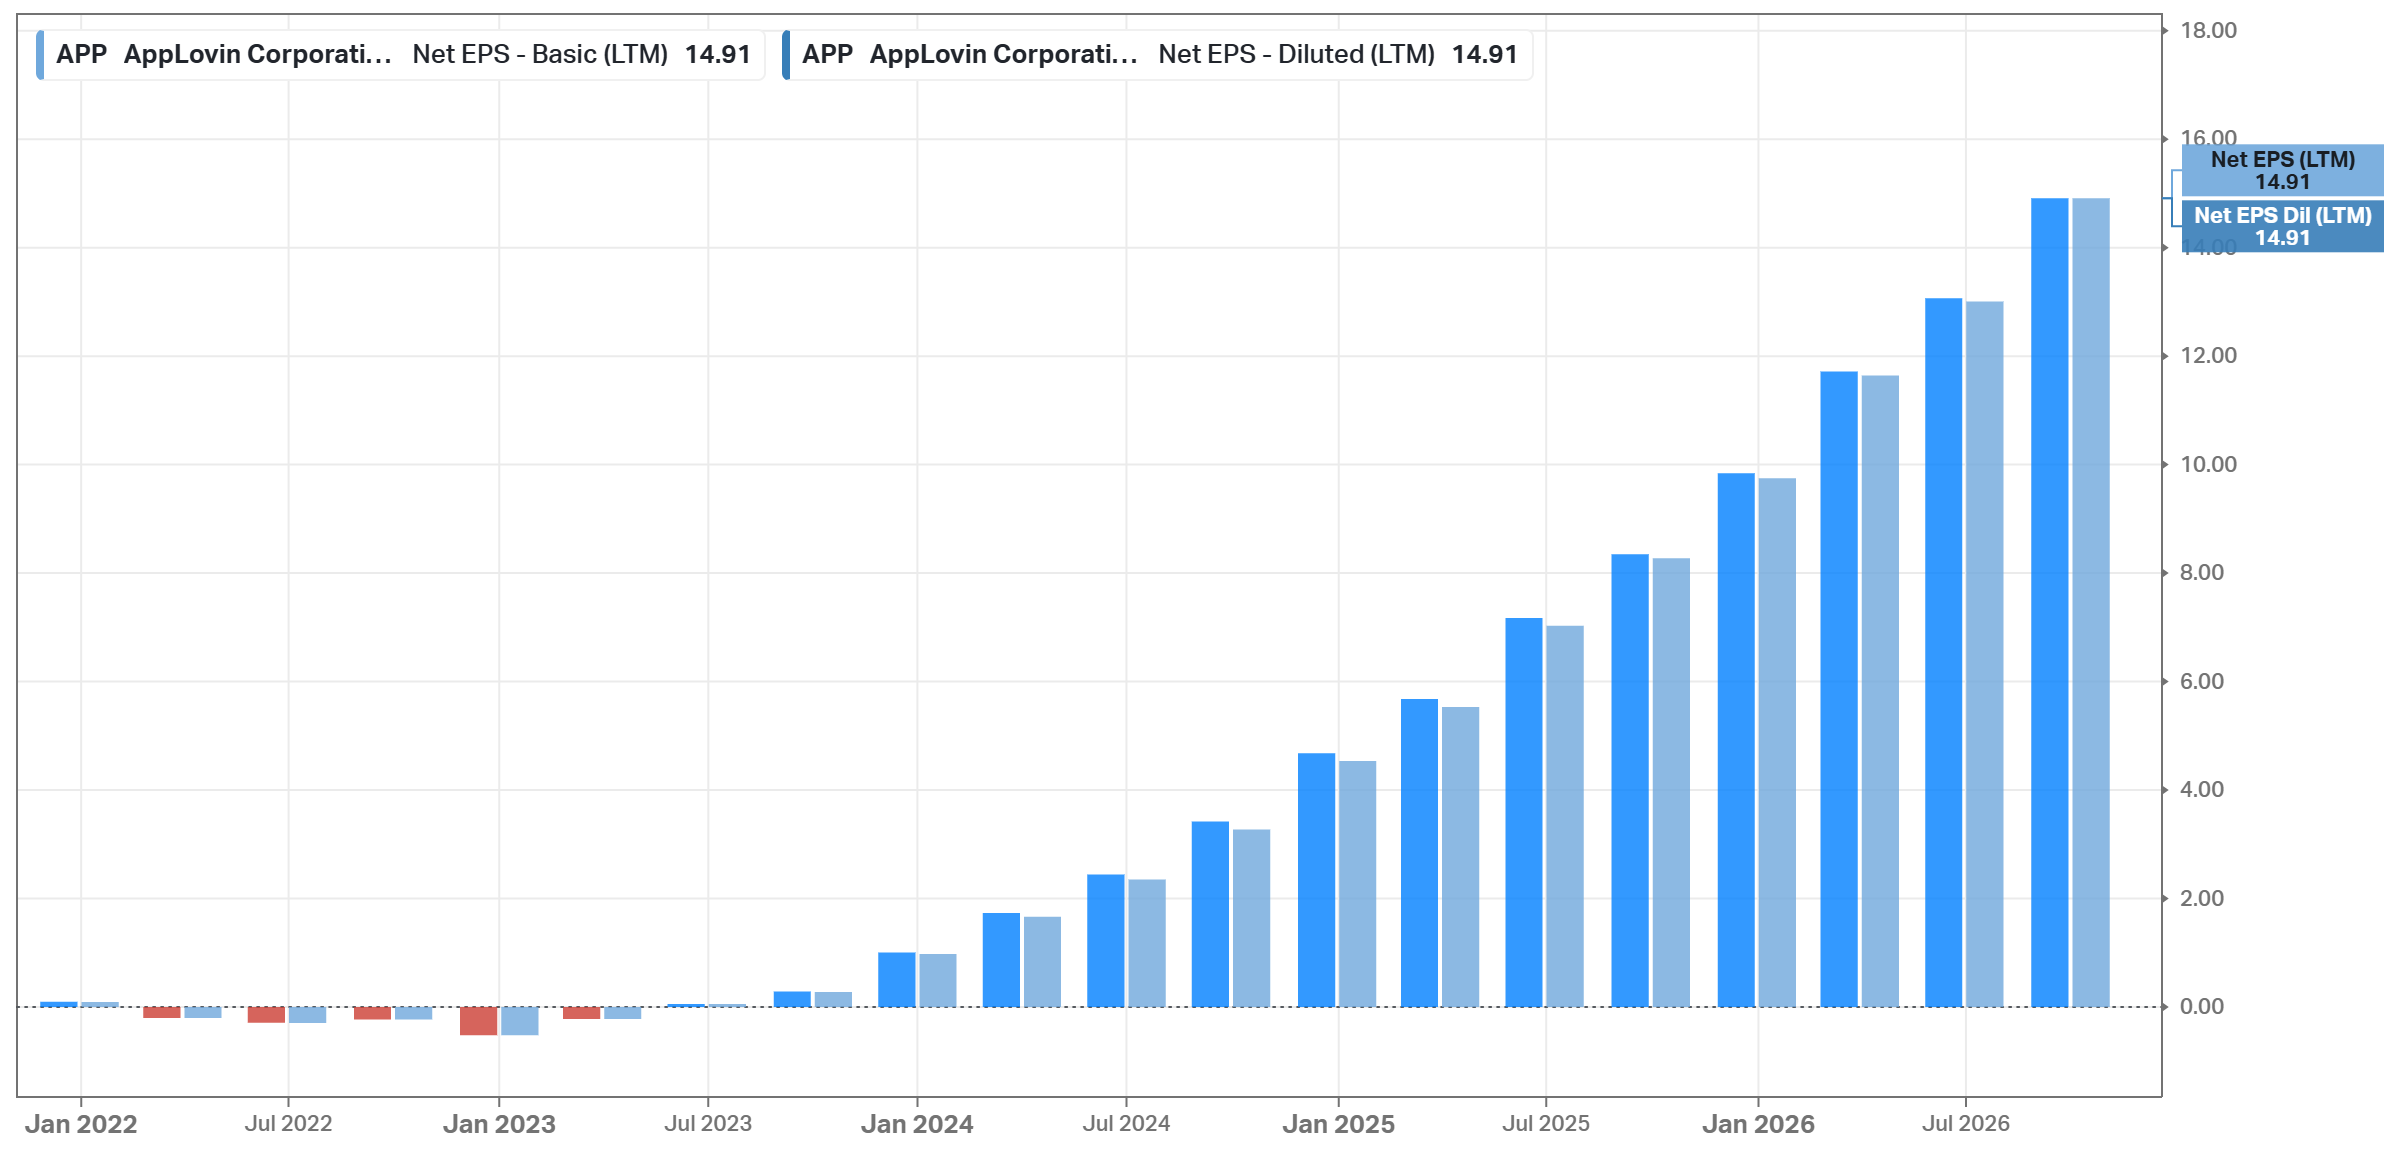
LTM: revenue $7.61B, net income $5.01B ($5.11B on Koyfin), diluted EPS $14.85, FCF $4.88B, ROIC 74.08%
Why did APP gain 31% after the report? In my view, there are four reasons:
The beat was large where it mattered. Revenue was 5.2% above consensus, and gaming, which the bears saw as saturated, grew nearly 50%.
The guidance confirmed it. At the midpoint, the Q4 revenue guidance was ~6% above the consensus, and it includes only “the model updates that we’ve already launched”.
The Q2 explanation proved true. In August, management said the miss was about timing and “already been addressed”. Q3 showed it, and Foroughi repeated that the Q2 problem was “our own foot fault”, not competition.
The stock was priced for a broken story. At $228.50 on Oct 30, APP traded at ~12x forward earnings, the lowest multiple since the Apps sale in June 2025.
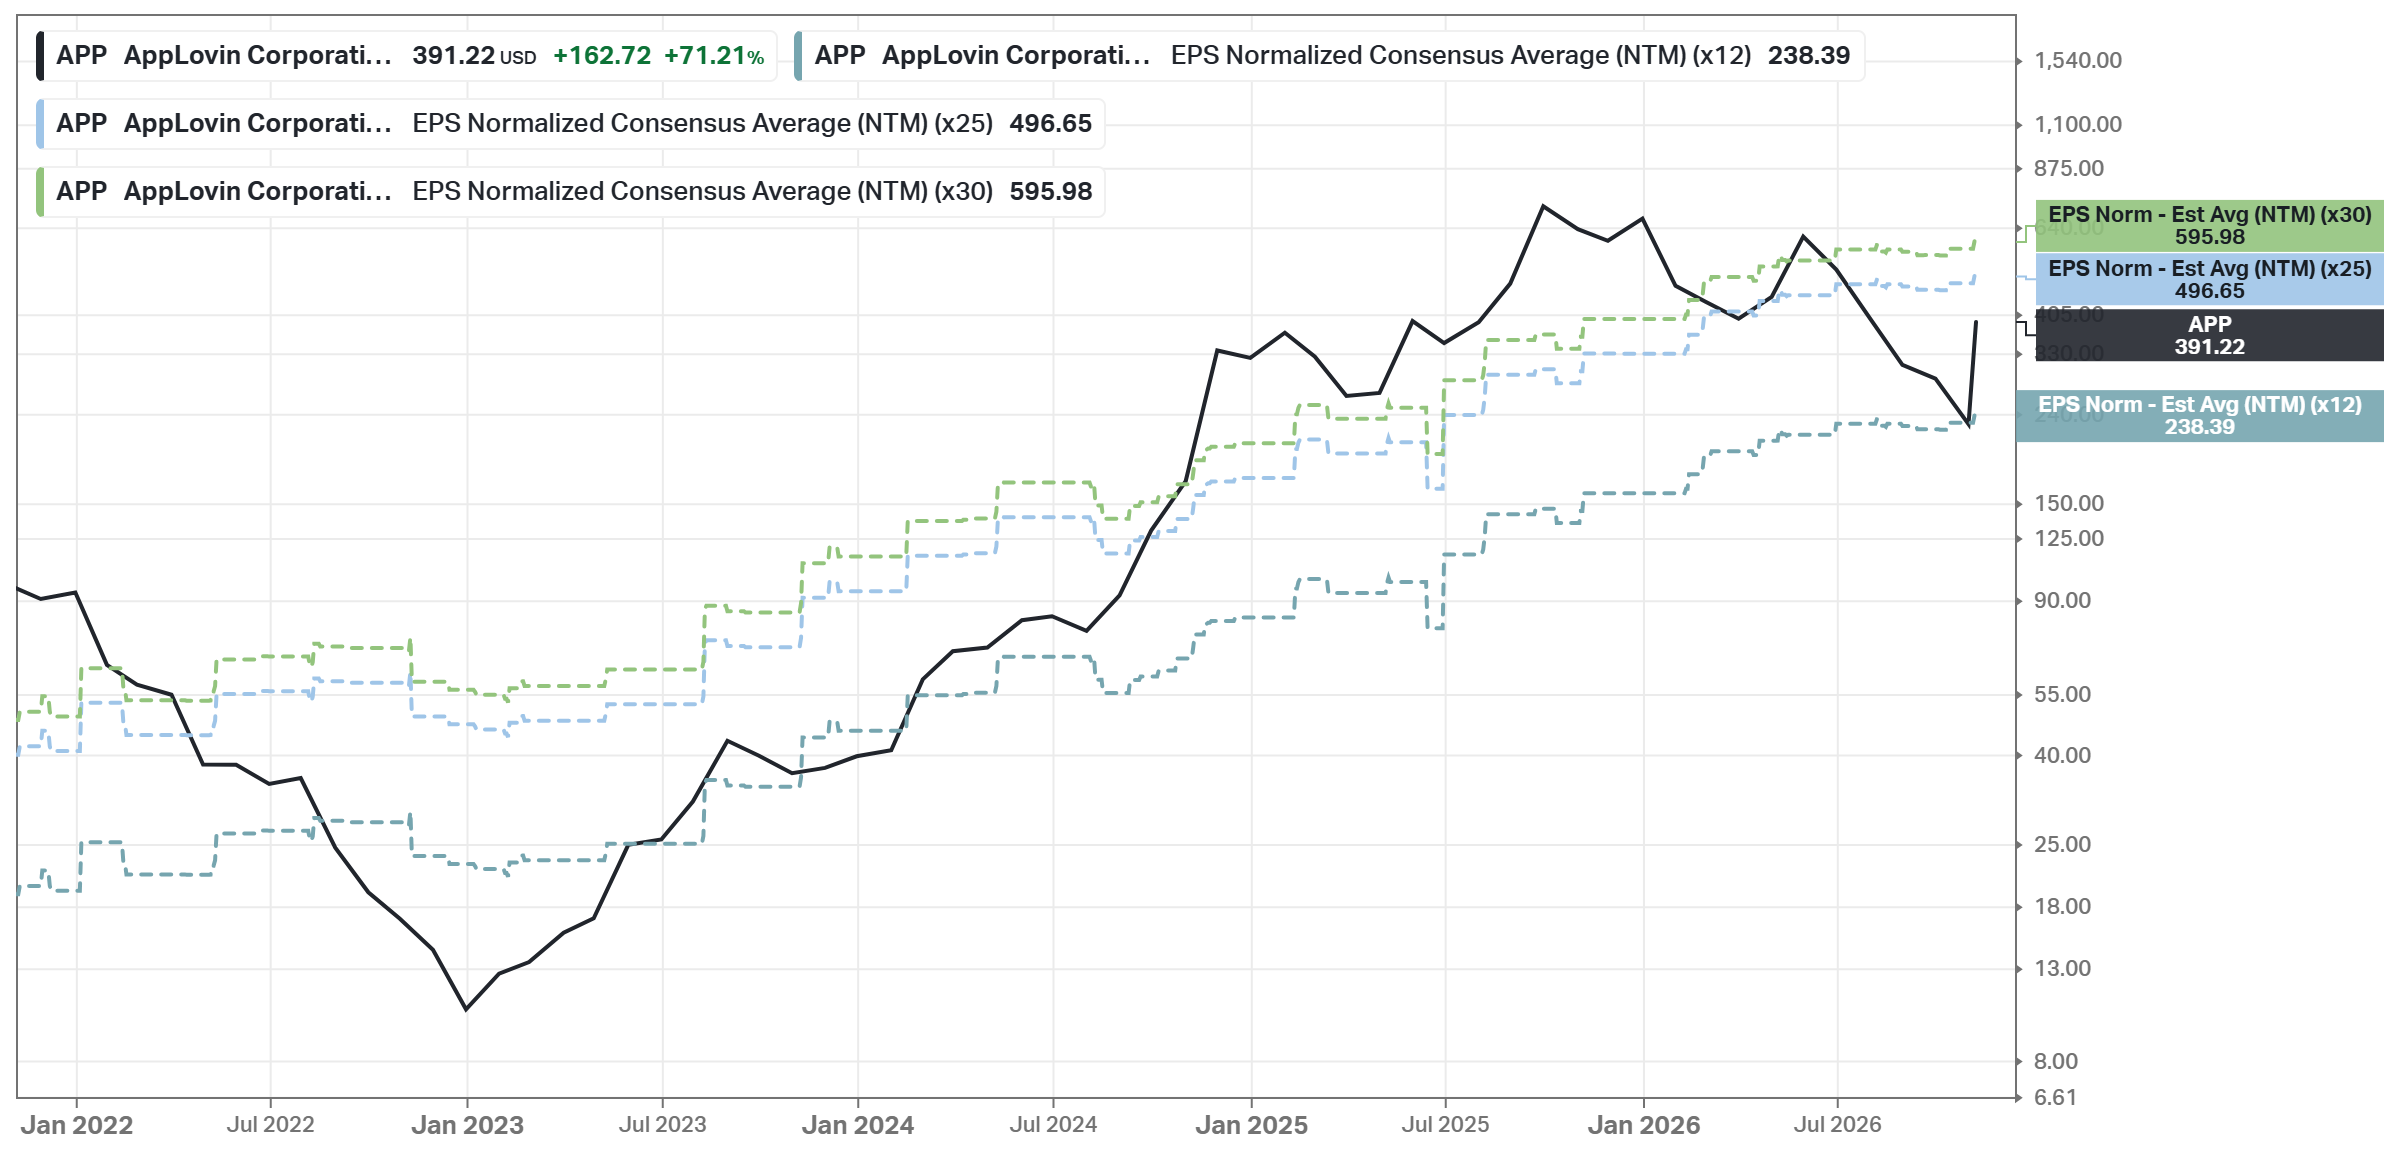
Most of the rally is a higher multiple, not higher estimates. From Oct 30 to Nov 06, APP gained 71%. In the same period, the NTM EPS consensus on Koyfin increased only ~4%, to $19.87, and the forward P/E rose from ~12x to 19.7x.
On Zacks, the 2027 consensus had fallen from $20.72 to $19.63 in the 3 months before the report. In the week after it, 8 analysts raised their 2027 estimate and 1 cut it, and the consensus rose 5.7% to $20.75. So the report mostly reversed the summer estimate cuts.
In my opinion, the reaction makes sense, since the price had assumed that the Q2 problem was permanent, but the next leg needs growth in estimates, not in the multiple.
2026 had two legs down: the first on outside news, the second on AppLovin’s own execution. From the $733.60 high on Dec 22, 2025, APP fell to $366.91 by Feb 12. The causes included a short-seller report on money laundering (CapitalWatch retracted part of it in February), Google’s Project Genie AI game tool, the launch of CloudX (a new ad platform led by a MoPub co-founder), and the Q4 report.
By Jun 01, APP had recovered to $613.70. Then the second leg was about AppLovin itself: on Jul 13, a Bank of America note on slow e-commerce sign-ups cut the stock 12.6%, and on Aug 06, after the Q2 miss, it fell 19.7%, as analysts cut their ratings and targets. By Oct 30, APP was 69% below its high. The last step, -10.4% on Oct 30, came with no company news that I could find.
The longer history is one of the strongest in the market. Advertising revenue rose from $1.05B in 2022 to $5.48B in 2025, up 73.5% per year, and to $7.61B LTM. Diluted EPS from continuing operations increased from $1.26 in 2023 to $10.04 in 2025, and LTM EPS is $14.85 ($14.91 on Koyfin). Total company FCF increased from $345M in 2021 to $4.88B LTM. AppLovin lost money in 2022, so EPS did not grow in each of the last 5 years.
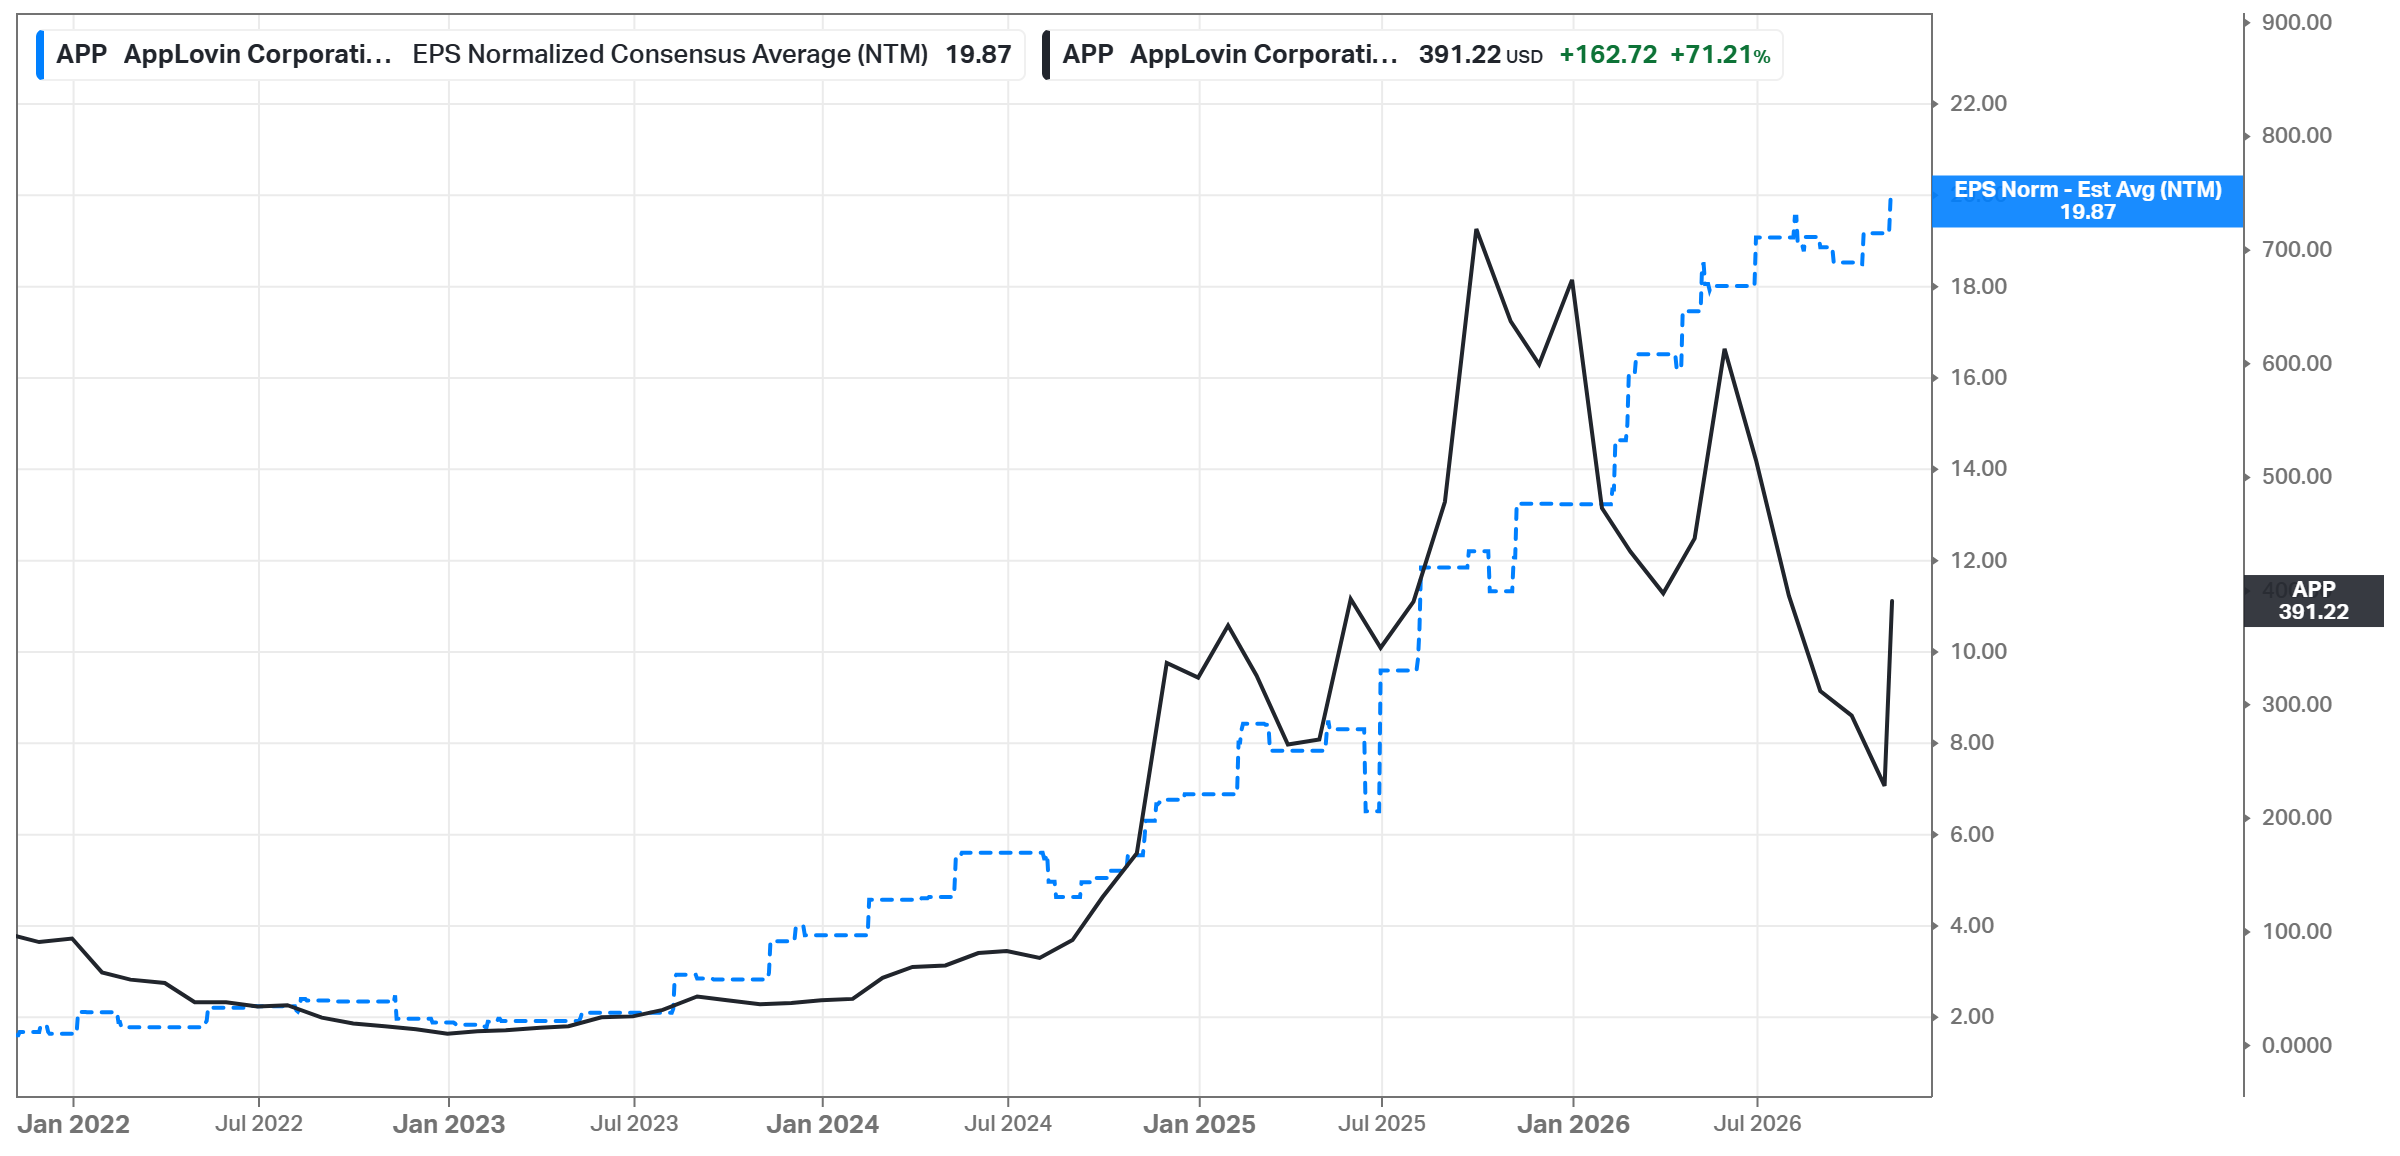
The EPS consensus barely paused, while the price fell 69%. From ~$13 at the start of 2026, the NTM EPS consensus increased to $19.87 today, with only a small dip after the Q2 report. The price peaked twice, in late 2025 and in June, and both times fell much faster than the estimates. We can see the same gap as in early 2025, after the short reports: the price moves on doubts about the story, while the earnings keep growing.
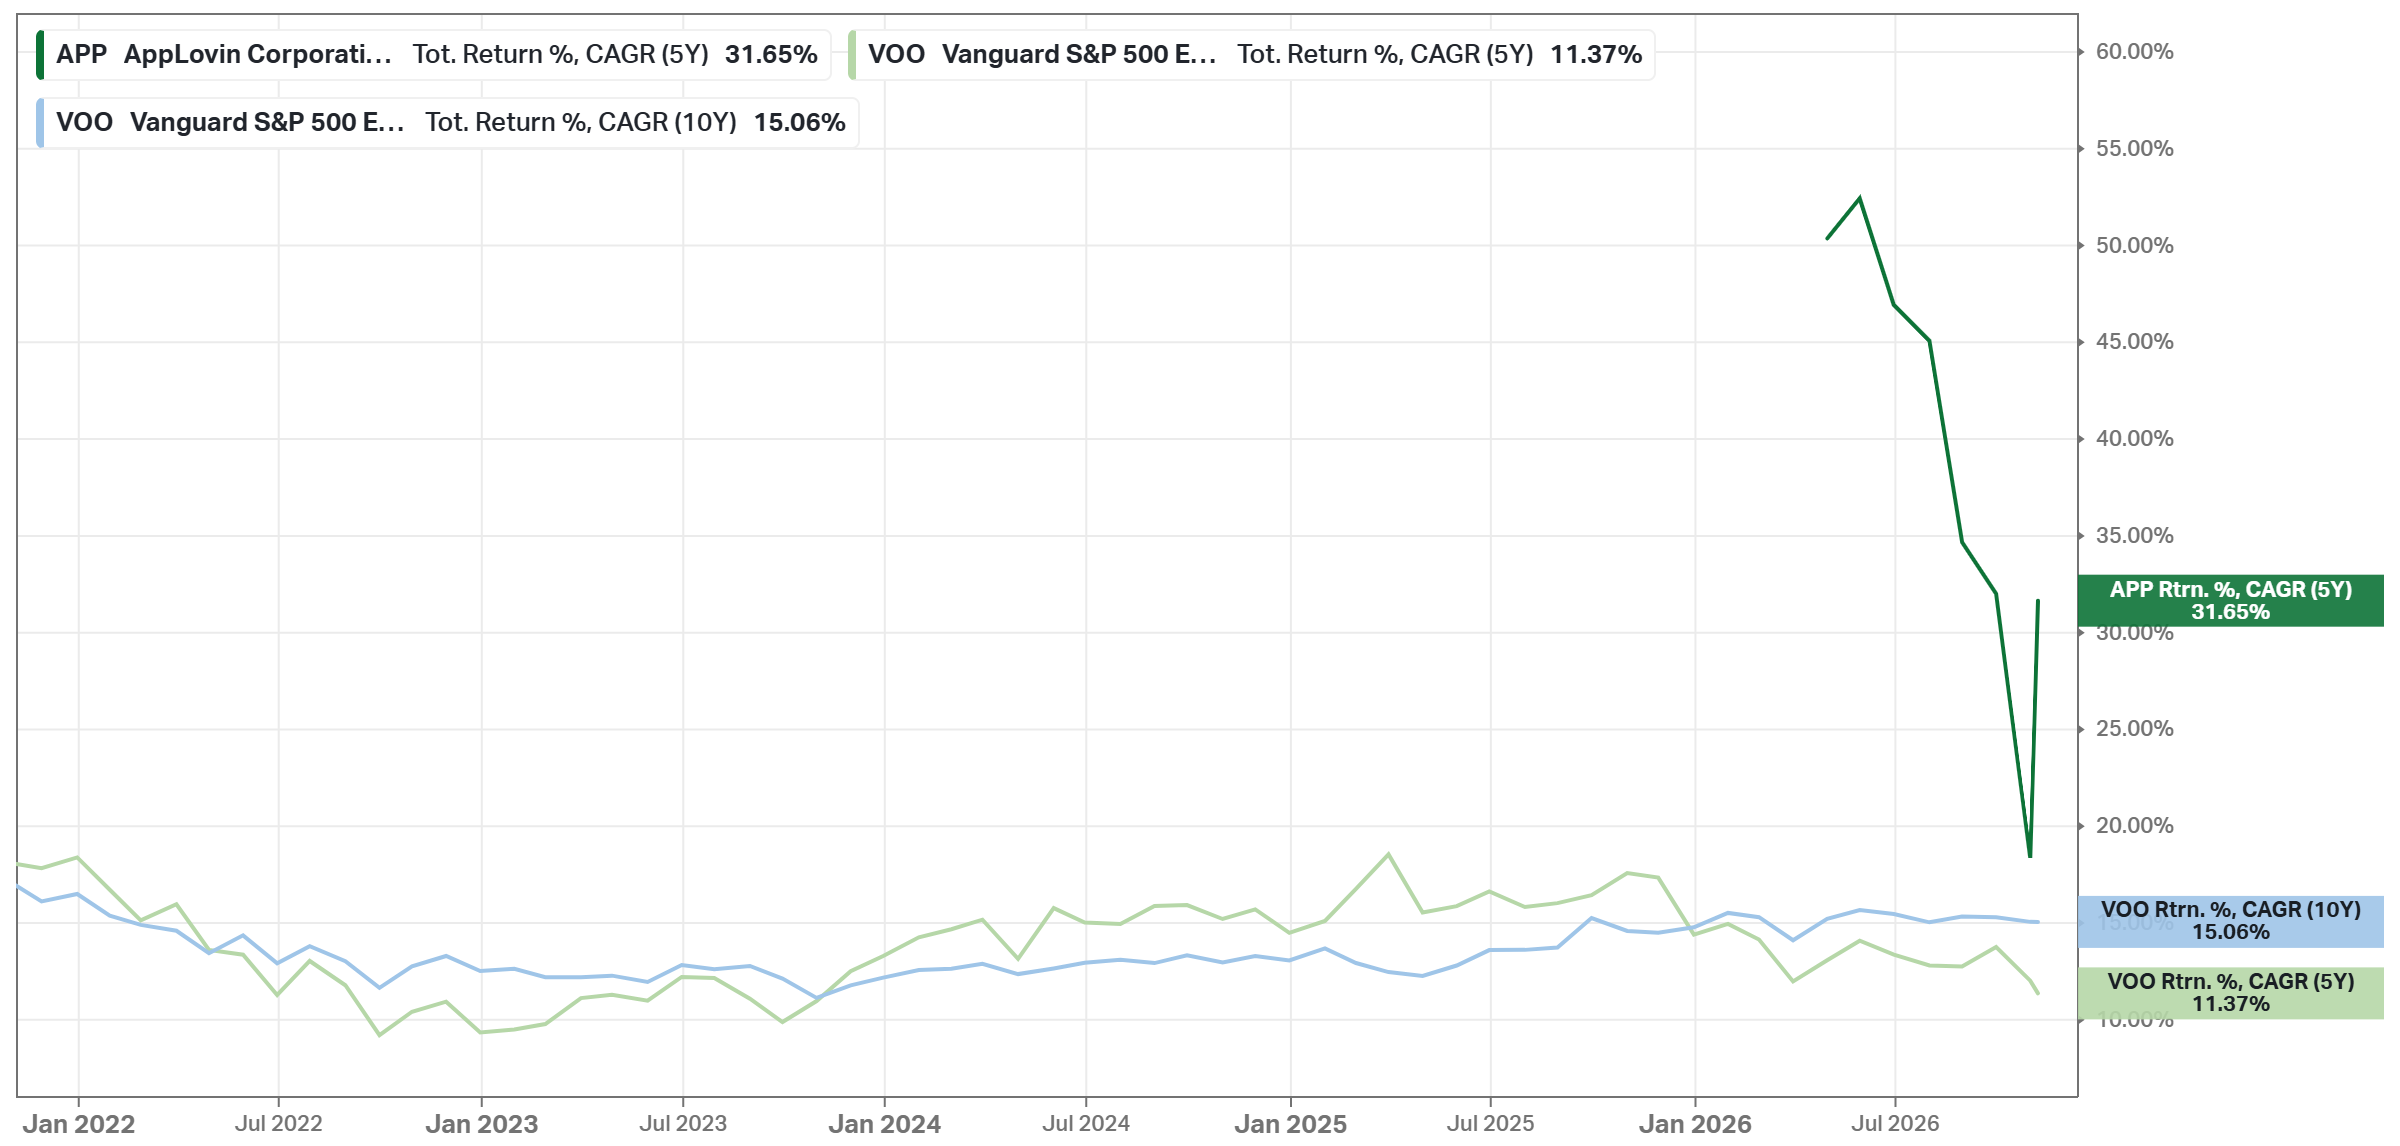
APP beat the S&P 500 by a wide margin, even after the falls. Over 5 years, APP returned 31.65% per year against 11.37% for VOO with dividends, and since the IPO in April 2021 at $80, 33.0% per year against 12.3%. 2026 is a different story: APP is down 41.9% YTD, while VOO is up 8.7%. A beta of ~2.5 works in both directions. The APP line on the chart starts in 2026, when the stock first had 5 years of history; for reference, VOO returned 15.06% a year over 10 years.
Future

Consensus revenue: 2026 $8.34B (+52.1%), 2027 $10.43B (+25.1%) and 2028 $12.82B (+22.9%). The 2026 number implies Q4 revenue of ~$2.39B, the top of the guidance
Consensus EPS (adjusted): 2026 $17.35 (+63.1%), 2027 $20.70 (+19.3%) and 2028 $25.32 (+22.3%). Zacks: $16.18 for 2026 and $20.75 for 2027, on its own EPS basis. In the week after the report, 9 analysts raised their 2026 estimate, and none cut it
5Y forward EPS growth estimate (Koyfin): 32.01%, against a 37.47% mean and a 20.13% -1 standard deviation band. To compare, revenue of the advertising business grew 73.5% per year in 2022-2025
Analysts (Koyfin): 6 Strong Buy and 21 Buy ratings out of 33, 6 Hold, no Sell; the average target is $459.79 (+17.5% from $391.22), range $345-625
Company guidance: Q4 revenue $2.365-2.395B, which gives more than 50% growth for 2026; FCF of ~70-75% of adjusted EBITDA for the year; over the long term, revenue growth of “roughly 30% annually”
What must go right. The model asks for 20% EPS growth per year for 5 years (the cap of my rules), starting from the 2026 consensus of $17.35. For the first years, the consensus agrees with the model: +19.3% for 2027, and $25.32 for 2028 against $24.98 on my path. By my estimate, it works if revenue grows ~17-18% a year, the EBIT margin stays at ~75-78%, and buybacks reduce the share count ~2% per year. This is well below management’s 30% target. So the model doesn’t need 30%; it needs gaming to grow ~10-15% and consumer to keep growing fast enough to reach ~20-37% of revenue by 2031. With gaming growing 15%, consumer needs to reach ~20%; with gaming at 10%, ~37%.
The part I trust least is consumer. If consumer stays a small business, and gaming slows to ~10%, revenue grows ~12-13%, and EPS ~15% with the buybacks. Then, at 25x, the Base Case falls to $495, still 27% above today’s price, and the Bear Case to $238. The strong 2026 is already in the starting EPS, and the model never grows faster than 20%, so there is no extra cushion.
Q4 and Q1 2027 will tell more than any model. The Q4 report (mid-February) shows the first holiday season with an open self-serve platform; revenue at the top of the guidance ($2.395B) is a pass, since the 2026 consensus already assumes it.
Then Q1 2027 shows how much consumer spend AppLovin keeps after it, since “the same advertiser, like-for-like, will have a huge Q4 and follow it up with a weak Q1”. For Q1 2027, Zacks expects EPS of $4.77 (+34% YoY) and revenue of $2.41B, almost flat vs. $2.39B for Q4, so a flat Q1 is already priced in. Even so, that is +31% YoY, against +44% for Q4 at the top of the guidance, so the estimates already expect growth to slow. Revenue above that number, with consumer still growing triple digits YoY, is a pass. A QoQ decline with no update on the model rollout is a warning. Other checkpoints include Unity’s Vector growth, any sign that Meta bids on iPhone traffic without an ID, the share count against the SBC, and the class actions.

Current Valuation
Current vs 5Y mean:
Price/Fwd Earnings: 19.7x vs 25.0x
Price/Fwd Sales: 13.0x vs 11.1x
Price/FCF: 26.4x vs 37.5x
PEG: 0.62 vs 0.81
Forward Earnings Yield: 4.4% (2026 EPS of $17.35; the 19.7x above uses NTM EPS)
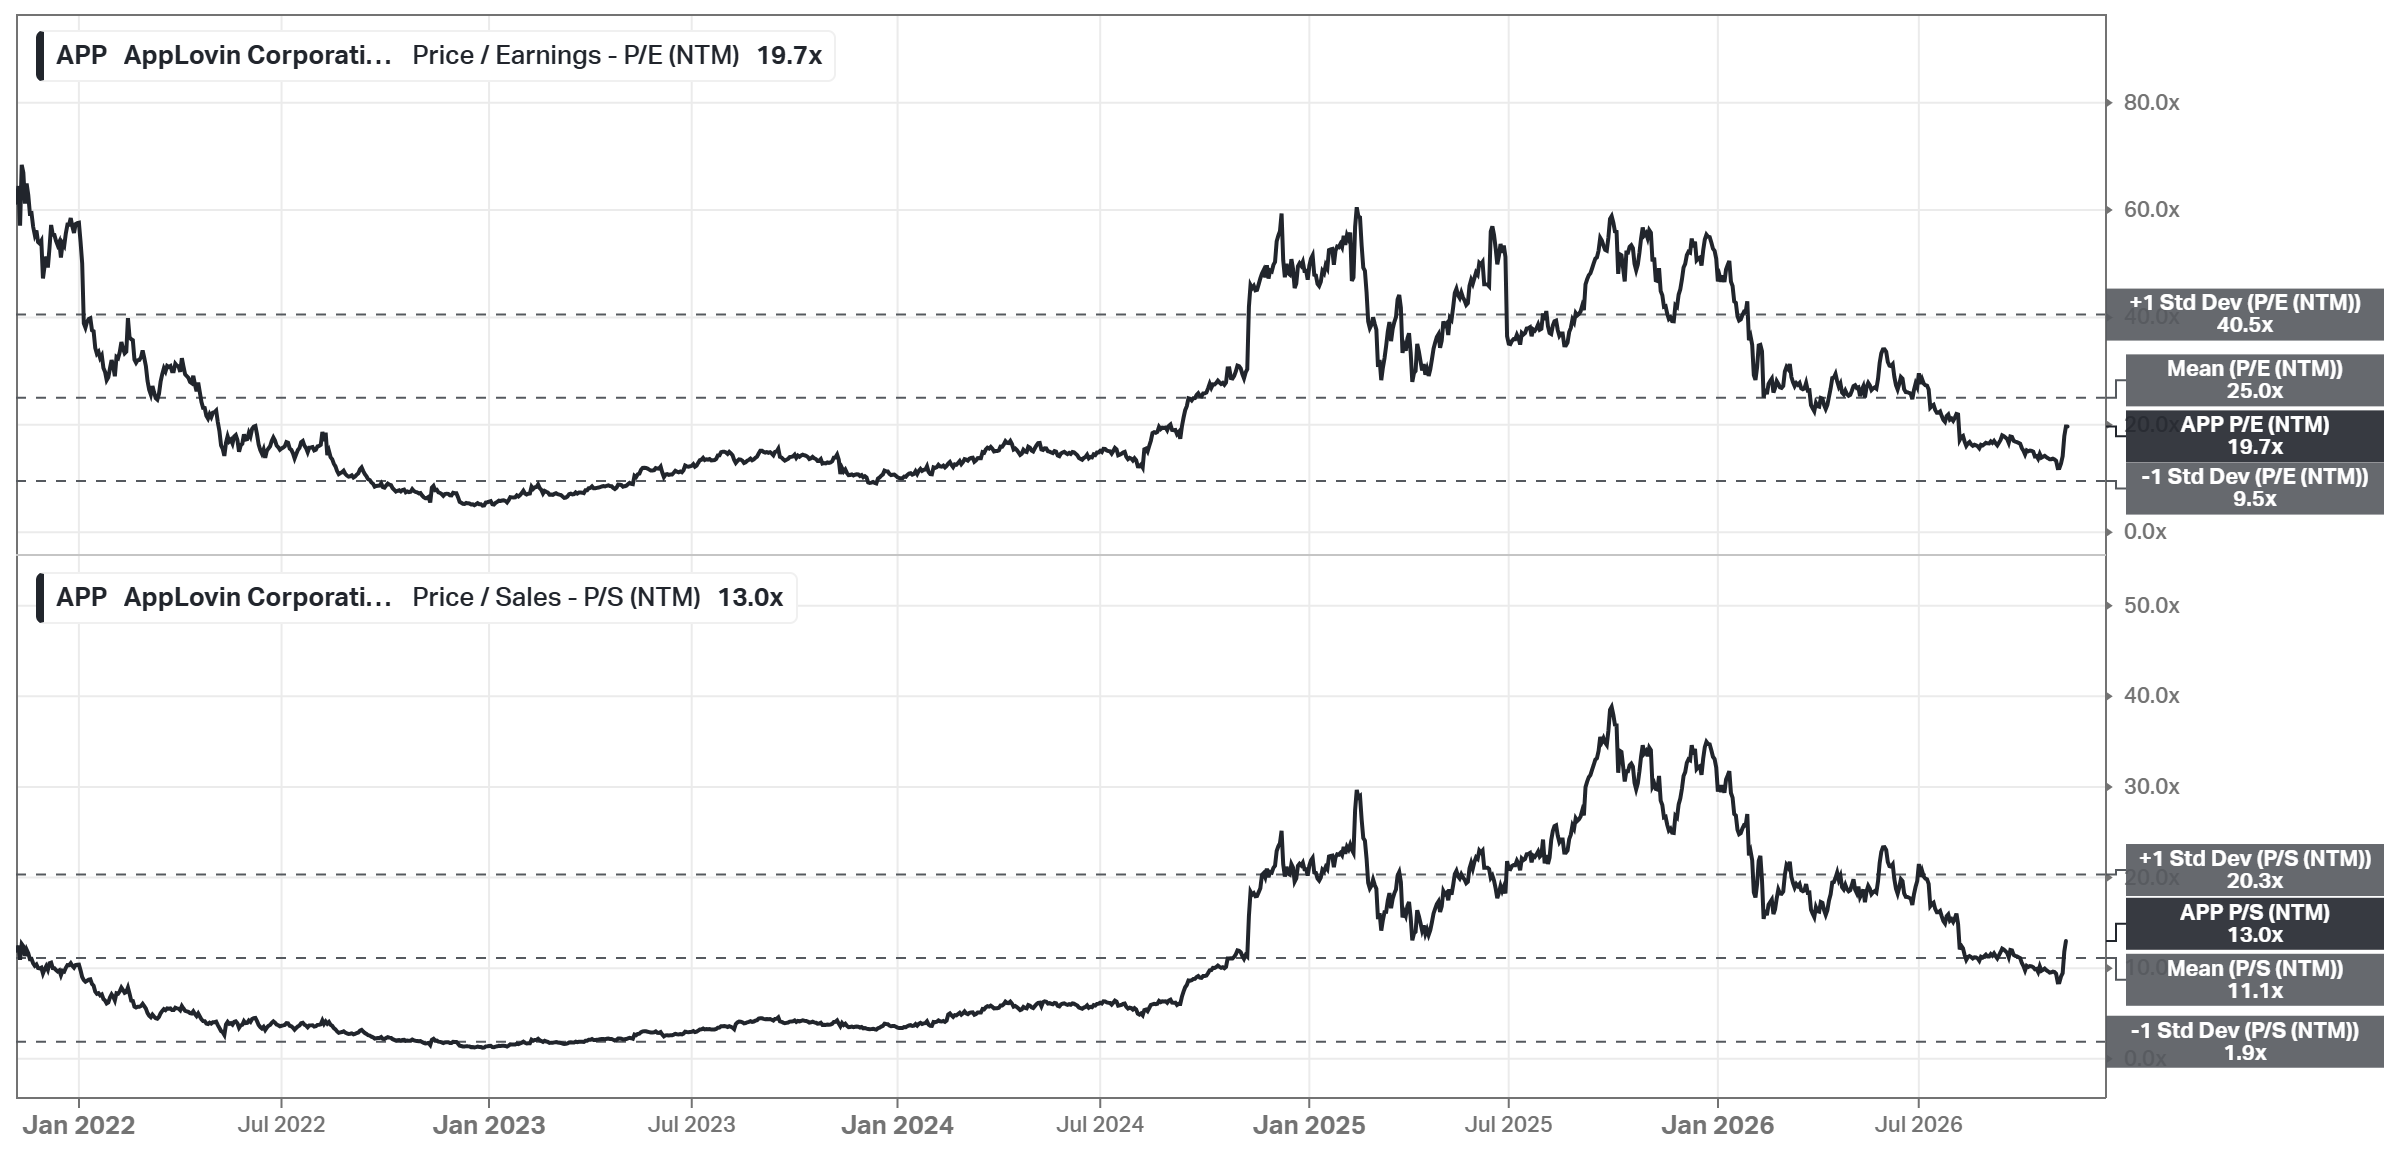
On earnings, APP is between its mean and the low end of its range. Forward P/E is 19.7x, versus a 25.0x mean, a 40.5x (+1 standard deviation) band, and a 9.5x (-1 standard deviation) band. Since mid-2024, the range was ~12-60x: ~12x in mid-2024 and again at the end of October, ~30-60x in 2025. P/S is 13.0x, above its 11.1x mean. On 2027 consensus EPS ($20.70), the P/E is 18.9x.
Analyst’s note:
The 5Y means of APP are distorted in both directions. They include the months after the 2021 IPO (P/E of 50-70x) and the 2022-2023 washout (5-6x), when AppLovin’s own low-margin games were 63% of its revenue in 2022 and 44% in 2023. P/S is above its mean for the same reason: the old revenue was worth much less per dollar, so a higher P/S today does not mean the stock is expensive. P/B says nothing here, since buybacks keep equity low, and its -1 standard deviation band is negative. I use the forward P/E, P/FCF and the PEG, and I do not use the P/E mean for the Bear Case.
On FCF, APP is at 26.4x, about halfway between the 37.5x mean and the 15.5x -1 standard deviation band. The LTM FCF yield is 3.8%.
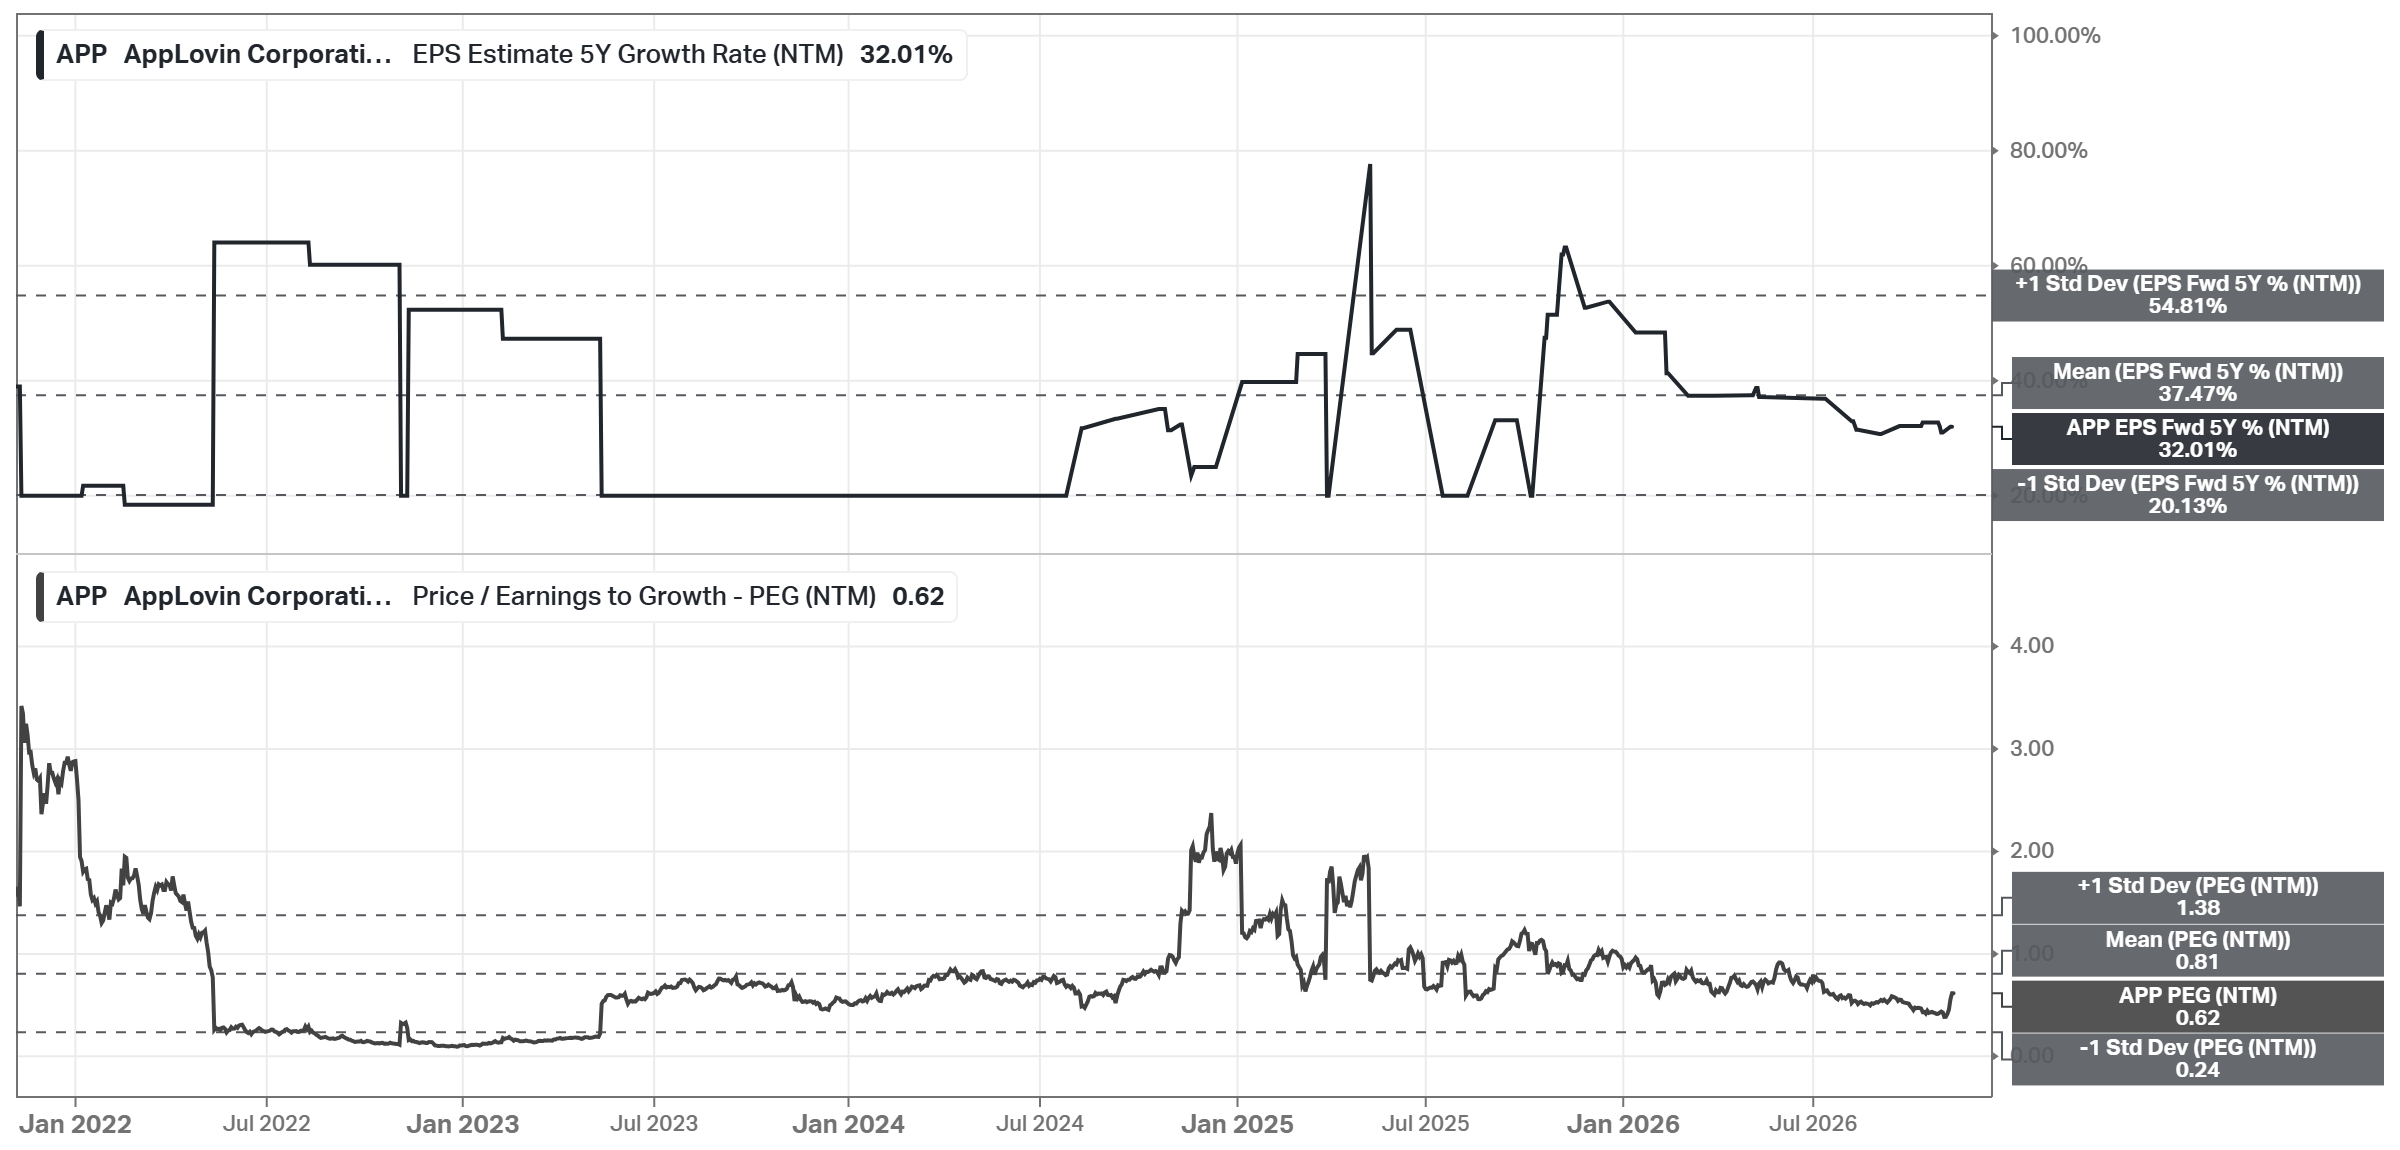
The growth estimate decreased less than the multiple. At 32.01%, the 5Y EPS growth estimate is below its 37.47% mean but far above the 20.13% -1 standard deviation band. PEG is 0.62 against a 0.81 mean. In my view, 32% for 5 years is too high to rely on, since it would mean EPS of ~$70 in 2031. That is why my model caps the growth at 20%.
So what is priced in at $391? Here, I use today’s NTM EPS ($19.87), not my model. With the forward multiple unchanged at 19.7x, APP needs ~12% EPS growth per year for a 12% annual return (my model’s discount rate), less than the 19% consensus expects for 2027.
If the multiple falls to ~15x in 5 years, it needs ~18%; a return to ~12x as of Oct 30 needs ~24%, more than consensus. So the price includes a lower multiple, but not a return to the October low. At the ~19% consensus growth, the multiple can fall to ~14x on today’s NTM EPS, and the investment still earns 12% a year.
One chart frames this whole section. It shows the NTM EPS consensus times my exit multiples (12x, 25x and 30x) against the APP price. On Oct 30, the price touched the 12x line; today, it is between the 12x and 25x lines. The lines use today’s NTM EPS, so they are not my fair prices, which use 2031 EPS discounted at 12%. At $238, the 12x line matches my 15%-growth Bear Case only by chance.
Fair Price
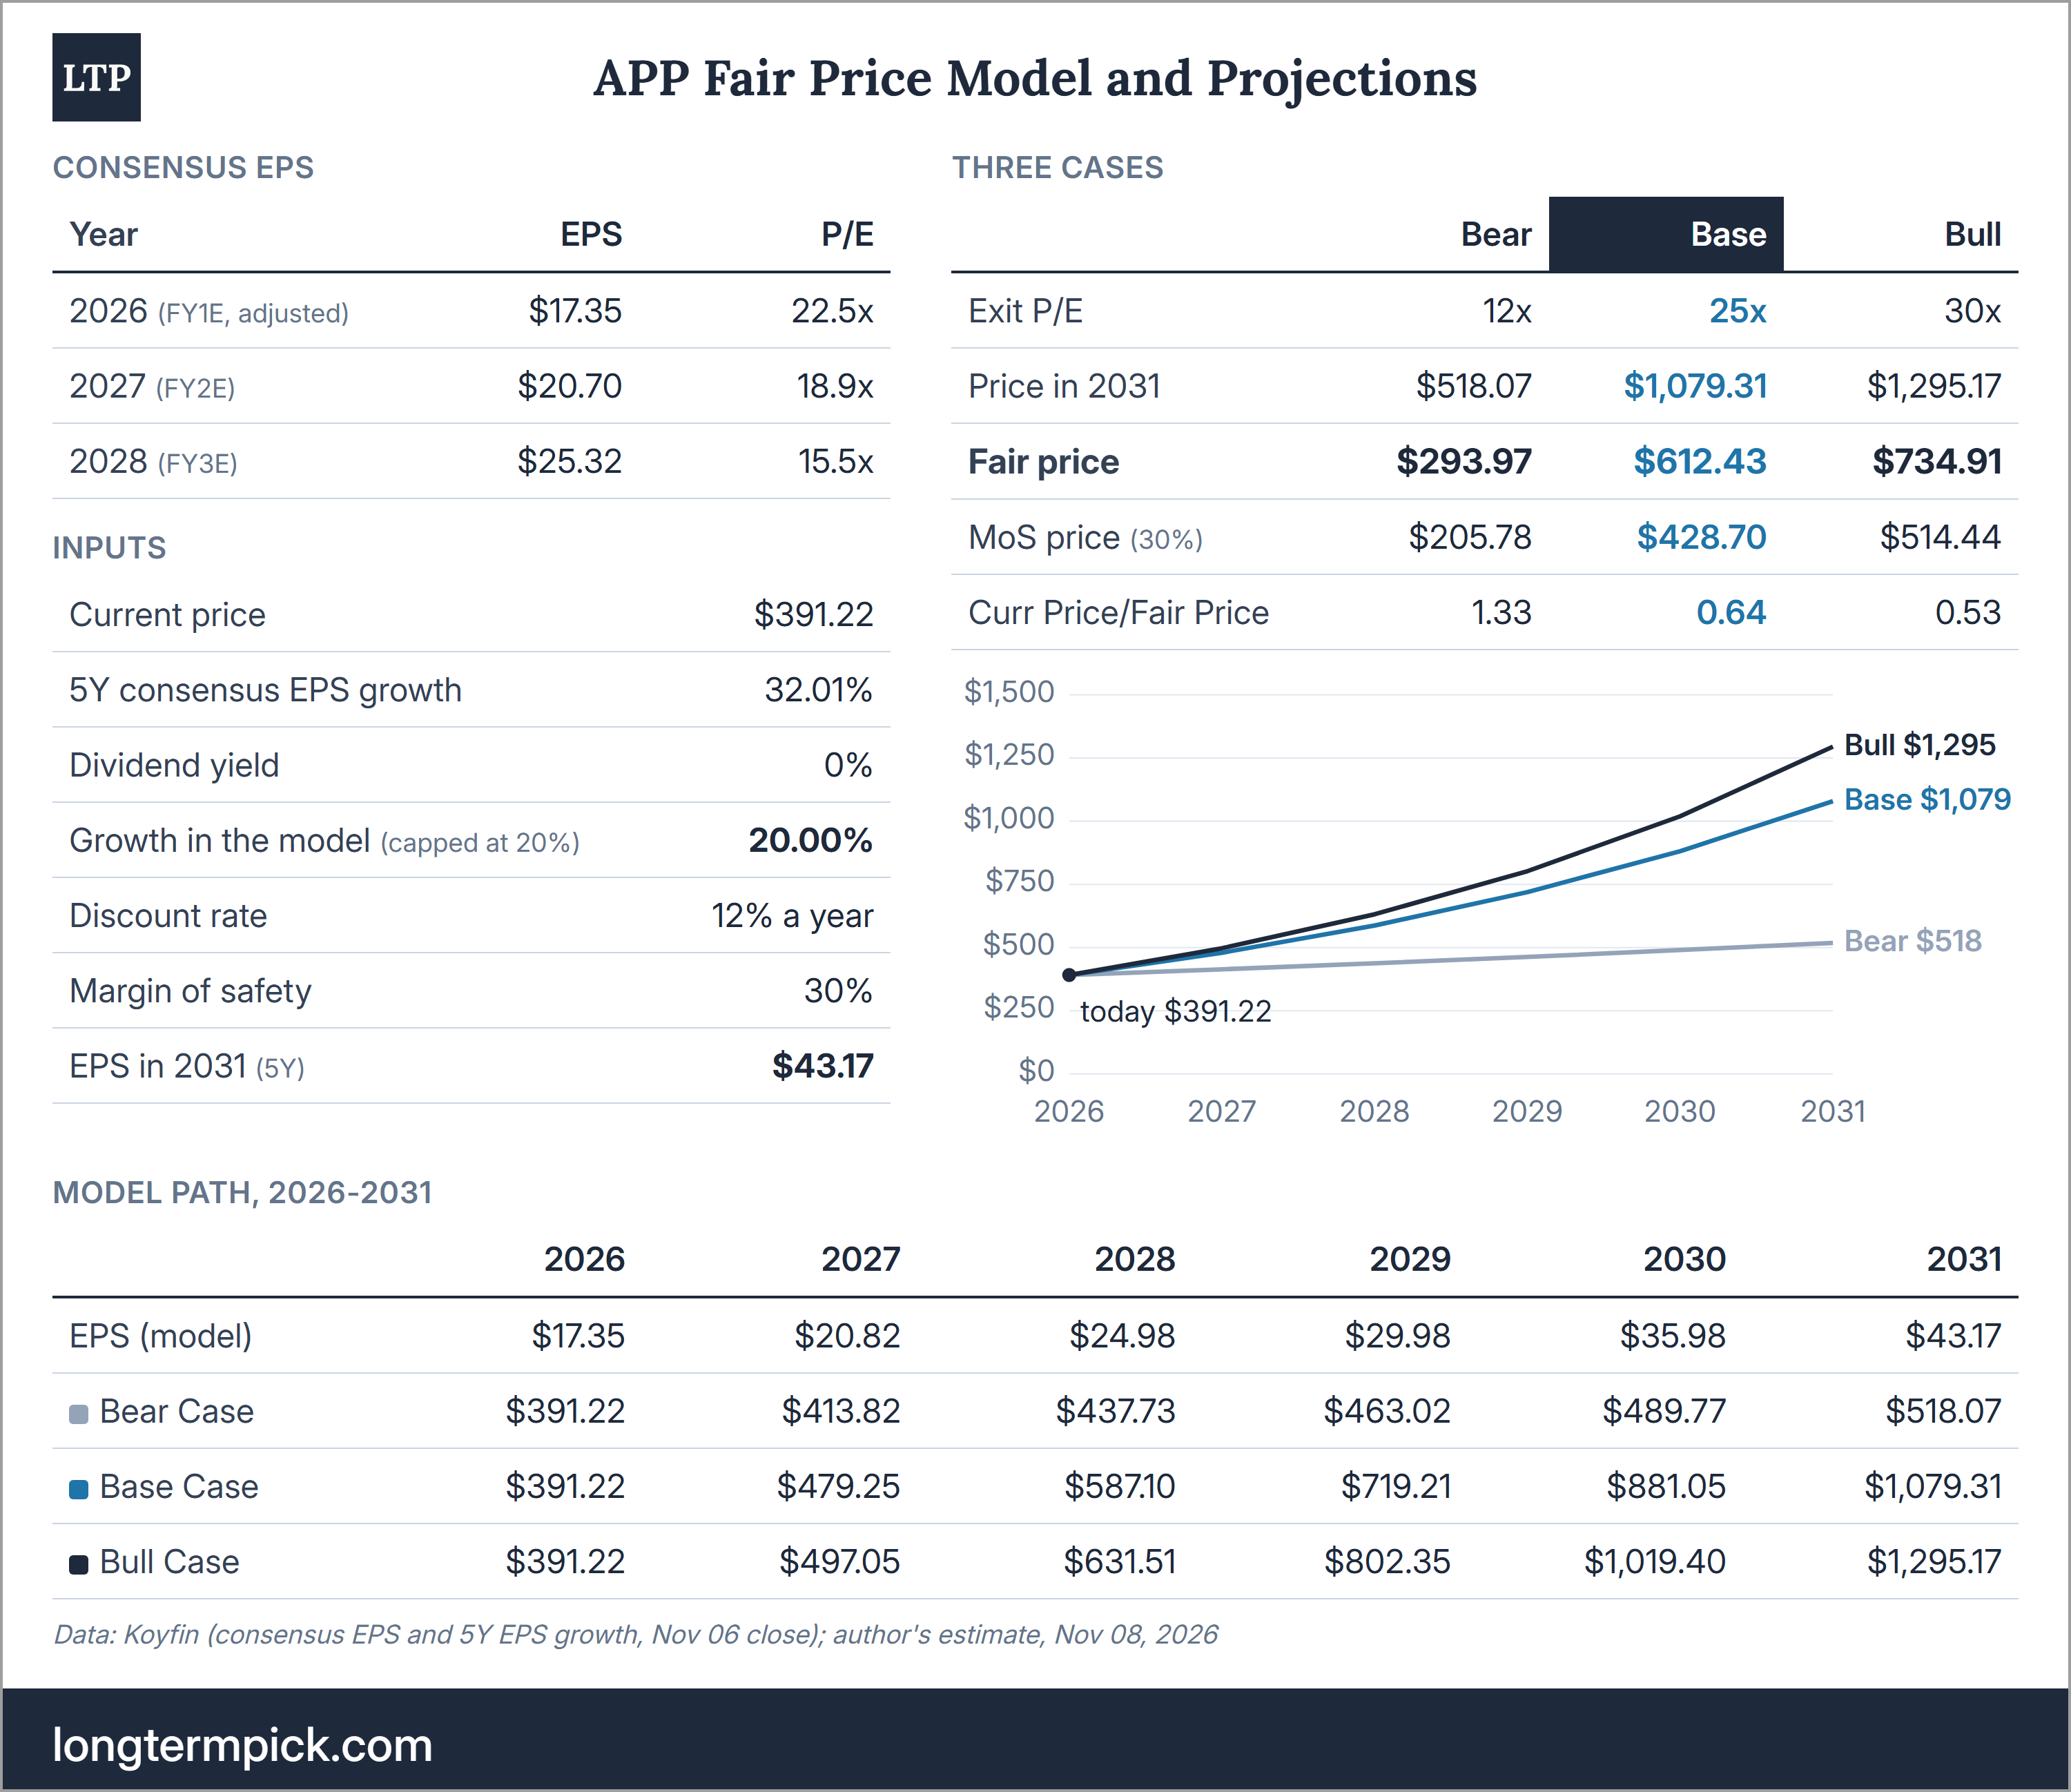
My model grows EPS for 5 years at the consensus rate. Consensus can be too optimistic, so my model accounts for this by capping future growth at 20%. For AppLovin, the cap matters a lot: the 5Y EPS growth estimate is 32.01%, and AppLovin pays no dividend, so the model uses 20%, starting from the 2026 consensus of $17.35. This gives EPS of $43.17 in 2031. For 2027, my path ($20.82) is almost the same as the consensus ($20.70).
The starting EPS matters. Mine is S&P Global’s adjusted number. Zacks, whose basis matched GAAP EPS in 2025, has $16.18 for 2026, ~7% less. From that base, the fair prices would be $274/$571/$685 and the accumulation zone $192-274; so APP is above the zone on either basis. The gap is a 2026 effect: for 2027, both sources expect ~$20.7.
The discount rate is 12%; the margin of safety is 30%. My exit multiples are 12x, 25x, and 30x. 12x is the multiple of the Oct 30 low, the lowest since AppLovin became a pure advertising company in June 2025; so the Bear Case assumes the market never trusts AppLovin more than it did at the worst point of 2026.
I do not use the 9.5x -1 standard deviation band because it comes from 2022-2023, when AppLovin was a different company: its own low-margin games were 44-63% of revenue, and net debt was ~$2.1-2.6B. APP also traded near 10x at the start of 2024, when Axon 2.0 was already live, but AppLovin still owned its games then.
As for the 5Y mean of 25.0x, it is distorted too, so for the Base Case I use PEG 1.25 at the 20% cap, which also gives 25x. 30x, the Bull Case, is the ceiling of my rules (PEG 1.5 at 20%), well below the 40.5x +1 standard deviation band.
Bear Case (exit P/E 12x): fair price $294 - MoS price $206
Base Case (exit P/E 25x): fair price $612 - MoS price $429
Bull Case (exit P/E 30x): fair price $735 - MoS price $514
As I see it, the wide gap between the Bear Case and the Base Case is the honest measure of the uncertainty here. The Base Case is a business that keeps its lead and a market that pays a normal multiple for it; the Bear Case is the same growth with the distrust of Oct 30. In dollars, today’s price is $97 above the Bear Case and $221 below the Base Case, so it is closer to the Bear Case.
Here, the multiple matters more than anything else. On my model’s basis (2026 EPS of $17.35 growing at 20%), today’s price implies an exit P/E of ~16x in 2031. At 25x, it implies EPS growth of only ~10% per year. And if EPS grows only 15% per year, my fair prices fall to $238/$495/$594.
Analyst’s note:
APP is on my Watchlist. Watchlist #001 and #002 used a 10x Bear Case multiple, from the -1 standard deviation band of 2022-2023. Here, I use 12x, the level of the Oct 30 low, since that band comes from the years when AppLovin still owned its games, and 25x instead of 26x for the Base Case (PEG 1.25 at the 20% cap). At 10x, the Bear Case fair price would be $245.
Worth noting that $391 is below the Base Case MoS price of $429. In my Portfolio and Watchlist issues, that level is the buy zone (the Manifest rule: a 30% discount to the Base Case). Here, in a deep dive, I use the stricter accumulation zone, from the Bear Case MoS price to the Bear Case fair price, so the price also covers the distrust of Oct 30.
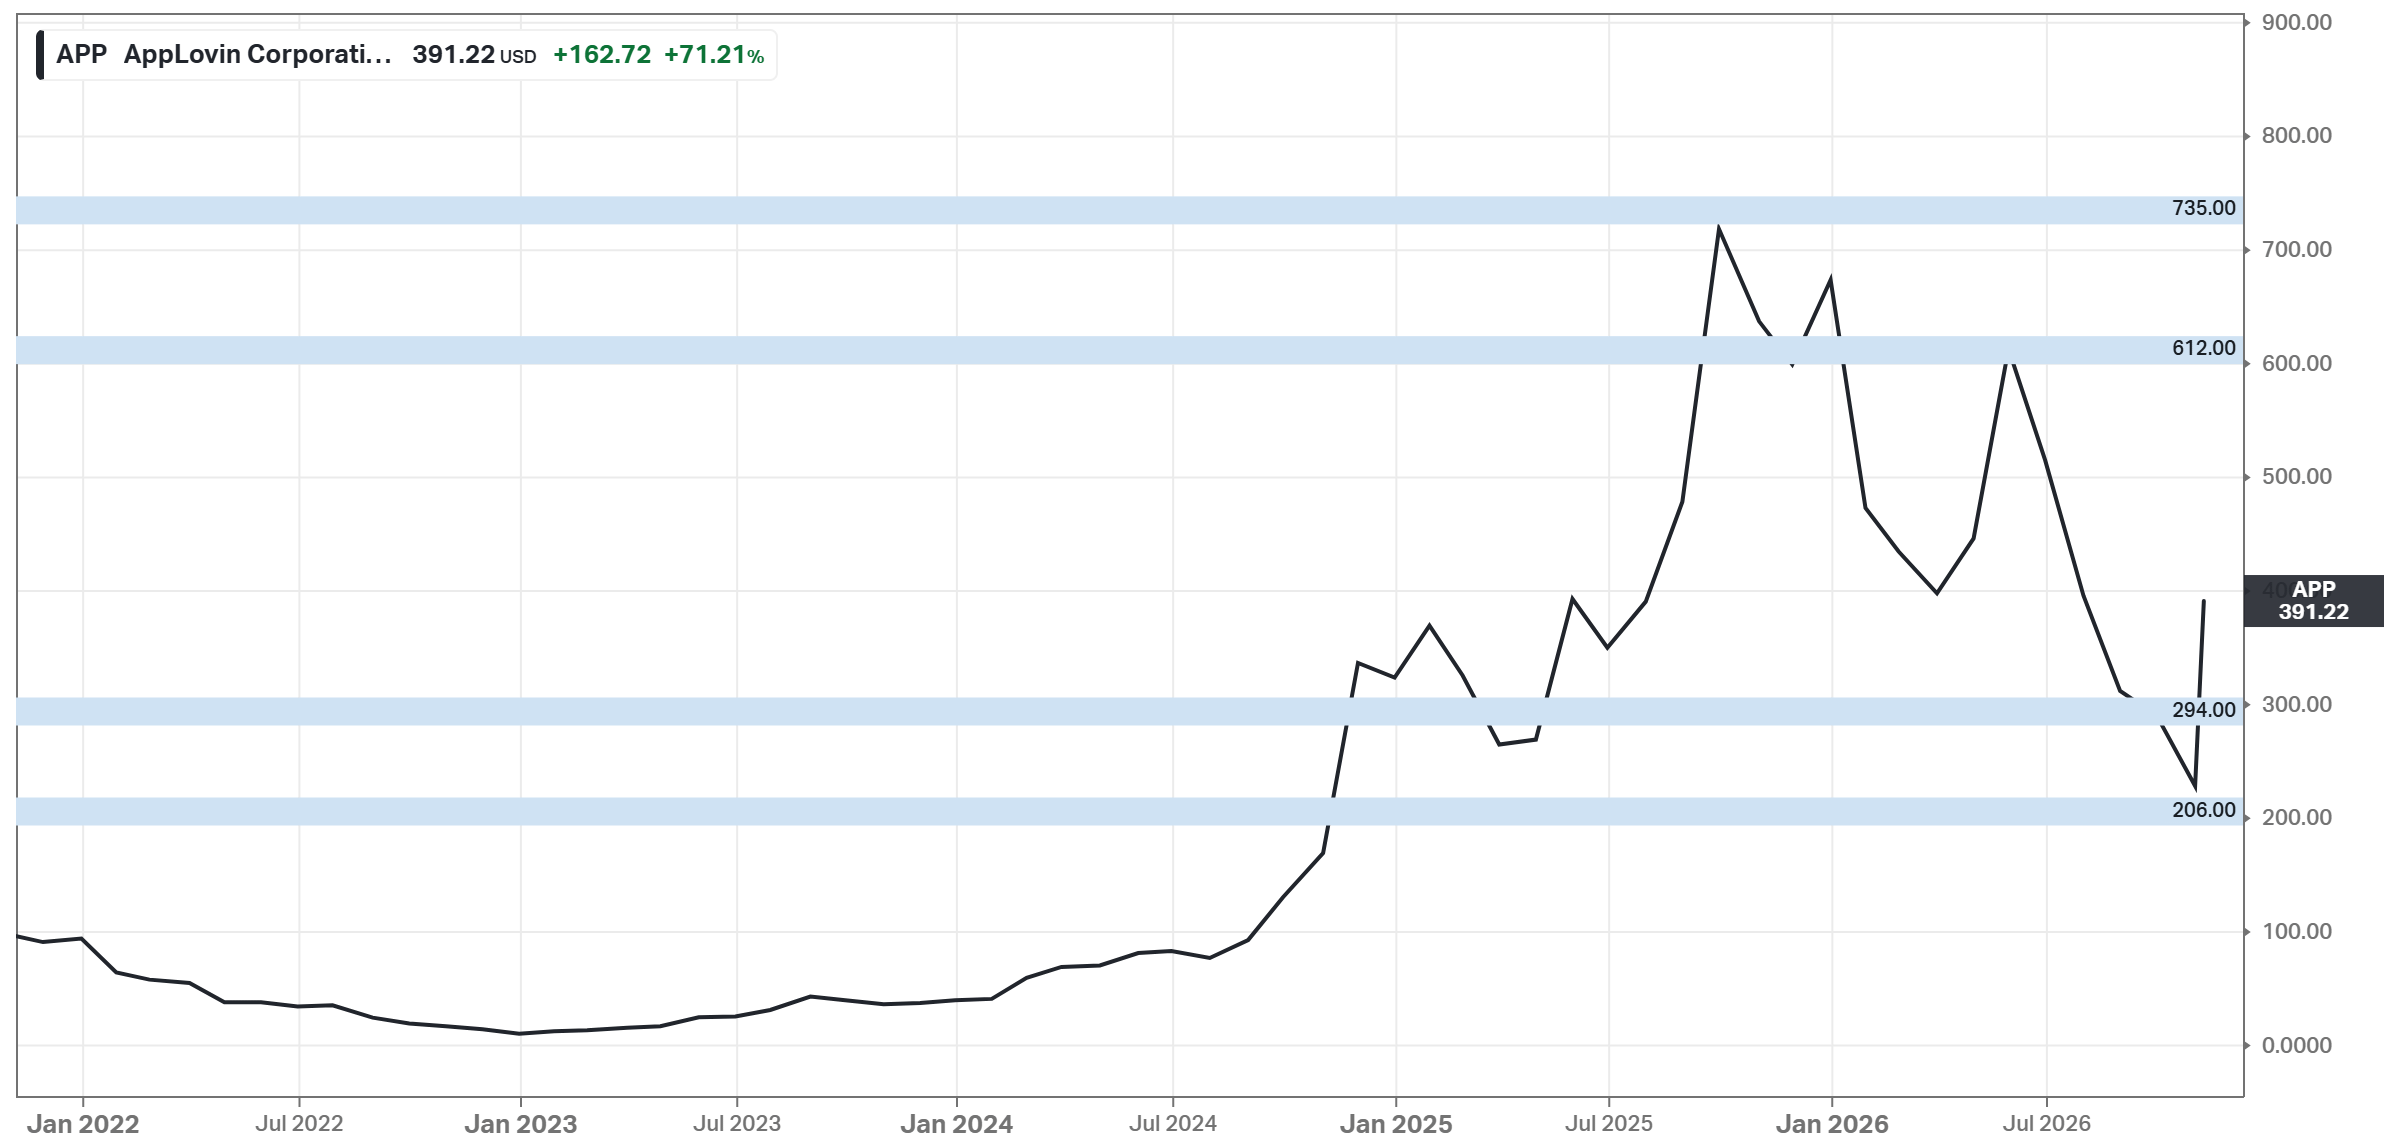
At $391, APP is 36% below the Base Case; at the same time, it is 33% above the Bear Case fair price. The accumulation zone is $206-294, so APP is above it, even though it was inside the zone a week ago.
Due Diligence
Profitability (11 of 15):
Positive Gross Profit: $6.76B
Positive Operating Income: $5.92B
Positive Net Income: $5.01B
Positive FCF: $4.88B
Gross margin >= 40%: Yes (88.78%)
Net margin >= 10%: Yes (65.89%)
FCF margin >= 10%: Yes (64.44%)
Management (ROIC, ROE, ROA) >= 10%: Yes (74.08%/210.09%/49.57%)
Strong 3Y Revenue Growth: Yes (69.2% per year, LTM basis, continuing operations)
Revenue Growth Forecast: Yes (+25.1% in 2027; 32.73% per year on the 3Y forecast)
ROE is increasing: No (~2% in 2021 -> ~300% at the peak in 2025 -> 210.09%)
ROIC is increasing: ~3% at the start of 2022 -> 74.08%
Revenue surprises in the last 5Y in a row: No (misses in Q1-Q3 2022 and Q2 2026)
EPS surprises in the last 5Y in a row: No (5 misses in Q4 2021-Q1 2023)
EPS growth YoY 5Y in a row: No (loss in 2022)
Financial Strength (5 of 6):
Total assets ($8.58B) exceed total liabilities ($5.28B) by 1.6x
Negative Net Debt: No ($0.34B of net debt)
Low Debt/Equity: Yes (106.6%; 5Y mean: 248.2%)
Debt/Capital: Yes (51.6%; 5Y mean: 68.0%)
Interest coverage (EBIT): 28.9x
Piotroski F-Score: 9 of 9 (FY2025; LTM 8 of 9: operating cash flow below net income)
Valuation and Advantage (2 of 4):
Valuation < 5Y mean: No (P/S 13.0x vs 11.1x; every mean is distorted)
Valuation < the industry: No (P/E 19.9x vs 14.3x for XLC; META, TTD and LFTO are cheaper)
Does it have a moat: Yes (narrow)
Outperformed the S&P 500 over 5Y: Yes (31.65% vs 11.37% CAGR)
Shares (2 of 3):
Insider ownership >= 5%: Yes (12.8% for directors and officers; Foroughi 9.0%)
Fewer shares outstanding YoY: Yes (331.3M vs 338.5M)
Insider buys in the last 6M: No (only sales, grants, and gifts)
Price (4 of 4):
1Y price forecast > 10%: Yes (+17.5%)
Next 5Y EPS growth estimate (CAGR) > 10%: Yes (32.01%)
DCF Value: Yes, ~$523 (base case: revenue growth 15.7%, below consensus; 9% discount rate, below my 12%); undervalued by ~25%
Short Interest < 5%: Yes (4.26%)
Verdict
In my view, AppLovin is one of the most profitable businesses in the market, but not one of the safest. It earns a 77.78% EBIT margin with almost no net debt, and in Q3 it grew revenue 55%. At the same time, APP trades at 19.7x forward earnings after a 71% rally in one week, and that rally came almost entirely from the multiple. Consensus expects ~19% EPS growth in 2027; at that pace, the multiple could fall to ~14x, and APP would still earn 12% a year. My fair prices are $294/$612/$735, so APP is 36% below the Base Case but 33% above the $206-294 accumulation zone. The realistic bear case is a consumer business that stays small while Unity and Meta take more of gaming. Then the market can go back to the ~12x of October, and the fair price is ~$238-294. For me, APP is a stock to watch at $391, not one to accumulate: the price already allows for a lower multiple, but not for the October one. What I watch: the Q4 and Q1 2027 reports (consumer spend after the holidays), the full rollout of the new models, Unity’s Vector, Meta’s bidding on iPhone traffic, SBC against the buybacks, and the lawsuits.
One-Pager
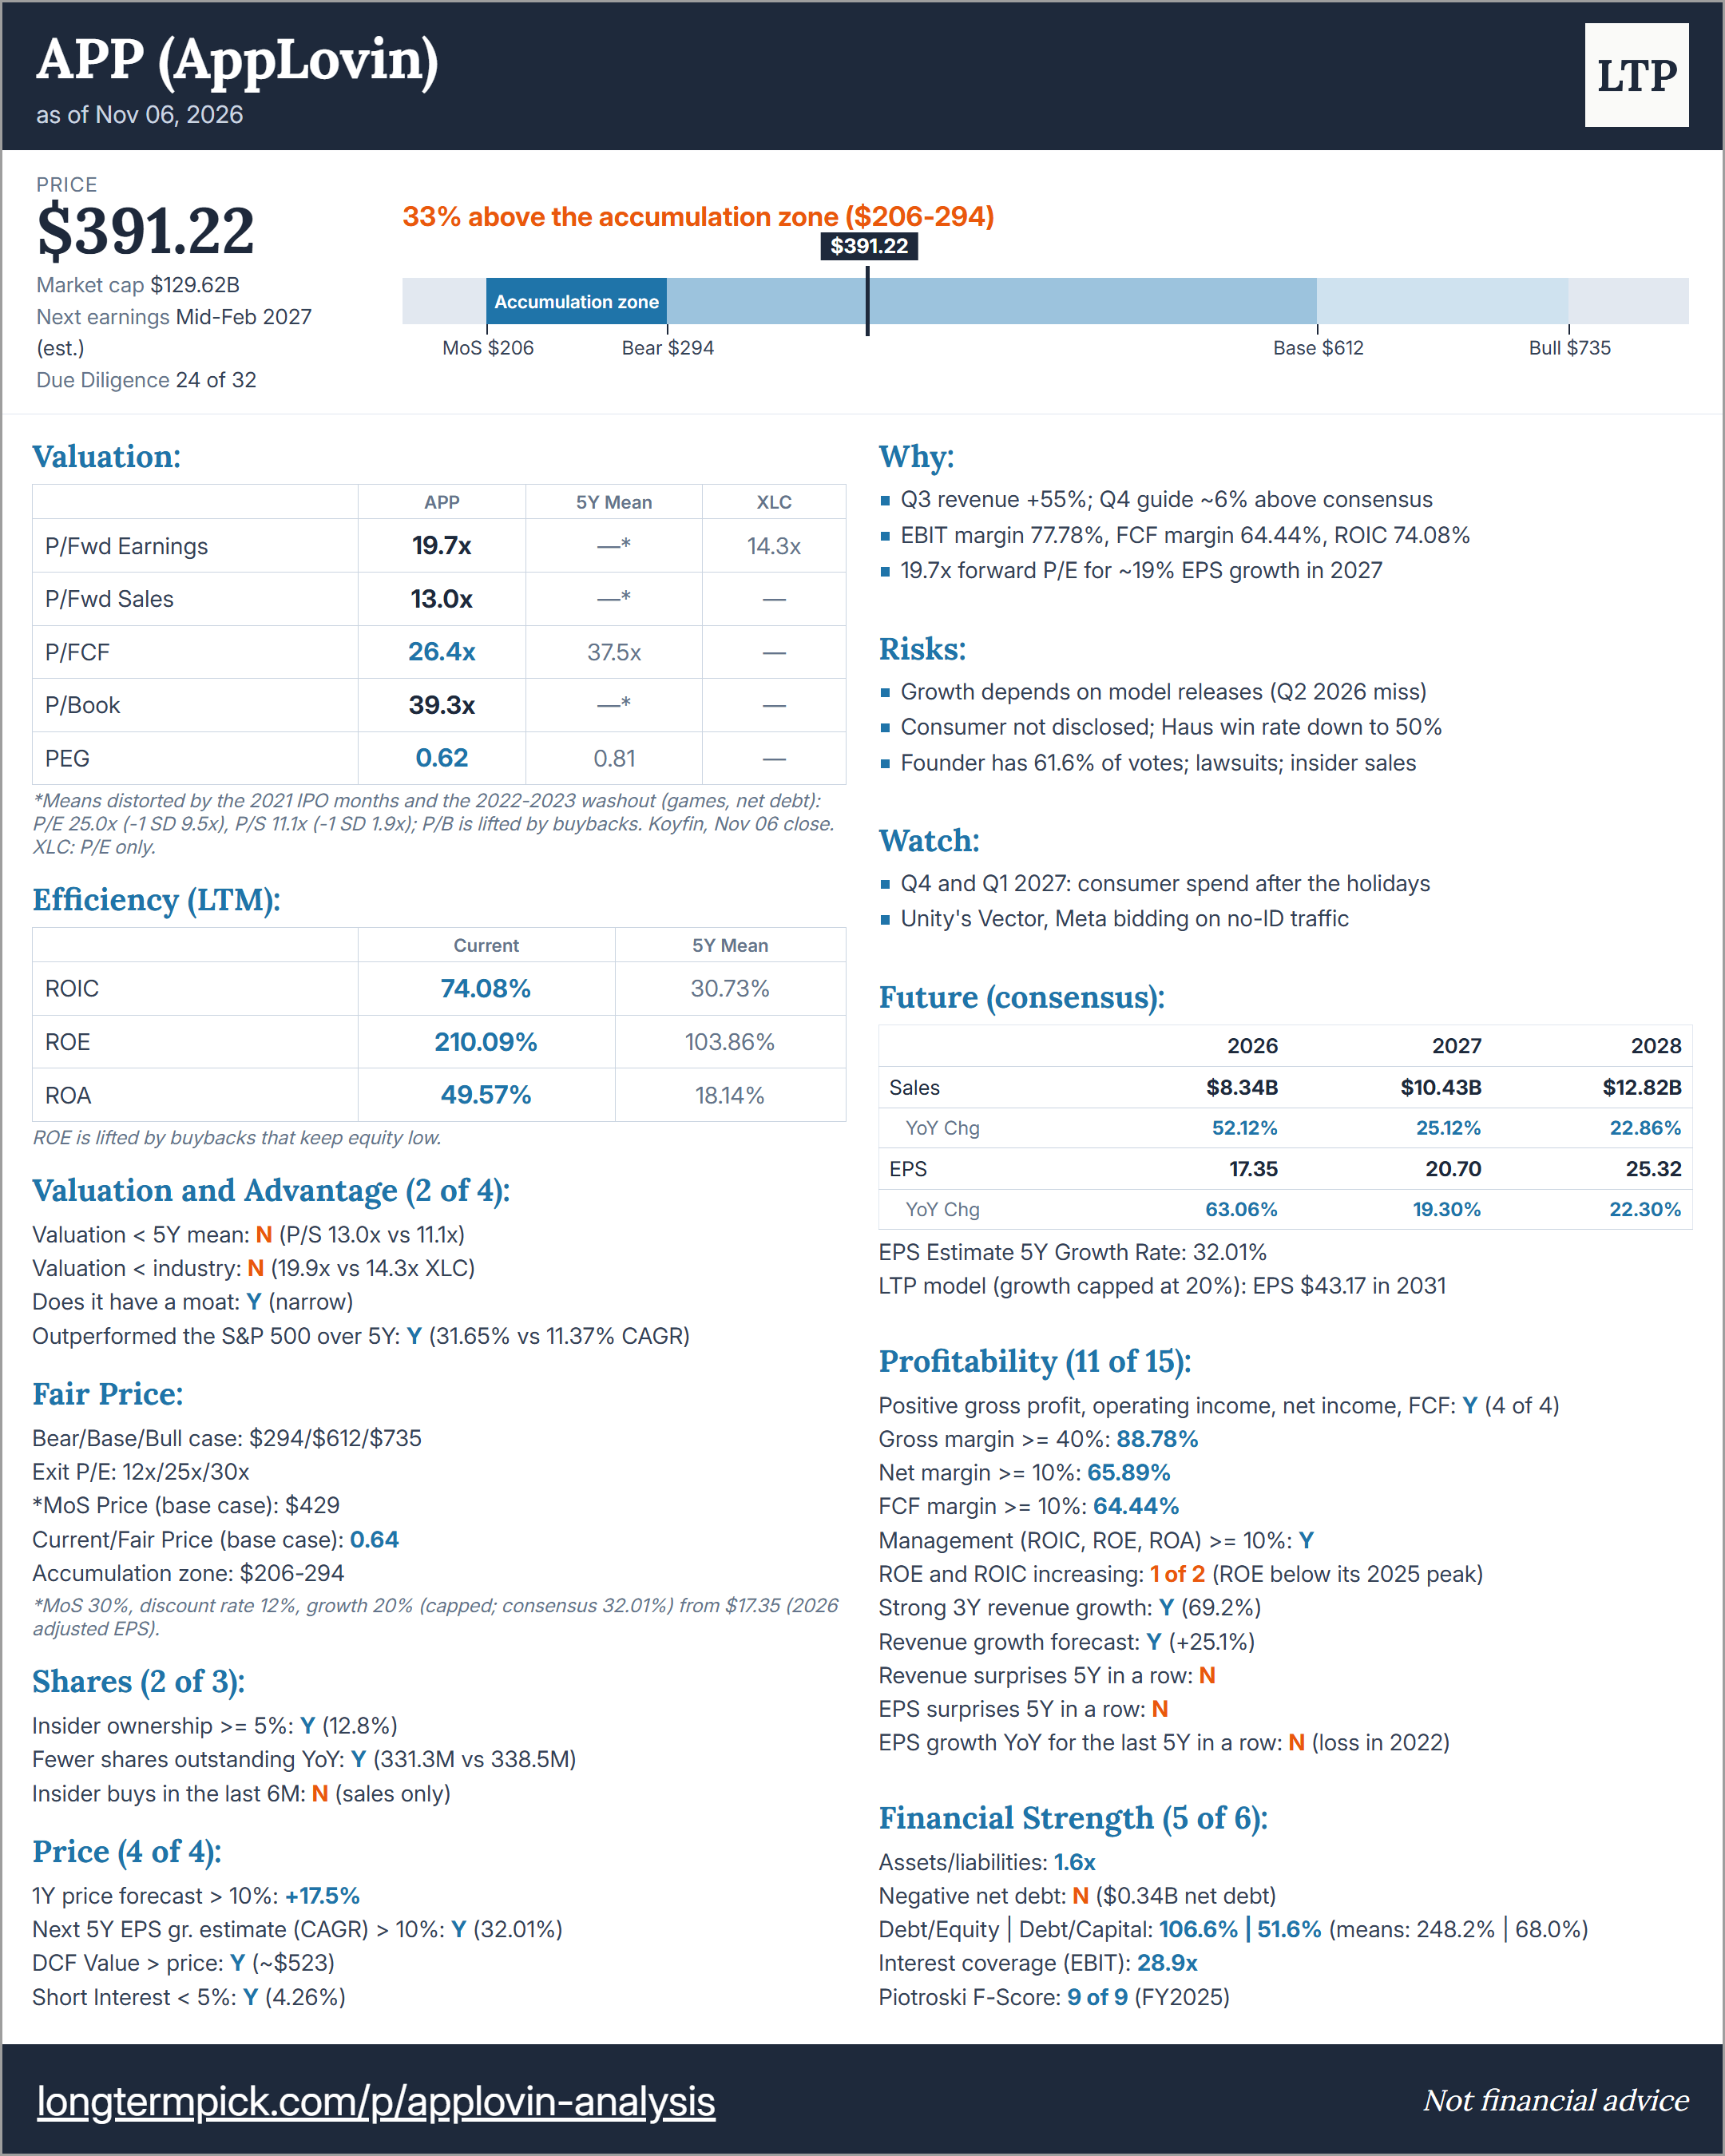
This is not a financial or investing recommendation. It is solely for educational purposes.