

TL;DR: This is the monthly recheck of my watchlist, as of October 09, 2026. All 10 names still pass my screens, so nobody leaves the list. 6 of the 10 are in their buy zones, the same 6 as in Watchlist #001, and every one of them is cheaper than a month ago. At the same time, the consensus EPS for 2026 moved by less than 1% for 8 of the 9 refreshed models, so my fair prices barely moved either. The prices fell, not the estimates. The earnings season starts on Oct 20 with Netflix, so this is the last check on the old numbers.
How this issue works
In Watchlist #001, I promised to recheck these zones in every monthly portfolio issue, starting with Portfolio #003. I did not do it in #003 - it covered only the portfolio. From now on, the two series are separate. Every portfolio issue rechecks the portfolio stocks, and every watchlist issue rechecks all watchlist names. The portfolio comes out at the start of each month, and the watchlist in the middle.
The method is the same as in #001: consensus EPS for 2026, grown for 5 years at the consensus growth rate plus the dividend yield (capped at 20% in total), multiplied by three exit P/E multiples and discounted at 12% a year. Fair price = the Base Case. Buy zone = the Bear Case fair price. The model sheets have a new design, in the same style as my other charts: the consensus, the inputs, the three cases, and the model path to 2031 in one image. All changes below are against the numbers in the #001 entries.
The screens are rerun each month too. A name leaves the list in only two cases: I buy it, or a quality test breaks. A name that drops out of a screen only because its price increased (the PEG and P/E tests) stays on the list.
Analyst’s note:
The exit multiples are the same as in #001. I do not lower the Bear Case multiple between reports. If I did, the buy zone would follow the price down and never be reached. The multiples get reset after the reports, together with the estimates.
NFLX
Next earnings: Oct 20 (confirmed)
Fair price: $122
Buy zone: up to $117
Curr Price/Fair Price: 0.59 (41% undervalued)
PEG: 0.98
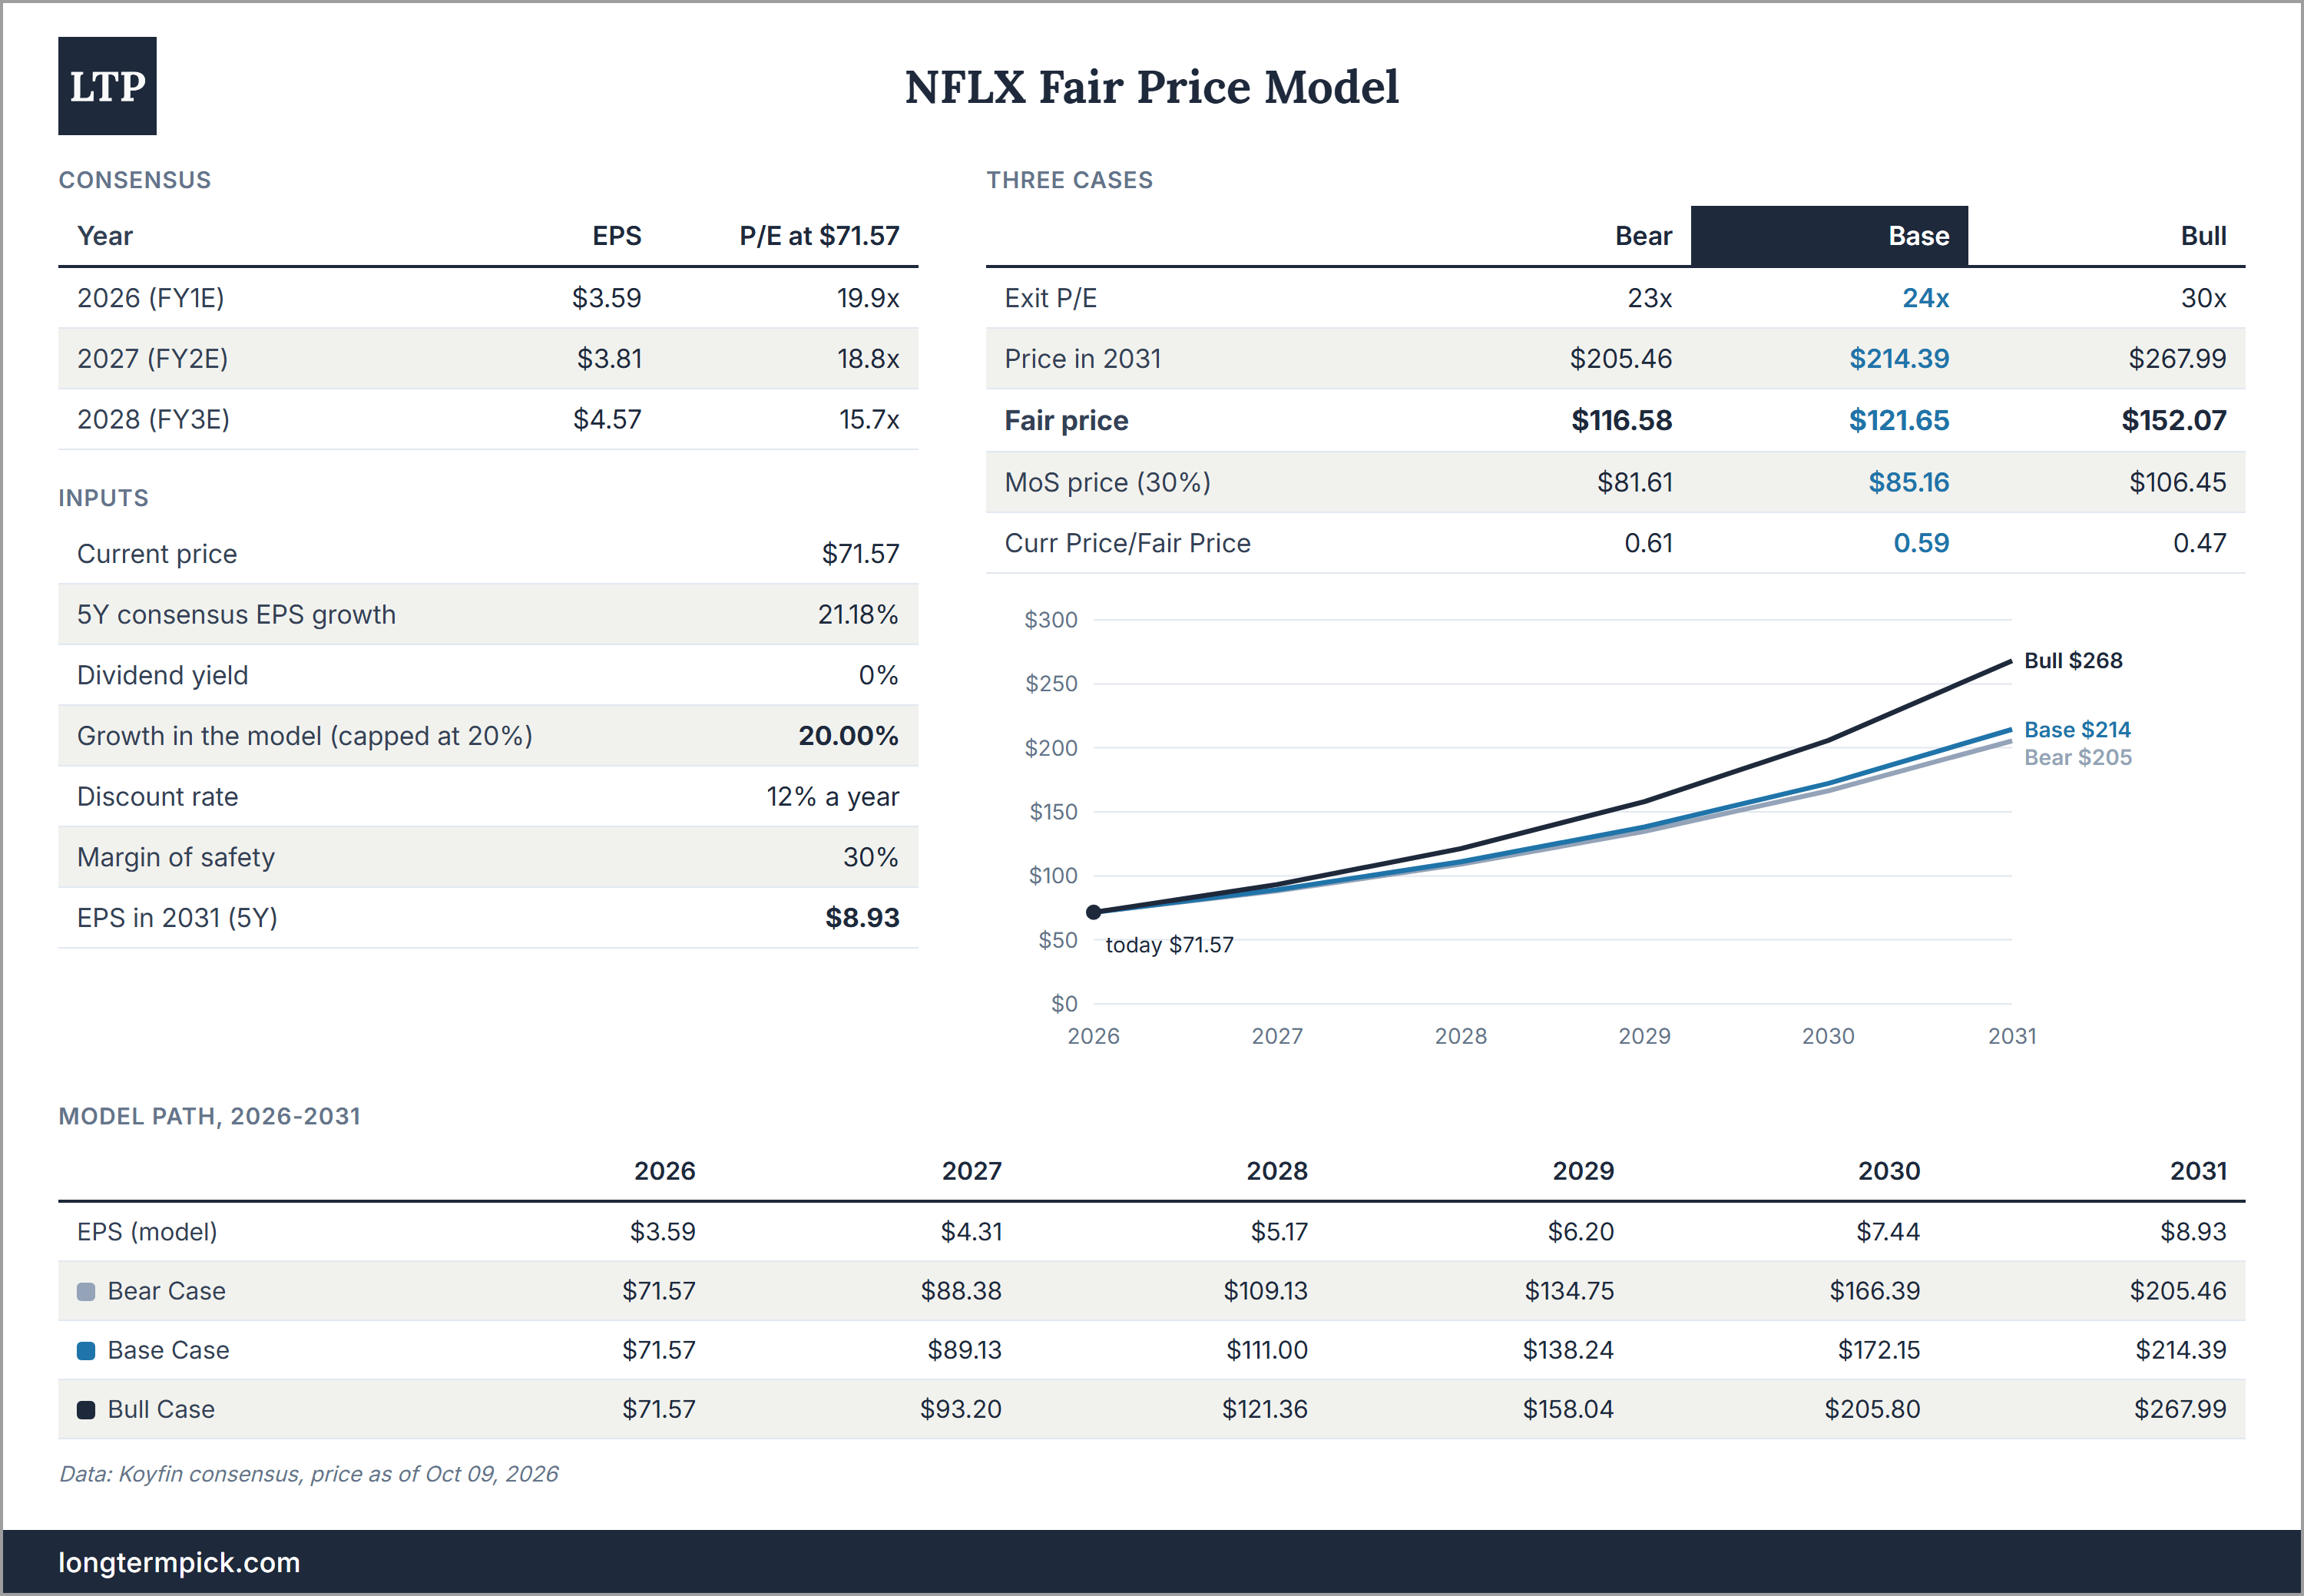
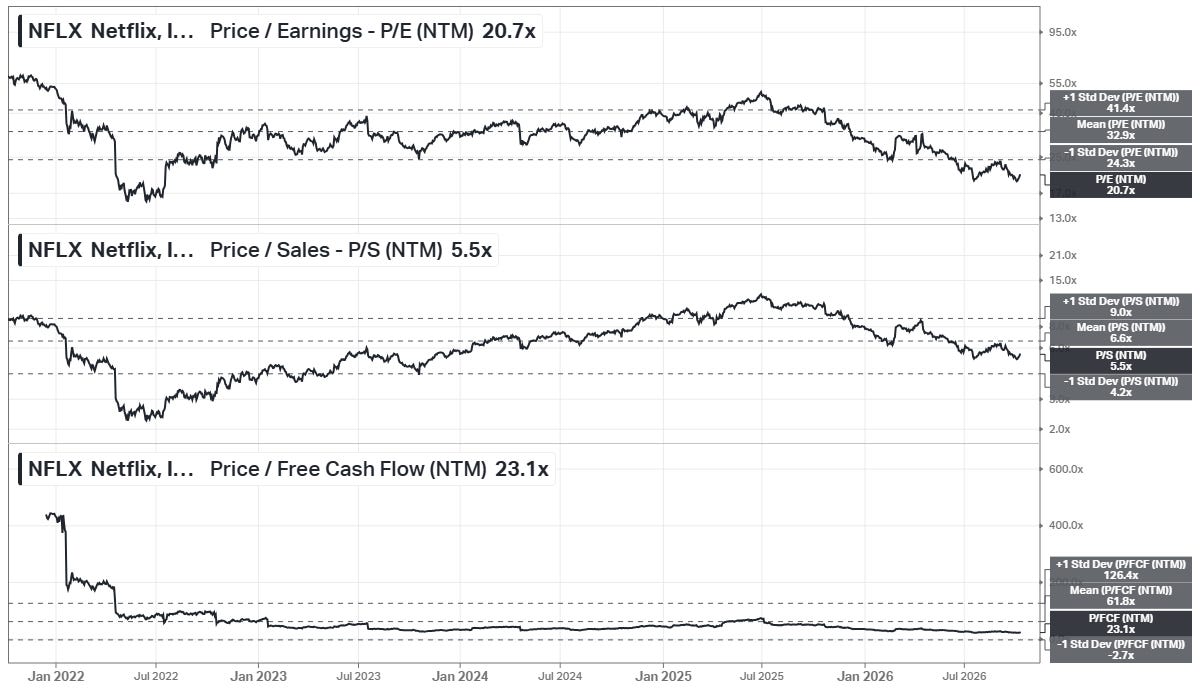
Netflix (NFLX) is the largest paid streaming service in the world. Since Watchlist #001, the stock decreased 13.5%, from $82.73 to $71.57, the largest decrease on the list. At the same time, the consensus EPS for 2026 did not change at all ($3.59), and the 2027 and 2028 estimates moved by 1-2 cents.
So the decrease is the multiple, not the earnings. NFLX is at 20.7x forward earnings, further below its -1 standard deviation band (24.3x) and far below its 32.9x 5Y mean. The exit multiples stay at 23x/24x/30x, and the fair prices did not move: $117/$122/$152. At $71.57, the stock is 39% below the Bear Case fair price, the deepest discount on the list. PEG is 0.98.
What I watch: the Oct 20 report. The 5Y EPS estimate is 21.18%, just above my 20% cap, so the fair prices move only if it falls below 20% or if the 2026 EPS changes. My last full analysis of Netflix was in February, at $77. The updated one, on the Q3 numbers, comes on Oct 27, one week after the report.
Below are the other 9 entries. 5 of them are in their buy zones, and all 5 are cheaper than a month ago. One estimate increased 15% in a month without moving my fair price, and one buy zone may move a lot after the next report for a technical reason. At the end: what the screens found this month, and the whole list in one table.
