

TL;DR: This is the watchlist I promised in Portfolio #002. 10 companies passed the same quality tests as my portfolio stocks. Each entry has Bear/Base/Bull fair prices, the buy zone where the math works without any re-rating, and a note on how I set the exit multiples. 6 of the 10 are in their buy zones right now. Every zone gets rechecked in the monthly portfolio issues.
Why trust these zones
The fair price models here are the same ones I publish in my analyses, so their track record is public. The August 4 Microsoft analysis put the fair price at $567 with the stock at ~$457 - three weeks later, the stock was $514. The July 28 NVIDIA analysis identified an accumulation zone of $181-258 while the market argued about peak AI demand - the stock is $217 today, still inside that zone, and the quarter reported since then showed +106% revenue growth. And the honest side of the same coin: the Reddit analysis identified a $149-213 accumulation range at a $160 price - the stock is $145 now, below the bottom of it. I also bought On Holding inside its zone at ~$38 - the stock is below $28. Zones are not a prediction of the bottom - they mark the price where the math stops needing optimism.
Worth noting that the same screens that feed this watchlist hold 5 of my 9 portfolio stocks today. The list below is not a separate universe - it is the queue my next buys come from.
How names enter and leave this list
A name enters in two steps. The screens find the numbers - the same quality tests my portfolio stocks pass. Then I review the business myself and build the fair price model you see in every entry. A screen finds numbers - it does not find moats. I try to find moats in my detailed analyses.
To be clear about what this list is not: a watchlist entry is not a finished deep dive. The full analysis comes before any buy - that rule stays. A name leaves through two doors only: I buy it, and it moves to the portfolio; or a quality test breaks, and I remove it with the reason stated. A name never leaves for going up in price. A stock that ran away from its zone simply waits in the list. The list holds 15 names at most, because every name has a live fair price model that must be refreshed after every report. The zones get rechecked in every monthly portfolio issue.
Explanations
The method is the one from Portfolio #002: consensus EPS, grown for 5 years at consensus growth plus the dividend yield (capped at 20% in total), multiplied by three exit P/E multiples and discounted at 12% a year. Fair price = the Base Case. Buy zone = the Bear Case fair price.
The exit multiples are never invented numbers. Each one is a real anchor from the stock’s own history: today’s multiple, the -1 standard deviation band, the 5Y mean, or the +1 standard deviation band. The Bear Case is the pessimism that already happened - the lower of today’s multiple and the -1 standard deviation band, so the buy zone assumes no recovery at all. The Base Case is the norm I actually believe - the 5Y mean, unless the mean is poisoned by a bubble or pre-profit years. Then I step down to the next anchor I trust, and I say so in the entry. The Bull Case is the most I would pay myself - and it never exceeds 30x, because at my 20% growth cap, 30x is a PEG of 1.5, the ceiling from the Manifest. When two multiples land next to each other, that is not a rounding accident. It is the model saying the derating has already happened, or that the ceiling already binds.
NFLX
Next earnings: Oct 16 (estimated)
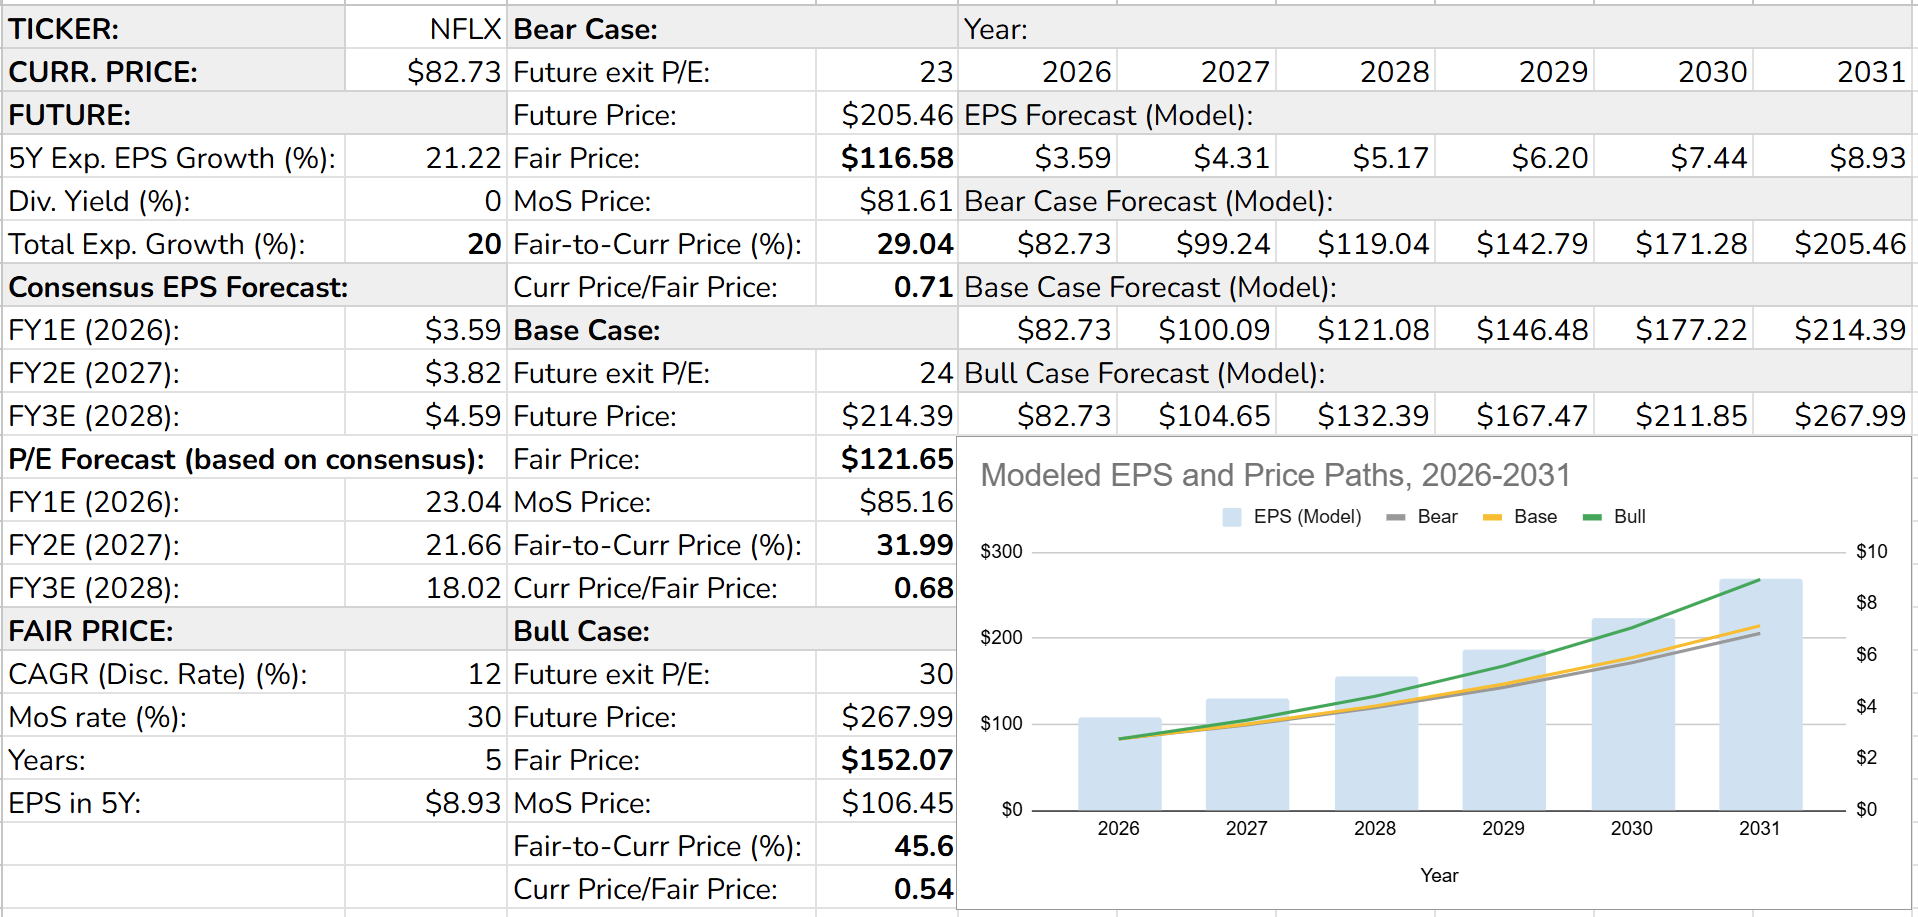
Fair price: $122
Buy zone: up to $117
Curr Price/Fair Price: 0.68 (32% undervalued)
PEG: 1.10
Netflix (NFLX) is the largest paid streaming service in the world, with 325 million subscribers and the biggest TV entertainment audience both in the US and internationally. The model is on-demand series, films, and documentaries, without regular live or sports. The advantage is economies of scale - one content budget spreads over a base no competitor matches. And since 2022, advertising has grown as a second revenue stream, and the company expects it to roughly double this year.
The stock fell 33% over the last year while consensus still expects ~21% EPS growth over the next 5 years. NFLX is at 23.3x forward earnings - below its -1 standard deviation band (24.6x) and far below its 33.6x 5Y mean. My exit multiples are 23x/24x/30x: today’s multiple, the -1 standard deviation band, and my 30x bull ceiling. At $83, the stock is 29% below the Bear Case fair price - the scenario where the multiple never recovers at all.
What I watch: the 5Y EPS estimate. It already came down from a 25.7% mean to 21.2%; my model caps growth at 20% anyway, so the fair prices move only if the estimate falls below that.
Analyst’s note:
Netflix’s 5Y mean P/E of 33.6x includes the 2021 period at 55-60x forward earnings. In my view, that mean is inflated, so the model does not use it. The Base Case takes the -1 standard deviation band instead, and the Bull Case is capped at 30x - at my 20% growth cap, that is a PEG of 1.5, the most I allow myself to pay for any stock.
Below is the list of the other 9 entries. 5 of them are in their buy zones right now. The cheapest one trades at a PEG of 0.37, the deepest fell 56% in a year, and one is on the list precisely because I refuse to buy it at today’s price. Each entry has the fair price model, the buy zone, and the one thing that would change my mind. At the end - the whole list in one comparison table.
