

TL;DR: HubSpot (HUBS) sells customer relationship management (CRM) software to small and mid-sized businesses: marketing, sales, and service tools on one customer database. The Q3 2026 report was good, but the guidance was weak: Q4 revenue +12%, after +17% in Q3. Then, on Nov 12, co-founder Brian Halligan came back as CEO to lead what he calls “a refounding”. At the same time, HUBS trades at 13.5x forward earnings, a low price for the ~23% EPS growth that consensus expects in 2027. As I see it, the market prices HUBS as a business whose growth keeps falling; the numbers show slower growth, but also rising margins and large buybacks. At $216.72, HUBS is inside my accumulation zone of $175-250. But the zone holds only if EPS keeps growing close to 20% a year. So I want to see the 2027 guide in February before I call the slowdown a bottom; until then, HUBS is a stock to watch.
Investment Thesis
Since its November 2021 high of $852, HUBS has lost three quarters of its value; most of that fall is the multiple. This year, the biggest drop came before HubSpot reported any slowdown. From Dec 31 to Feb 11, the day of the Q4 report, HUBS lost 48% ($401 to $209), together with the whole software sector (the IGV software ETF fell 21%). Since that report, the company raised its 2026 EPS guidance from ~$12.4 to ~$13.6, while HUBS is only ~4% above its Feb 11 close. Actually, the revenue guidance did not rise (~$3.7B then and now); the EPS raise came from margins and a ~3% lower share count in the full-year guidance. My question is whether the market sees a structural problem that earnings do not show yet, or whether it simply stopped paying for a growth company that is now a value one.
Revenue still grows double digits, but it is slowing. Q3 revenue increased 17% to $947.6M, and the non-GAAP operating margin reached 22.6%. But the Q4 guide is +12%, with revenue flat QoQ; the CFO expects the headwinds to continue into 2027. Net revenue retention (NRR: what existing customers pay now against a year ago) fell from 103% in Q1 to 101% in Q3. Net new customers halved, from 10,752 to 5,258.
At 13.5x, HUBS is priced for less than the ~23% EPS growth that consensus expects for 2027. The Koyfin consensus is $13.62 of EPS for 2026 and $16.79 for 2027. So PEG is ~0.58 on next year’s growth, and ~0.66 on the ~20% annual growth consensus expects through 2028. Worth noting that 2026 looks better than it is: HubSpot lowered its non-GAAP tax rate from 20% to 15%, so like-for-like, 2026 EPS grows ~32%, not the ~40% the reported numbers show. The 23% for 2027 has no tax effect, since both years use the 15% rate, but ~3 points of it come from buybacks already made.
The business became profitable, but SBC still takes most of the cash. Over the LTM, the gross margin was 83.02%, the FCF margin 23.49% on Koyfin (20.0% after capitalized software), and GAAP net income reached $213M. At the same time, SBC was $504M LTM, 14.04% of revenue; after that, only ~$215M of HubSpot’s $719M FCF remains. ROIC is 9.02%, positive only since 2025.
The multiple is far below its mean, but the mean says little. HUBS trades at 13.5x against an 87.0x 5Y mean; even the -1 SD band (23.2x) is a level HUBS has not seen since early February. The mean comes from 2021-2024, when revenue grew 21-47% a year, earnings were small, and ~100x was normal. A better reference is the current business: since April, HUBS has traded at ~12-18x.
The bear case is that AI breaks the funnel; my model absorbs it only partly. The company built its business on inbound marketing (people found it through search and content), but AI answers now take that traffic. My Bear Case changes only the multiple: 13x, today’s level, so the market never pays more for HUBS than now. With growth at my 20% cap, HUBS is worth $250, the top of my accumulation zone. Slower growth is the bigger risk. At 15% EPS growth a year, the Bear Case falls to ~$202, below today’s price; at 10%, my realistic bear case, it is ~$162.
Analyst’s note:
The price anchor is $216.72, the Koyfin price at my export on Nov 12, after HUBS increased ~7% on the news of the new CEO; the previous close was $202.88. HubSpot reports non-GAAP EPS, and the Koyfin consensus uses the same basis. From 2026, the company uses a 15% long-term tax rate for its non-GAAP numbers (it was 20%), but its releases compare 2026 with the old 2025 numbers. Where I give growth, I compare it with 2025 restated at 15% (HUBS published these figures in February). Forward P/E in this post is on NTM EPS of $16.09: 13.5x at my price (Koyfin rounds it to 13.6x, while S&P Global data in the competitors table give 13.4x). The model sheet shows P/E on each fiscal year instead. On the Koyfin charts, the headers show other prices from the same day ($217.88-218.80) and the change over their own periods; the difference from my anchor is under 1%.
Company Overview
Next Earnings Date: Feb 10, 2027 (estimated)
Market Cap: $10.58B
Sector: Technology | Industry: Application Software
Type: Mid Growth
Short Interest: 8.17%
HubSpot sells software that small and mid-sized companies use to find, sell to, and serve their customers. Halligan and Dharmesh Shah founded it in 2005 around one idea: inbound marketing, where customers find a business through useful content and search, instead of cold calls. Today, its target customers have 2 to 2,000 employees; 49% of revenue comes from outside the US. The platform has one customer database, the Smart CRM, and several “hubs” on top of it:
Marketing Hub: email, social, ads, landing pages, and automation;
Sales Hub: pipelines, sequences, and deal tracking;
Service Hub: tickets, help desk, and a customer AI agent;
Content Hub, Data Hub, and Commerce Hub: a website builder, data tools, and payments.
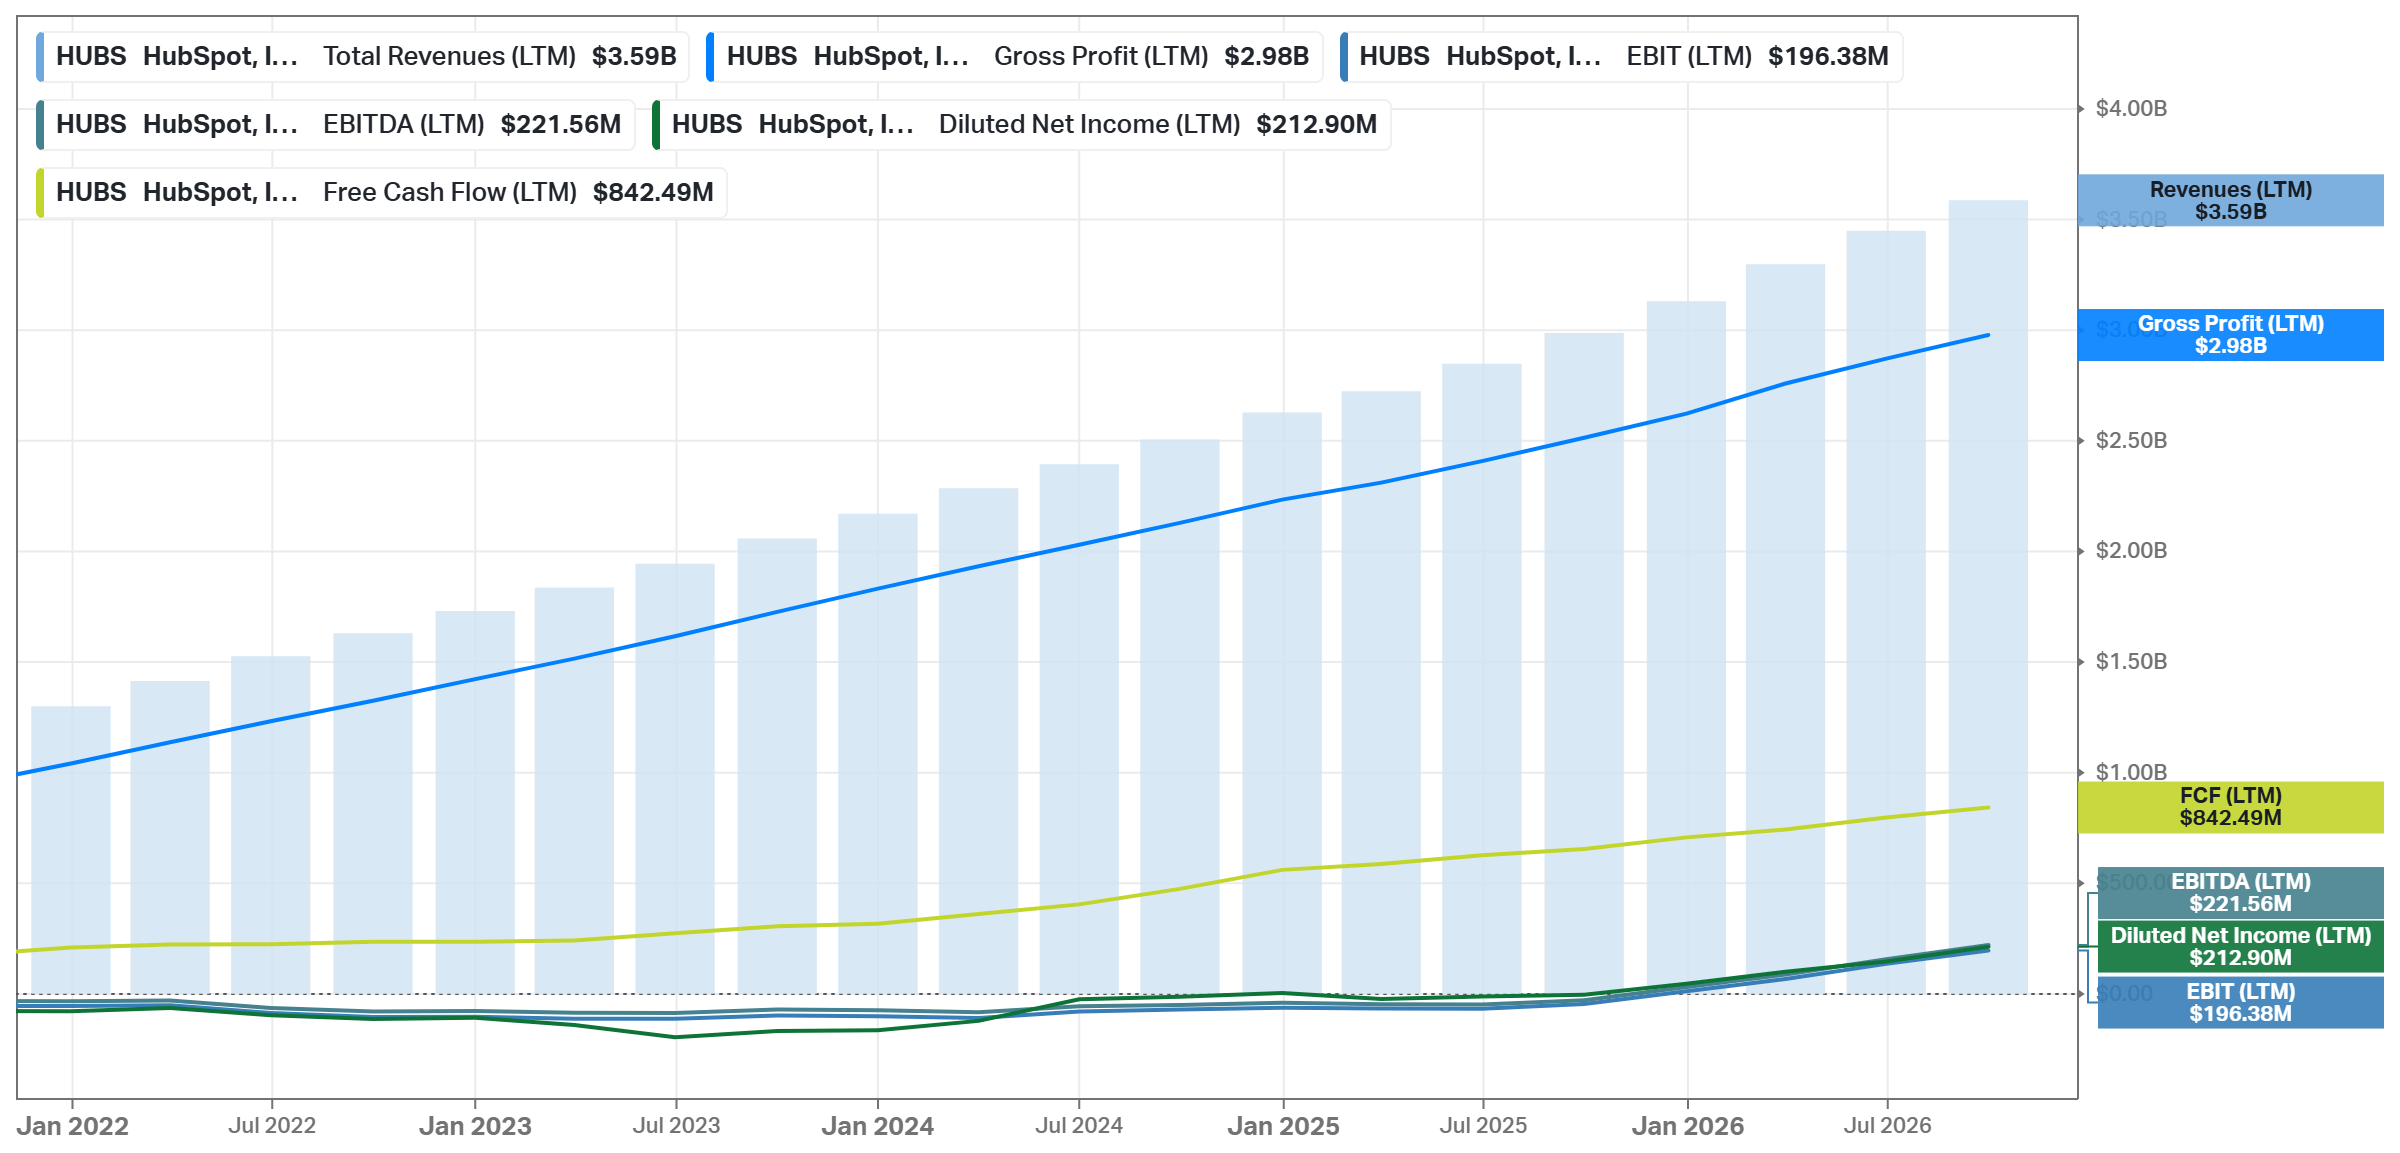
The business model is subscriptions (98% of revenue is subscriptions), sold from free to Enterprise. A customer starts with free tools, buys a Starter edition, and then upgrades to Professional or Enterprise as it grows. In 2024, HubSpot lowered seat prices and added cheap “core seats”. Since then, the number of paid seats has increased ~80%, according to the CFO at the September Analyst Day. Beyond seats, customers now buy “credits” for AI agents and data. The average customer pays $12,038 a year.
Management changed on Nov 12. That day, the company announced that Yamini Rangan, the CEO since 2021, stepped down, and Brian Halligan returned as CEO. Halligan led HubSpot from 2005 to 2021 and then stayed on as Executive Chair and later as a director. In his words, “This is a refounding”, with a plan to “reimagine HubSpot from the ground up” in product, go-to-market, and culture. The CFO, Kate Bueker, also retires on Feb 11, 2027; Karen Burgess, the CFO of Adobe’s Creativity & Productivity business, replaces her. The company gave no reason for Rangan’s departure and reaffirmed its Q4 and 2026 guidance. With the Chief Legal Officer resigning in October (effective Nov 06), 3 top officers leave between Nov 06 and Feb 11.
Whether Halligan stops selling his shares now is one signal I watch. In 2026, he sold 8,500 shares a month under 10b5-1 plans (sales schedules set in advance), ~$20M from January to October. He owns under 1% of HubSpot. The other co-founder, CTO Dharmesh Shah, did the opposite: he bought ~$1.8M of stock at $181 in May.
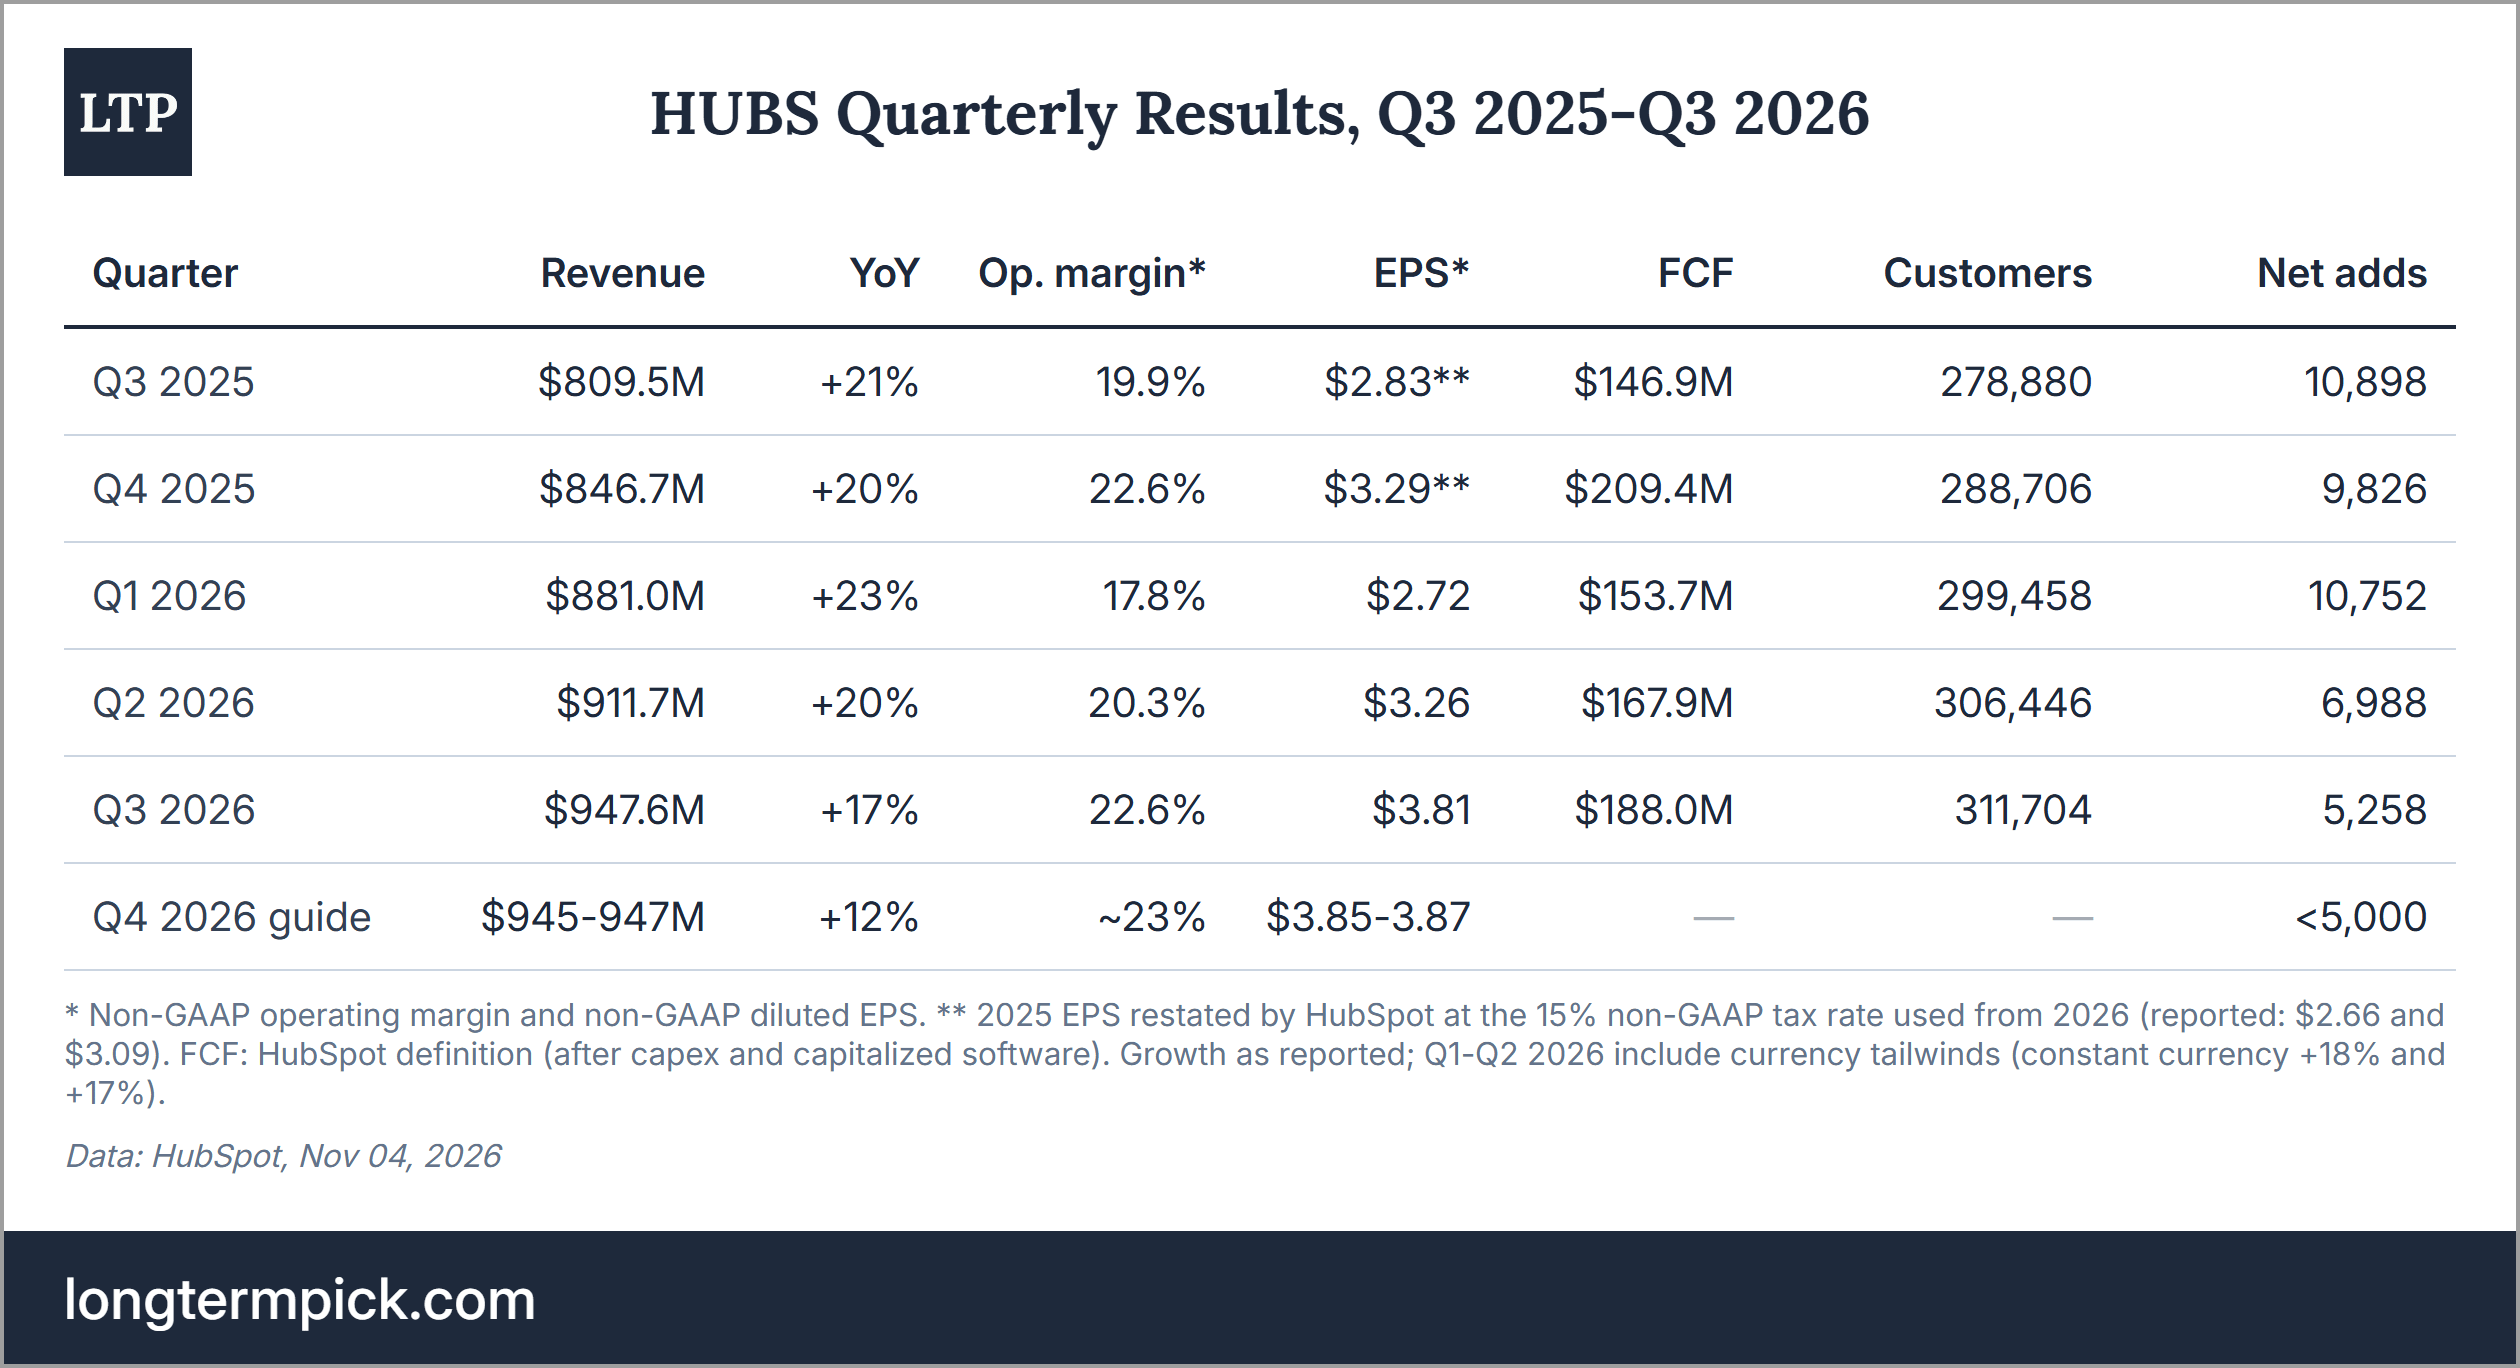
The table shows the whole story of 2026. Revenue growth slowed from +23% to a guided +12%, but EPS reached a record $3.81 in Q3, with an operating margin of 22.6%, the same as in Q4 2025. Without currency effects, growth was steady at 17-18% for 3 quarters; the real drop comes in Q4, to +12%. Net new customers halved in 2 quarters.
Market Overview
CRM is the largest market in business software, and it still grows double digits. Gartner sized it at $149.1B in 2025 and forecasts 13.8% annually through 2030, according to its September 2026 forecast. Under IDC’s broader definition, Salesforce has 20.0% in 2025, according to IDC data; no other vendor has more than ~4%. HubSpot’s 2025 revenue of $3.13B is ~2% of Gartner’s market, by my calculation. So the market is fragmented. HubSpot competes mostly for small and mid-sized companies, where the alternatives are Salesforce’s small business suites, Zoho, Freshworks, monday.com, and spreadsheets.
The specific problem is how customers find HubSpot. For 20 years, the company grew on search and content: a business owner searched a question, read a HubSpot blog post, and signed up for the free CRM. AI answers now take a part of that path. In February, Rangan said that “Search traffic is declining as AI-generated answers become the starting point” (Q4 2025 call). Data outside HUBS shows the same trend. In a Pew study from July 2025, users clicked a search result on 8% of visits with an AI summary, against 15% without one.
The second problem is how customers buy. On the Q3 call, Rangan described two trends. Customers want to see AI work on their own data before they pay, so HubSpot introduced free trials; agent trials grew 64% QoQ, but they convert slowly. And budgets are tighter: small customers see AI as “a new line item”, so they cut other software. The same weakness shows up at monday.com, whose CFO said on its Q3 call that small business customer additions were lower and churn higher. As I see it, this is an industry problem in small-business software, not just a HubSpot one.
What AI has not done yet is cut seats. I found no source that shows CRM seat counts falling. At the company, active core seats grew 34% YoY in Q3, and customers who connect HubSpot to ChatGPT or Claude upgrade paid seats at 3x the rate of others. So far, the damage is fewer new customers and fewer upgrades, which looks more like a demand and discovery problem than a product replacement.
Want to see what I actually do with analyses like this one? Since 2021, I have managed a real portfolio, the LTP Portfolio, and a watchlist of companies I want to own at the right price. Paid subscribers follow it like a reality show. Every month, they see my trades, the reasons behind them, and how they perform against the market. The watchlist shows which companies are in their buy zones. The rules I follow are in my Portfolio Manifest, and the latest issue is Portfolio #004. To follow it from the inside, become a paid subscriber.
Economic Moat
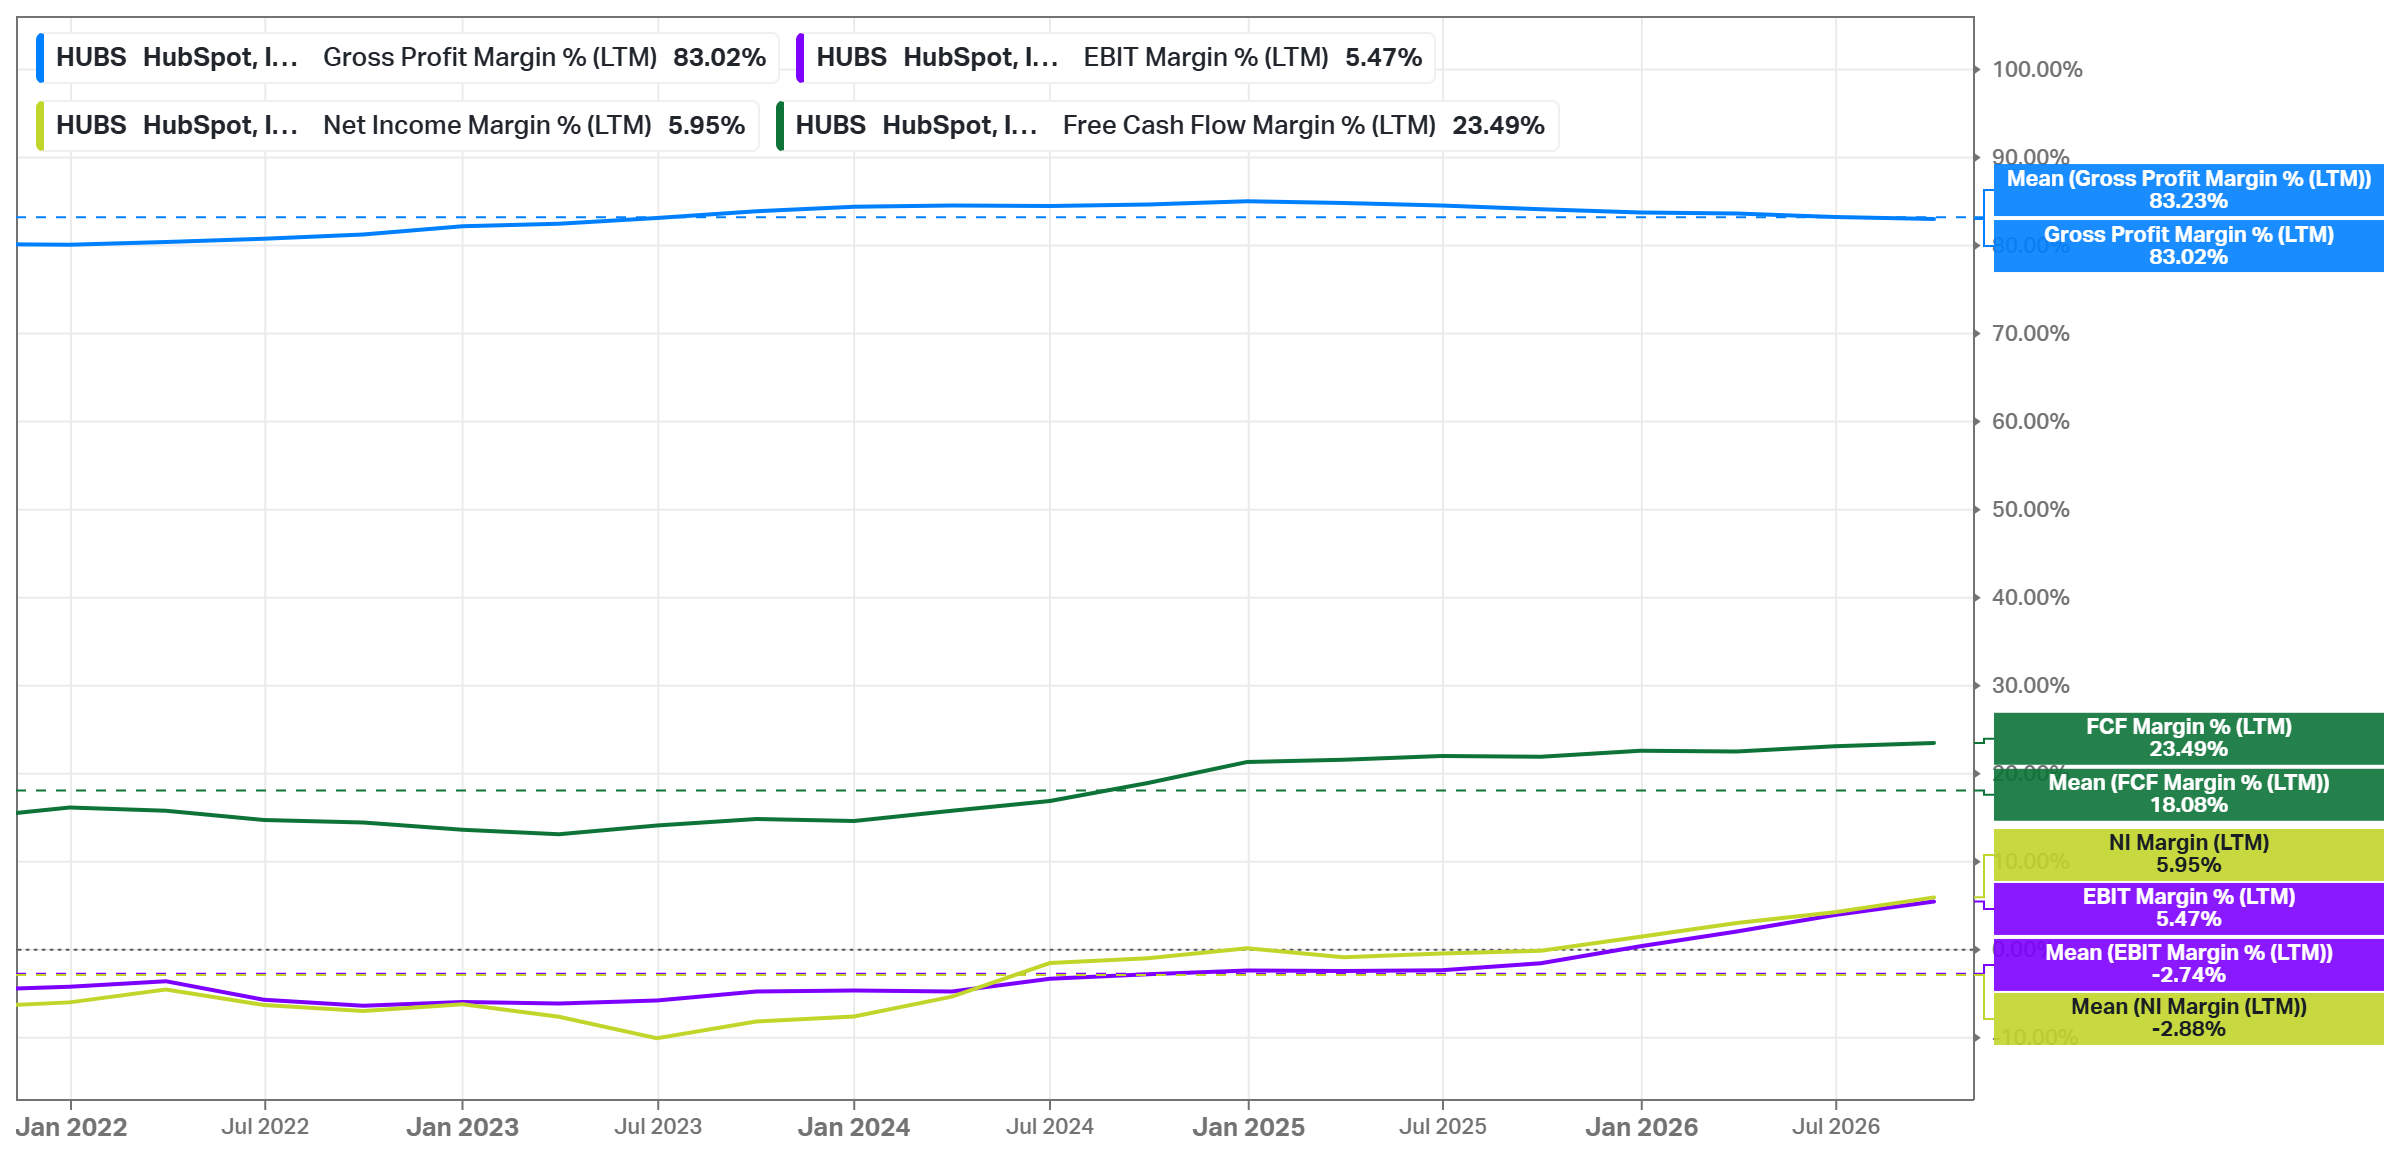
The moat is the customer database, and it is narrow. A CRM holds a company’s contacts, deals, emails, and support history. Moving it to another vendor means migrating data and retraining the team, so customers rarely leave once the CRM is in daily use. The evidence for this is in the economics: an 83.02% gross margin, stable over 5 years, and gross revenue retention in the “high 80s”, stable through 2026 even as new sales slowed. Actually, the margin is starting to decline: the non-GAAP subscription gross margin fell from 86.7% to 85.4% YoY in Q3. At the Analyst Day, the CFO also said that cost of revenue will grow faster than revenue in 2027 because of AI. Retention has its limits too; high 80s means that ~11-13% of revenue leaves every year, mostly from the smallest customers. So this is a real switching cost, but not a deep one.
The platform is HubSpot’s real advantage. 62% of new Pro+ customers (Professional and Enterprise editions) start with more than one hub, and deals above $120,000 grew 19% YoY in Q3. One database for marketing, sales, and service is exactly what AI agents need: they work only with clean customer data. HubSpot is also the most popular CRM connector in ChatGPT and Claude, according to the company. In Q3, customers created 22 million CRM records through these connectors, +157% QoQ.
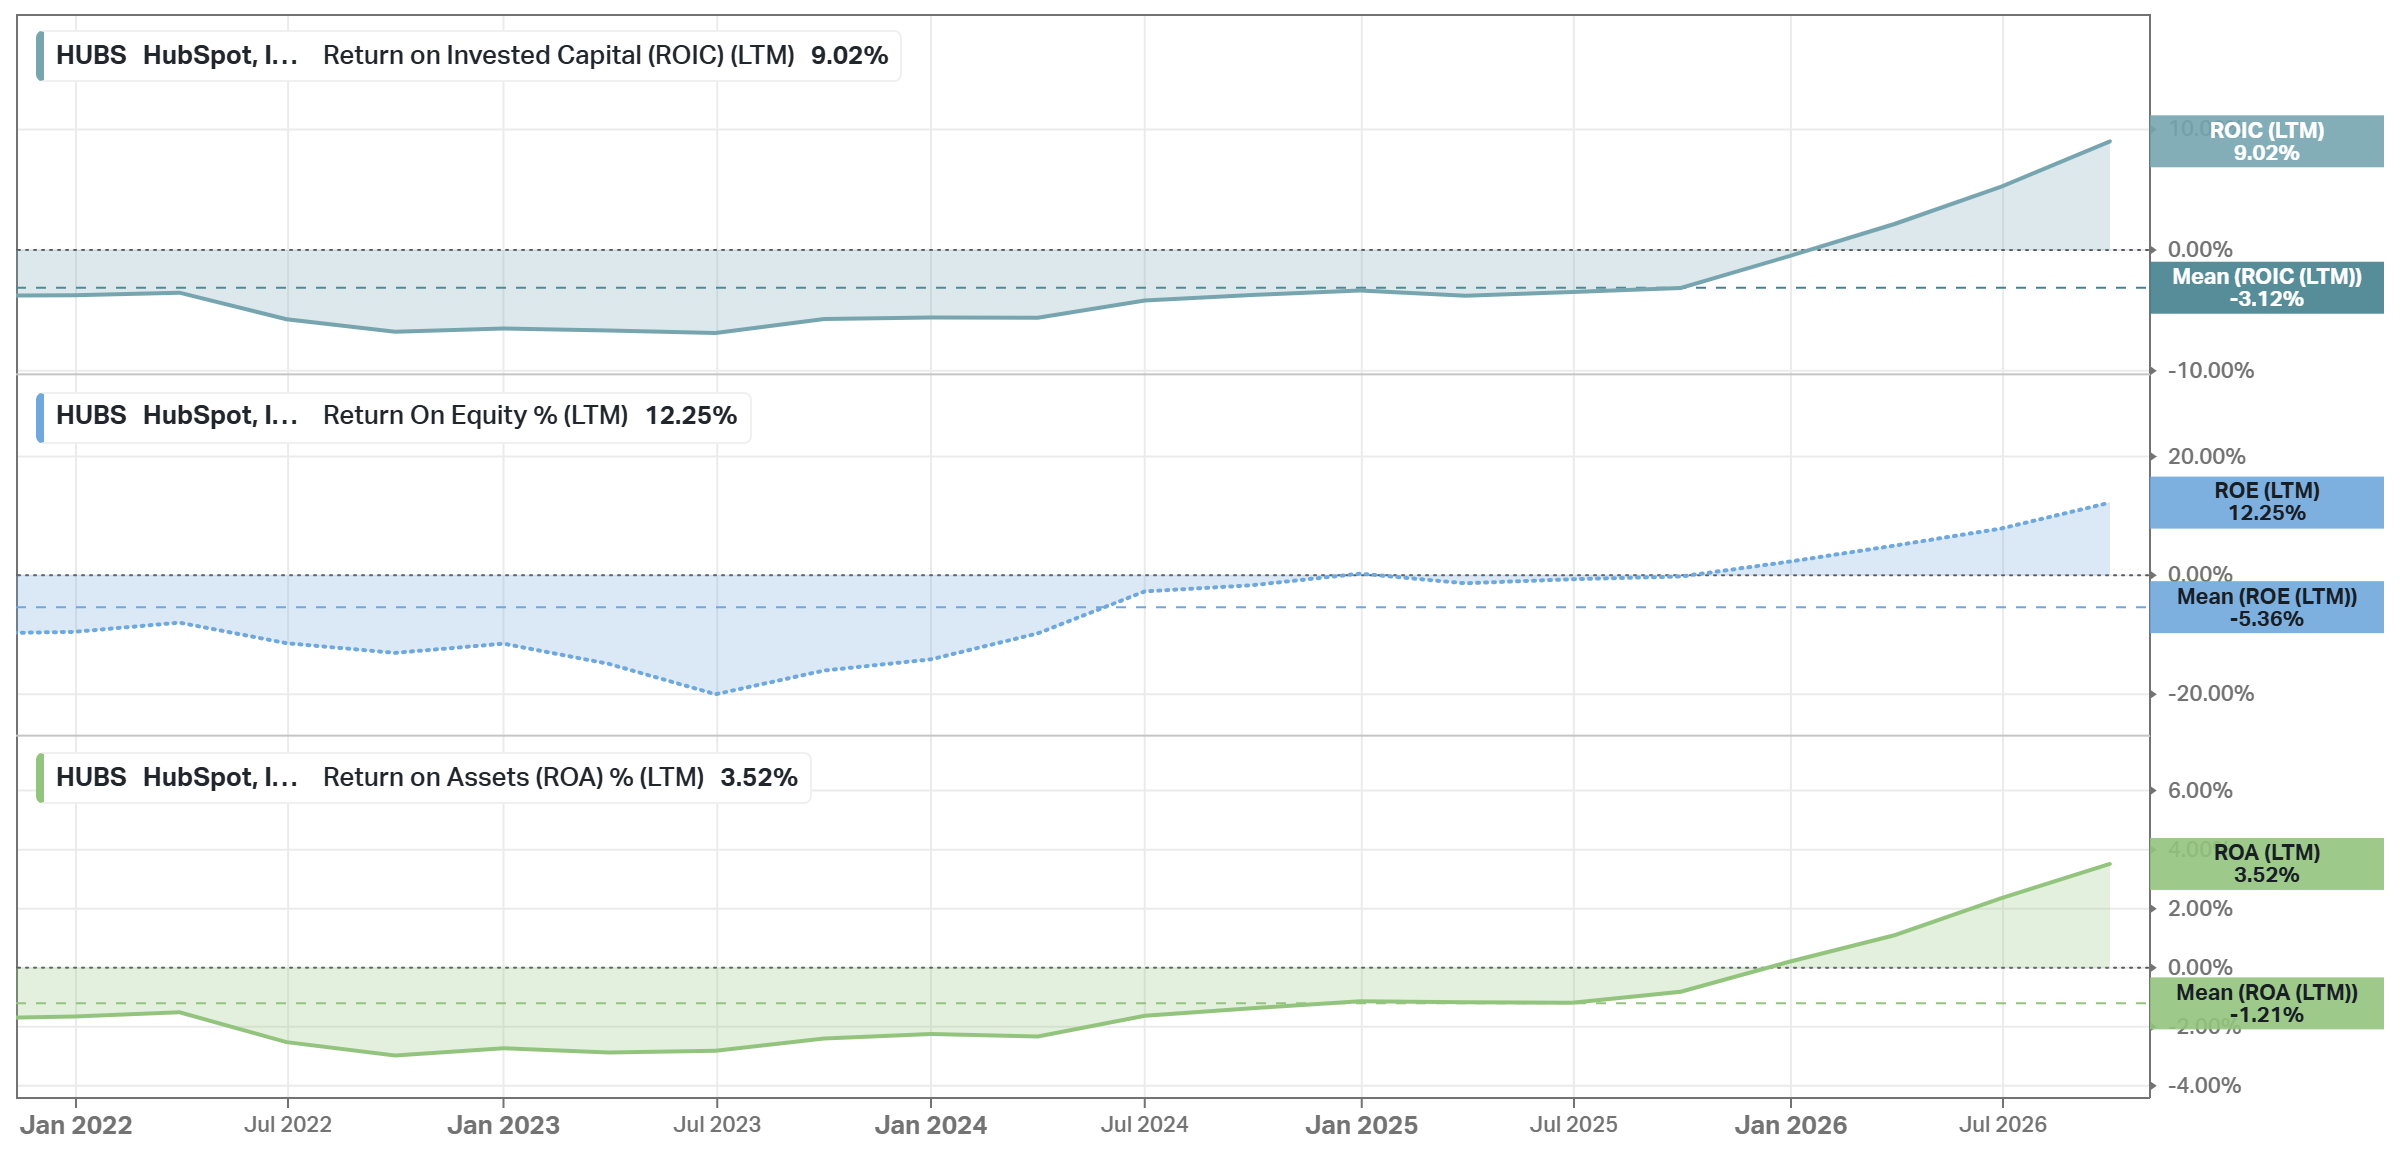
The returns do not prove the moat yet. ROIC turned positive only in late 2025 and is 9.02% now; the 5Y mean is -3.12%. Part of the reason is SBC: HubSpot paid its people $504M in stock over the LTM, more than twice its GAAP net income. In my view, the moat is real in the product but still weak in the numbers. A business with a strong moat earns well above its cost of capital; the company is not there yet.
Business Strategy
From tools to agents. The company now calls itself an “agentic customer platform”. It has about eight AI agents for prospecting, customer support, content, and data, plus the Breeze Assistant, which builds workflows and reports on request. In Q3, 20% of Pro+ customers used HubSpot agents, up 11 points since January, and monthly credit consumption increased ~2.5x. The Customer Agent alone resolved over 2 million support tickets in the quarter.
Seats plus credits. In Q2, HubSpot started a pricing pilot in the Nordics and Benelux: one seat for all hubs (a “go-to-market seat”) instead of separate hubs, a smaller price jump from Starter to Pro, and all AI use paid in credits. Average deal prices went down, but the number of Pro+ customers increased. Credit use was also 2-3x higher than outside the pilot. From Q4, all new customers in Europe, the Middle East, and Africa are in the pilot. This is a deliberate trade-off: lower prices now for more customers and AI revenue later. Here, I see a real risk for 2027 revenue if the rollout goes global before the volume shows up.
Headless HubSpot. The company opened its APIs and built connectors, so that agents and chatbots can operate HubSpot without its own screens. This sounds like a threat to the seat model, but so far, the data shows the opposite: connector users have 13 points higher gross revenue retention, according to the company. In my view, part of this is selection: the most engaged customers connect first, so it is not yet proof that agents add seats.
The refounding. Halligan’s plan is not public yet. On the Q3 call on Nov 04, the CFO said HubSpot remains “confident” in its 2027 margin target of 23-24%. The Nov 12 release, 8 days later, reaffirmed only the 2026 guidance; it did not repeat the 2027 target or the 2030 target of 30%. For me, this is the biggest unknown of the thesis. As I see it, a founder who comes back to “reimagine” a company is more likely to invest first and earn later; then the 2027 margin target is at risk, together with the EPS consensus built on it.
Capital Allocation
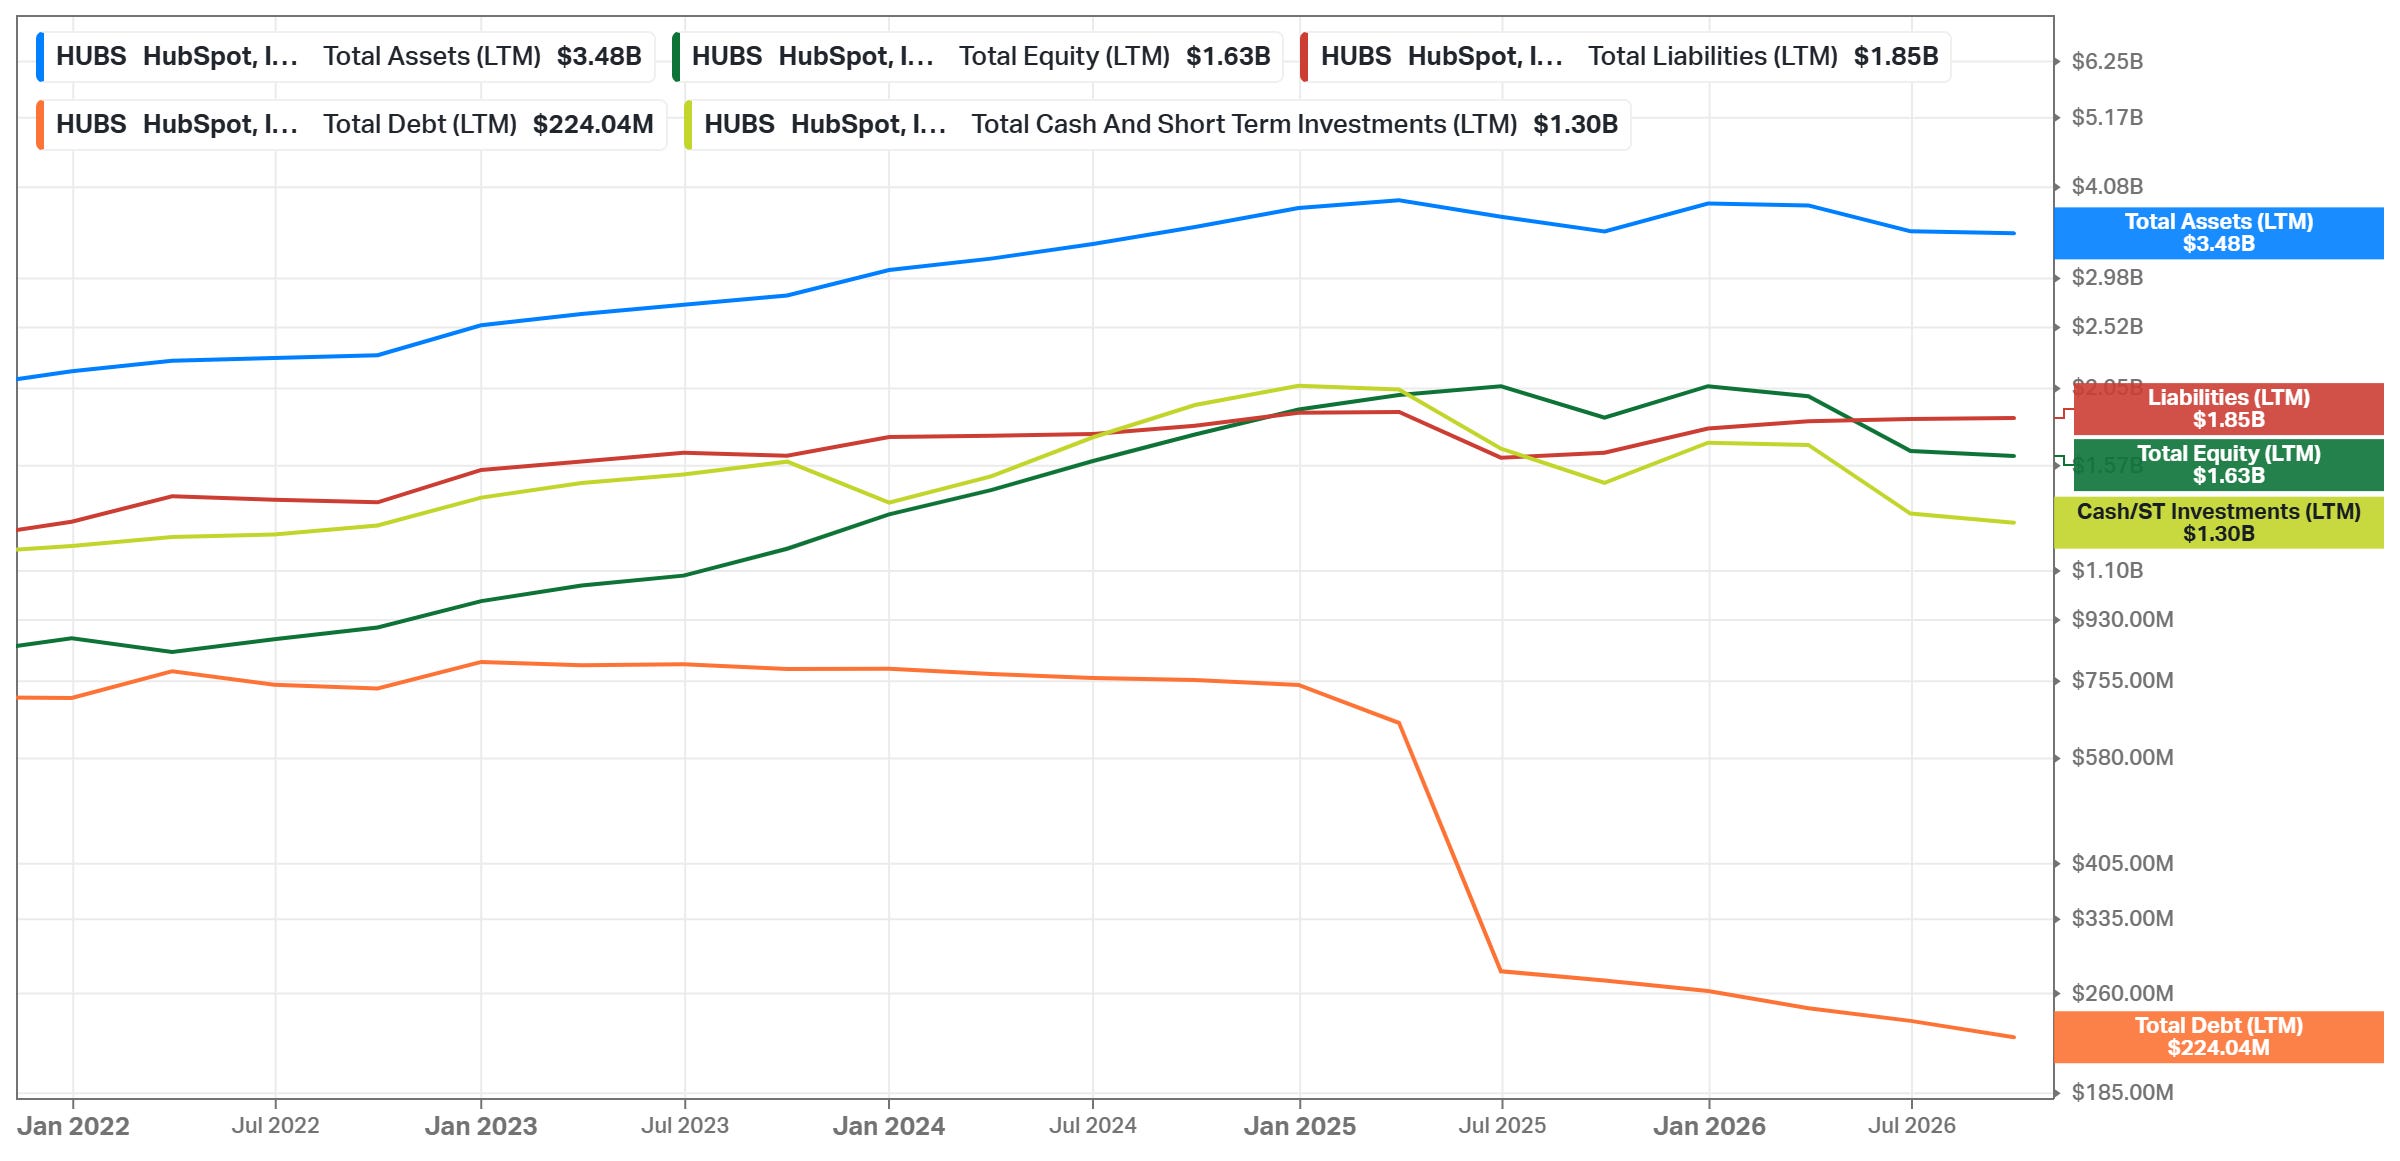
No financial debt, but less cash. HUBS has $1.30B of cash and short-term investments and $224M of total debt, all of it leases, so net cash is ~$1.07B. Cash decreased from $2.22B at the end of 2024 because buybacks and repayment of the convertible notes ($459.8M in 2025) exceeded what the business produced.
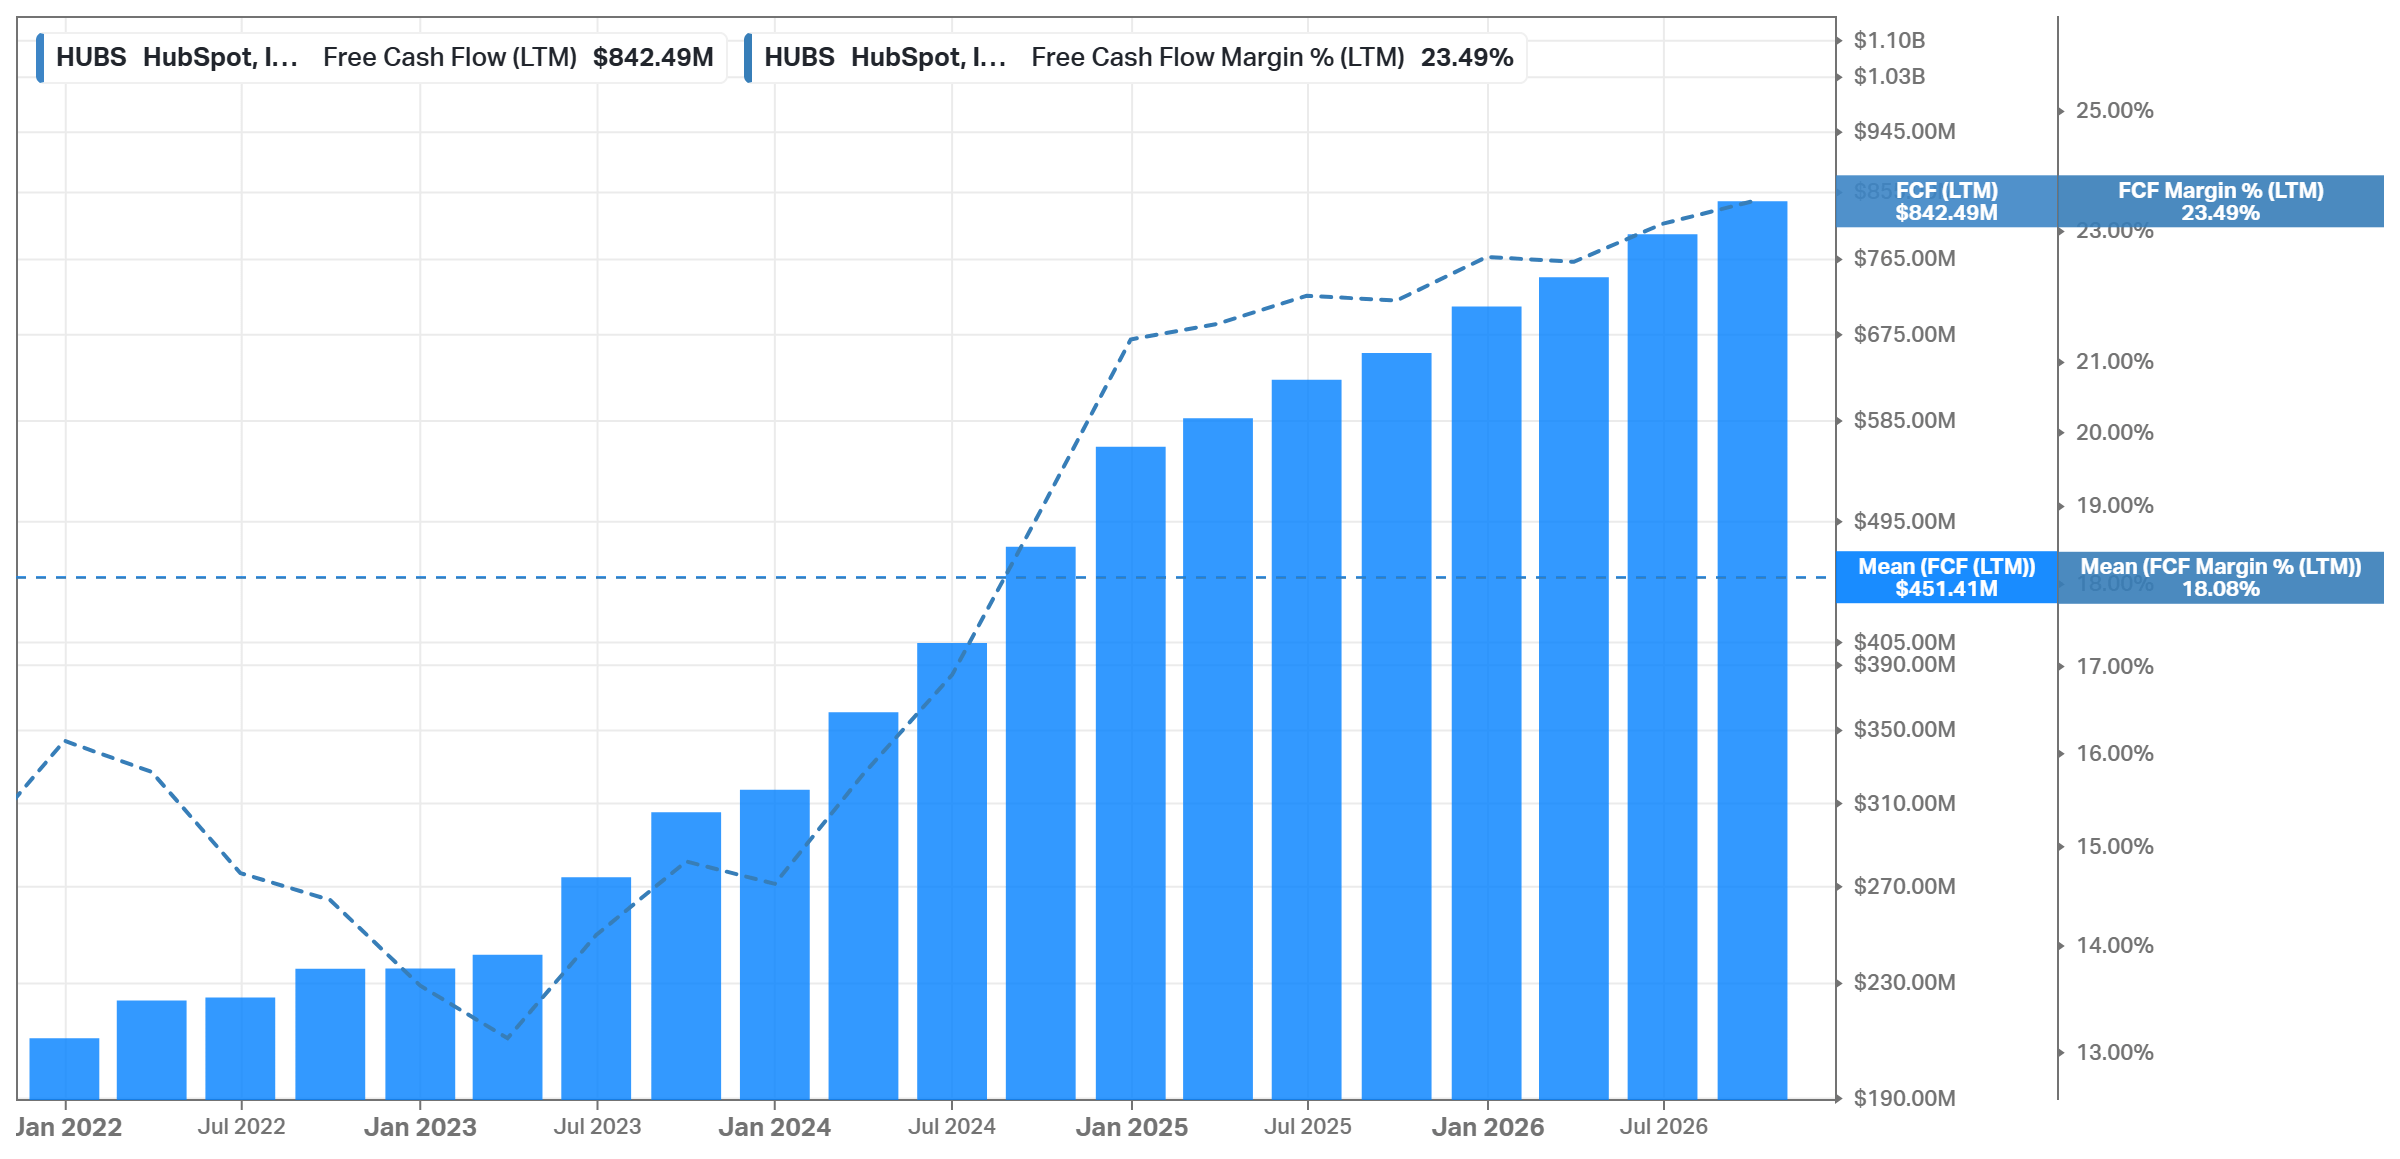
FCF grows, but the definition matters. Koyfin shows $842.49M of LTM FCF, a 23.49% margin. HubSpot’s own number is $719M, because it also deducts capitalized software development ($113M in 9M 2026). For 2026, the company now expects ~$720M of FCF, down from ~$750M in August. Both numbers ignore SBC.
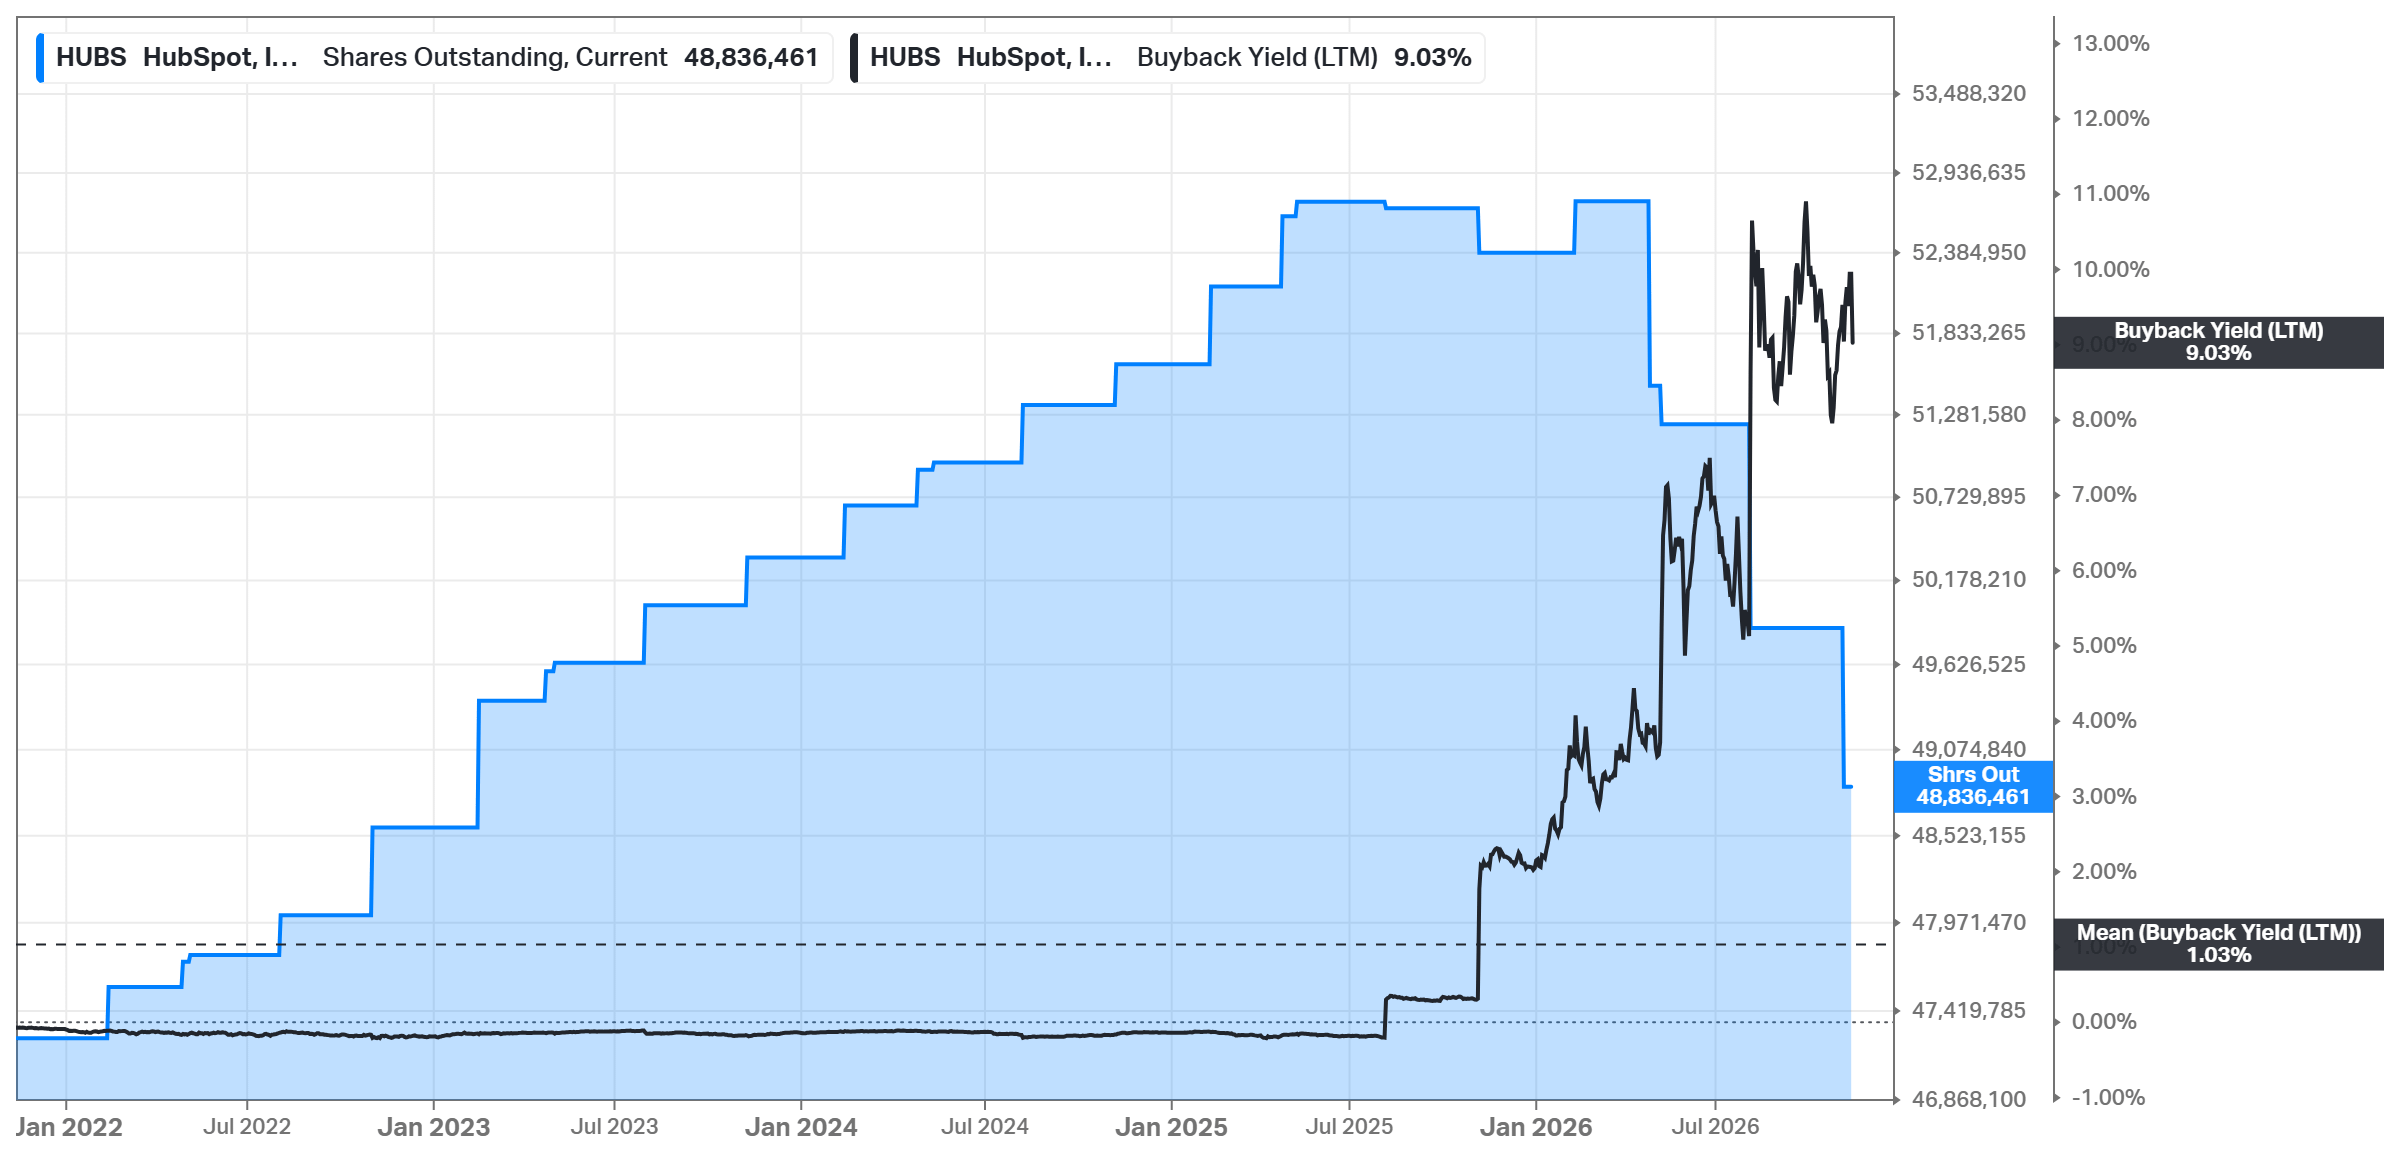
The buybacks came late; the first one was expensive. For years, the share count increased ~2-3% a year from SBC. Then, in 2025, HubSpot spent $500M on 997,000 shares at an average of $501.67, about 2.3x today’s price. In 2026, it bought 4.6M shares for $980M at an average of $213, and the share count fell 7.4% from its February peak. $1.02B was left in the programs at the end of September, ~10% of the market cap. The LTM buyback yield is 9.03%. The company pays no dividend.
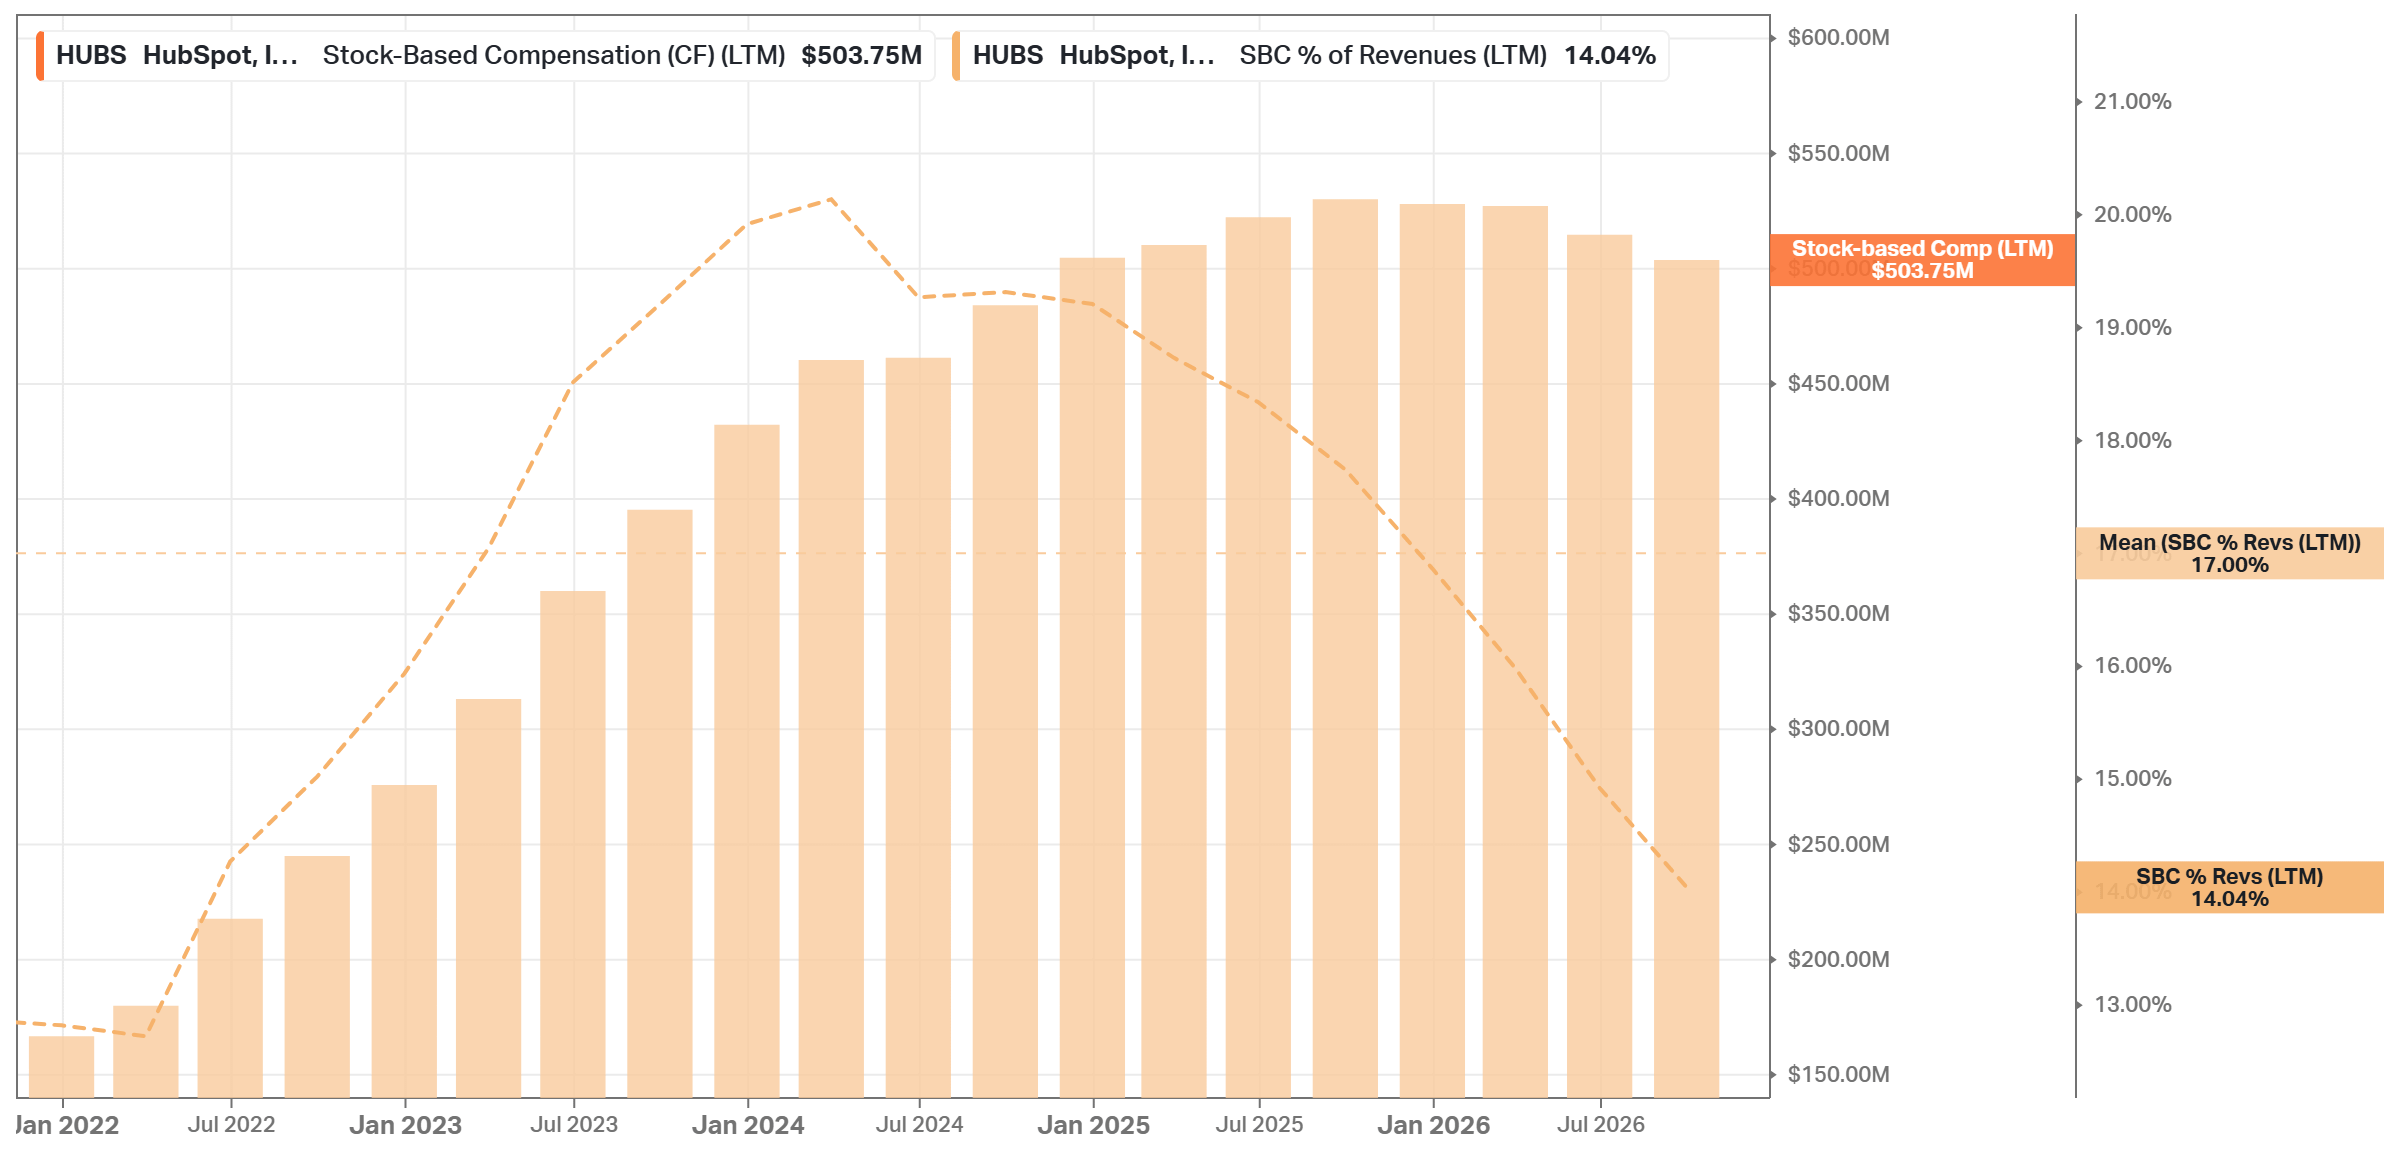
SBC is declining, and it has to. It fell from ~20% of revenue in early 2024 to 14.04% now; the target is 10% by 2030. This matters more than any margin target because SBC is a real cost: the $719M of FCF does not include the ~$504M HubSpot paid its people in stock. After SBC, only ~$215M is left. The 2026 buybacks did more than offset that dilution, but they were funded partly from cash: FCF is ~7% of the market cap, while the buyback yield is 9%. With $1.07B of net cash, this pace cannot last for many years, so the share count will help EPS less after 2027. In my opinion, management allocates capital sensibly now (no debt, small acquisitions, buybacks at low prices, and SBC down from ~20% to 14% of revenue), but the 2025 buyback at $502 was a clear mistake.
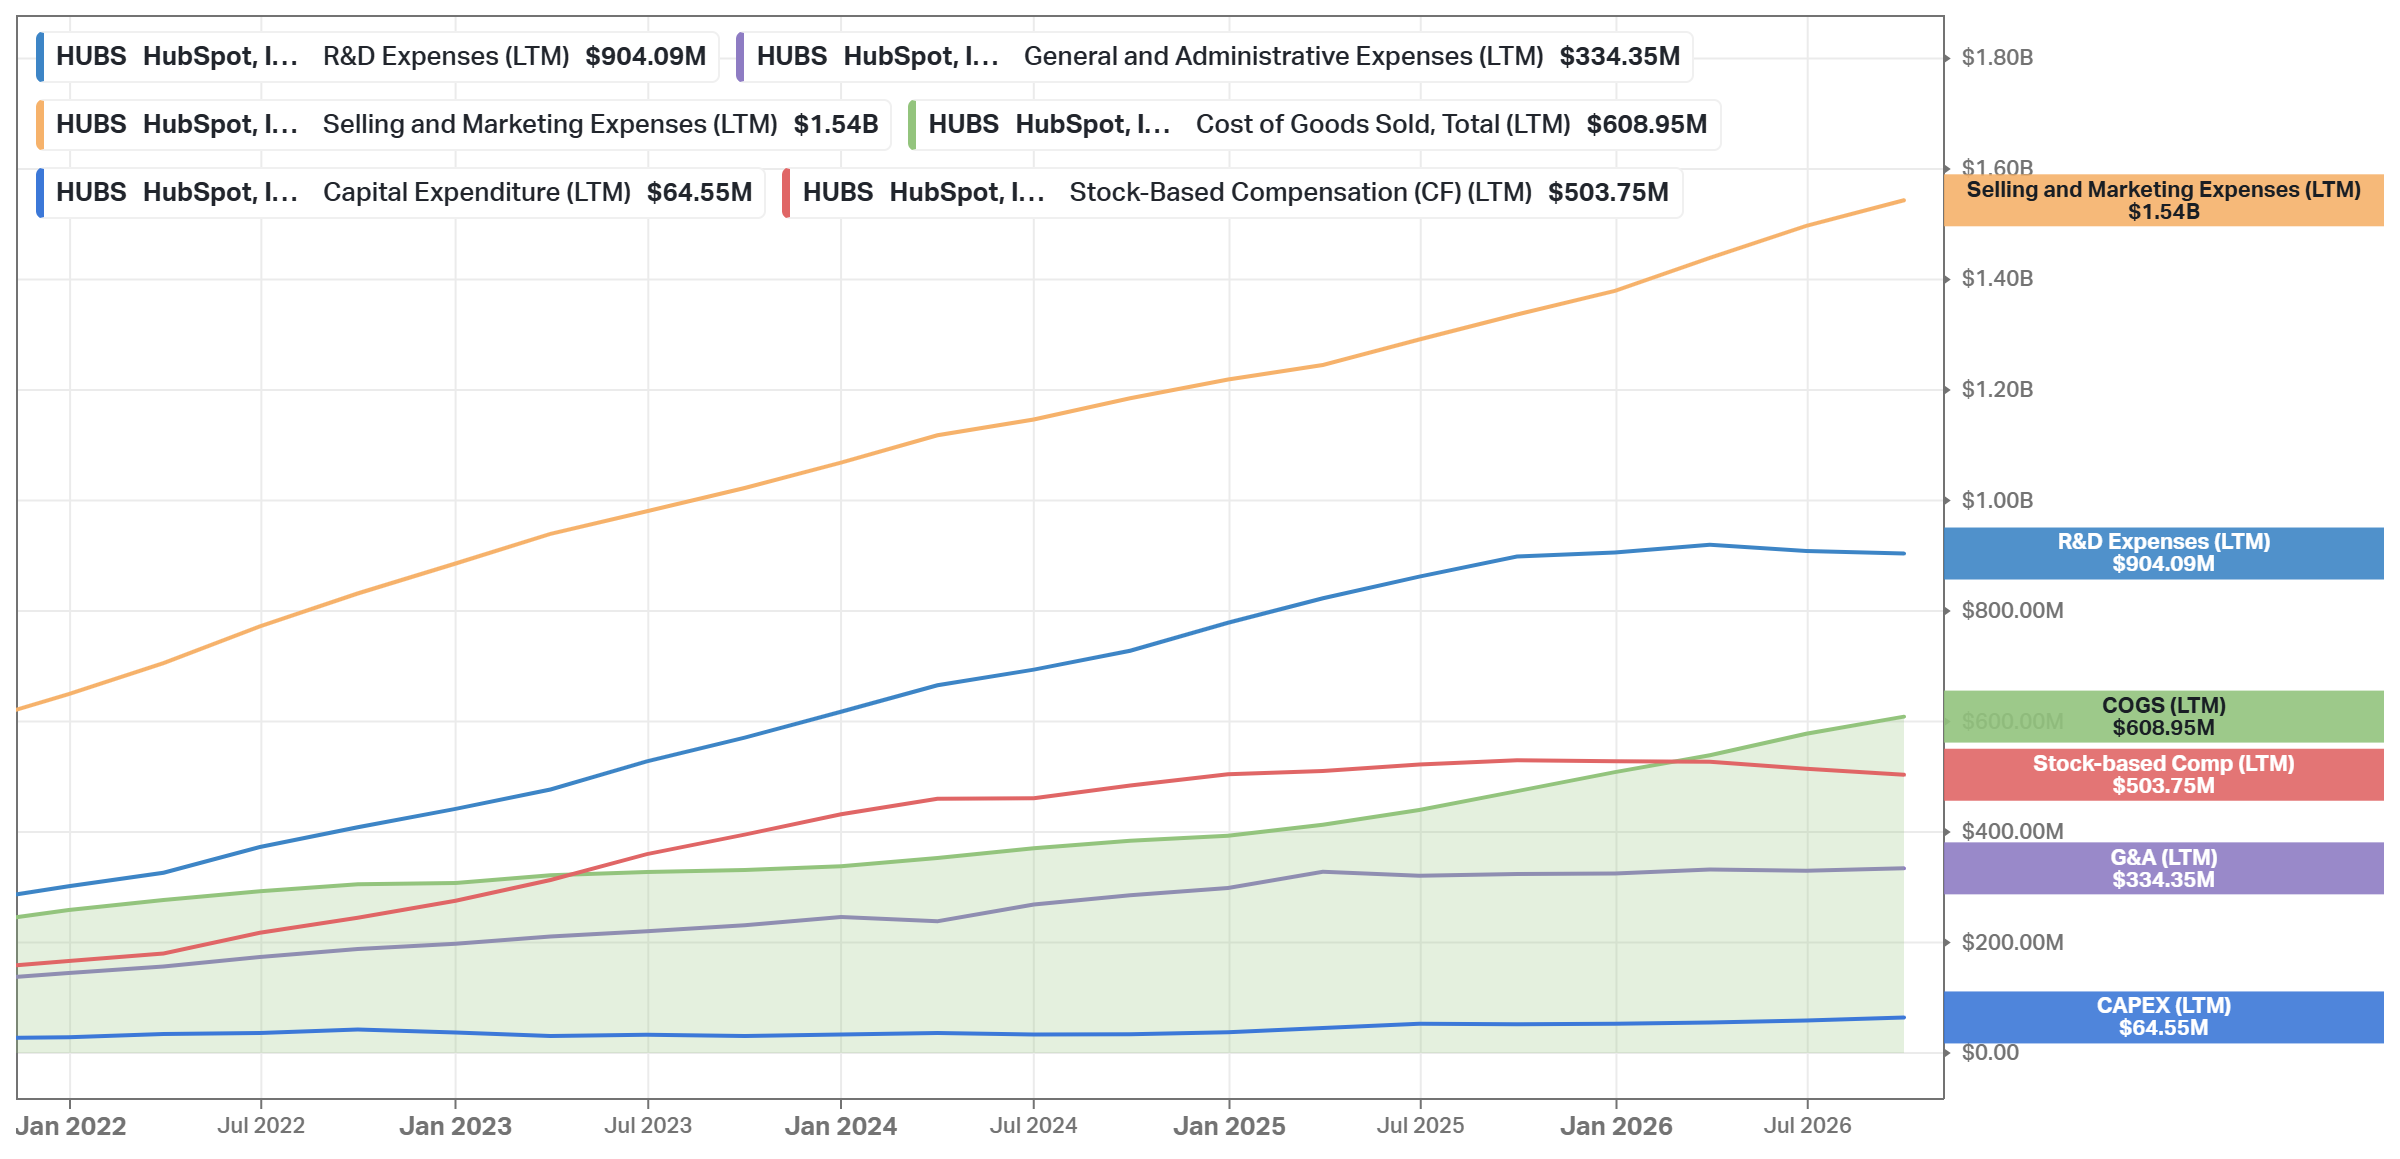
R&D stopped growing in 2025 ($904M LTM), partly because more of it is capitalized ($130.6M in 2025 against $89.6M in 2024), while sales and marketing still increased ($1.54B). In October, HubSpot cut ~7% of its staff (~660 people), with $65-75M in charges, and its 8-K says the savings go partly into retention and AI hiring.

Advantages
A real platform for small companies. 311,704 customers, one database, and several hubs on top; 62% of new Pro+ customers start with more than one hub.
Margins are expanding. The non-GAAP operating margin increased from 9.0% in 2021 to 20.8% over the LTM (22.6% in Q3), and the GAAP operating margin turned positive in 2025.
A strong balance sheet. ~$1.07B of net cash, no financial debt, and an undrawn $500M credit line.
Early AI distribution. HubSpot is the most popular CRM connector in ChatGPT and Claude; 20% of Pro+ customers use its agents, and credit consumption increased ~2.5x this year.
Buybacks at low prices. $980M in 2026 at ~$213, a 9.03% buyback yield, with $1.02B left.
Disadvantages
Growth is slowing fast. From +18% in constant currency in Q1 to a guided +12% in Q4, with consensus at +11.1% for 2027.
The funnel depends on search. In Rangan’s words, inbound demand “remains under pressure,” and the new channels “are nascent.”
Net revenue retention is lower than at every competitor that reports it. 101% against 104-108% at Freshworks, monday.com, and Klaviyo; FY2026 NRR is down ~2 points.
SBC still takes most of the cash. $504M LTM, 14.04% of revenue; FCF after SBC is ~$215M, a ~2% yield on the market cap.
Leadership is changing as the business model does. A new CEO, a new CFO from February, the Chief Legal Officer’s exit, a 7% layoff, and the pricing rollout in Europe, all since early October.
What the bears get right: the consensus for 2027 still assumes a lot. Revenue +11.1% and EPS +23% are possible only if the operating margin reaches the 23-24% target. Only the old management confirmed it on Nov 04. If growth falls below 10% and the refounding needs new spending, 2027 EPS could grow ~10-12%, not 23%. Then a 13x multiple is not cheap, but fair. Additionally, the AI shift in discovery is not a cycle: the old inbound channel will not come back. Nobody knows yet how large the new channels can be.
Competitors
Direct competitors include Salesforce (CRM), Freshworks (FRSH), monday.com (MNDY), and Klaviyo (KVYO). Salesforce is the most direct threat: in March, it added AI agents to its small business suites at no extra cost, and in April, it launched Slack CRM for small teams, included in Slack’s Business+ plan. Zoho (private) and Microsoft Dynamics 365 compete too, but they do not disclose comparable numbers.
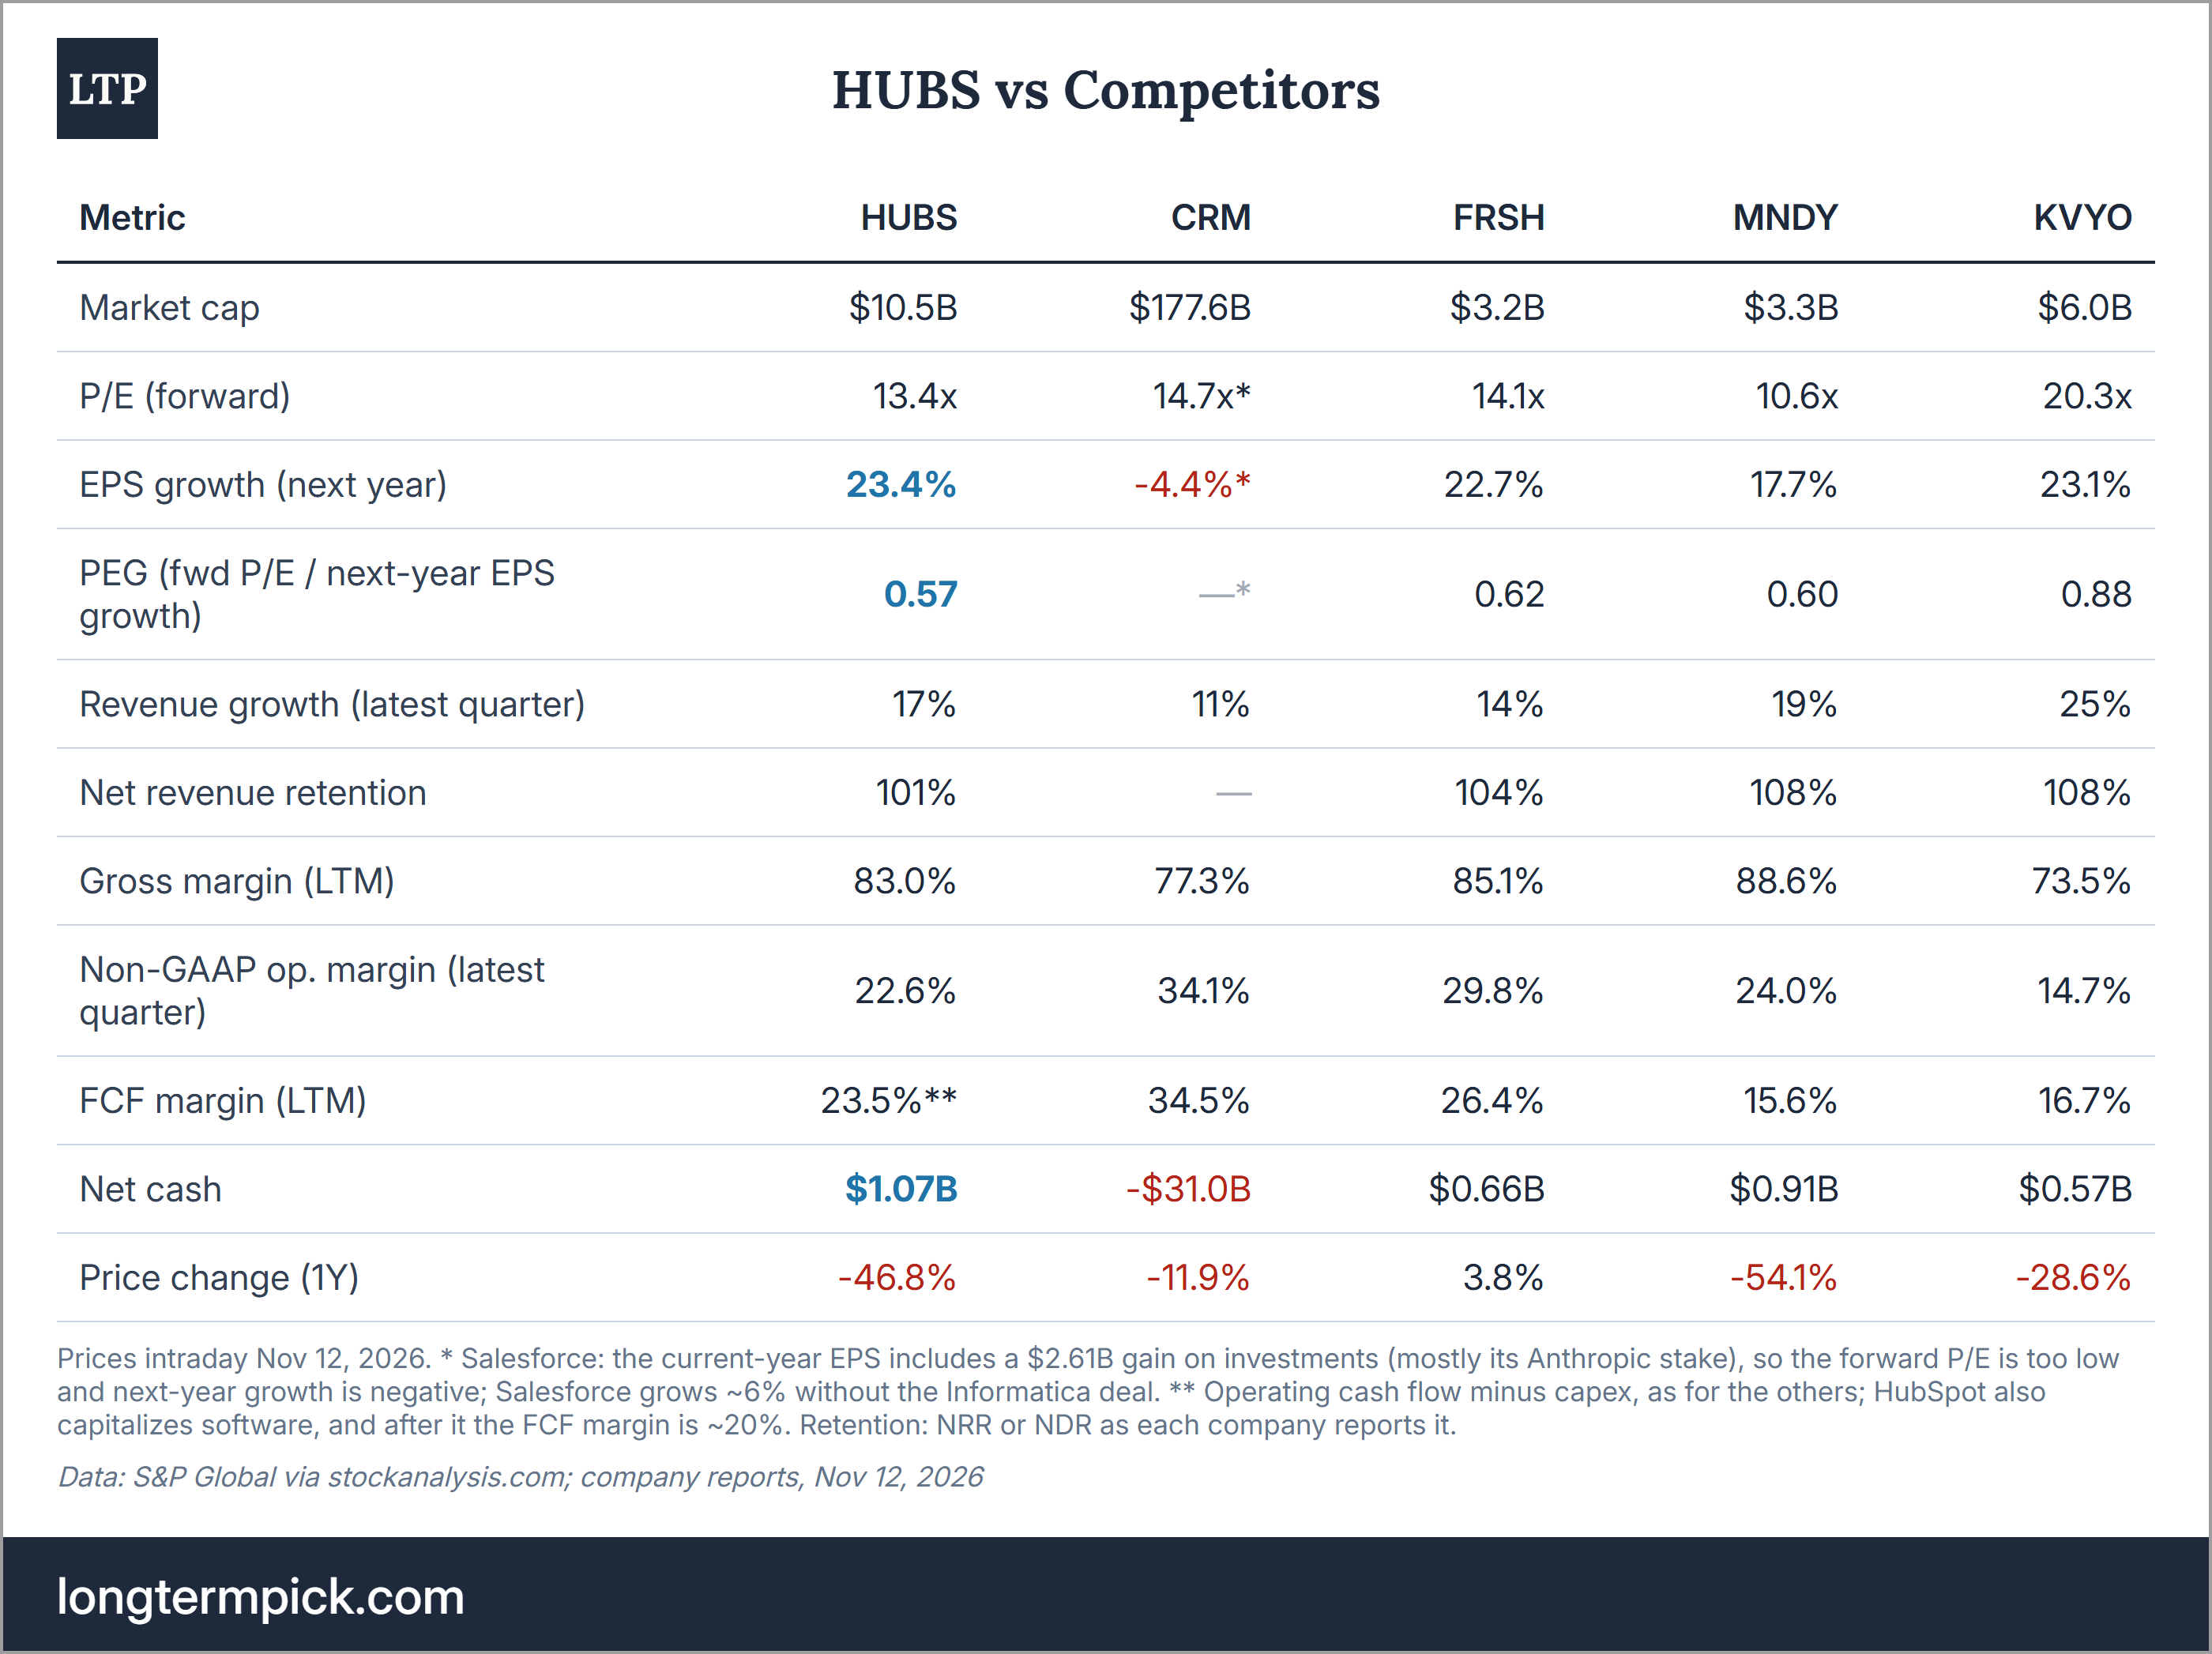
On growth and multiple, HUBS is among the cheapest. HUBS trades at 13.4x forward earnings for 23.4% EPS growth next year, the best PEG in the table (0.57). Only MNDY is cheaper on a P/E basis, but with slower EPS growth. Salesforce’s stock looks cheap at 14.7x, but the company’s current-year EPS includes a $2.61B gain, mostly from its Anthropic stake, and revenue grows only ~6% without the Informatica deal.
On quality, HubSpot is in the middle of the pack. Its non-GAAP operating margin (22.6%) is below Salesforce (34.1%), Freshworks (29.8%), and monday.com (24.0%); its net retention is the lowest of the group. On the other hand, it has the most net cash and the broadest product for small companies.
Why HubSpot and not the next-best alternative? In my view, the next-best alternatives are Freshworks and monday.com, whose stocks trade at similar P/Es and PEGs. Freshworks has better margins, but its customer service business grows only 4%. It also moves upmarket to larger customers, so it is a different bet and less focused on small businesses than HubSpot. MNDY is cheaper at 10.6x. Last quarter, monday.com also grew faster (+19%) with better retention (108%). But it guides Q4 to ~+14%, the same 5-point drop as HubSpot, and its management expects the headwinds “throughout 2027”. Its AI revenue does not help yet: annual recurring revenue (ARR) from AI is $36M, which management calls “not incremental yet”. Klaviyo grows faster (+25%) with 108% retention. But KVYO trades at 20.3x. Klaviyo also serves a narrower niche, marketing for e-commerce brands. HubSpot is the larger and broader platform, while HUBS trades at a P/E close to FRSH and MNDY. Still, its retention is the weakest, and its funnel depends most on search, so I cannot call it clearly better; I can only say that the price is low for what it is.
Past
Q3 itself was strong on profit: operating income grew about twice as fast as revenue. Revenue increased 17% to $947.6M, non-GAAP operating income 33% to $214.2M, and non-GAAP EPS 35% to $3.81 like-for-like (+43% as reported). GAAP net income was $83.0M, against $16.5M a year ago. FCF was $188.0M; HubSpot bought back $237.2M of stock. Over the LTM, revenue was $3.59B (+20%), GAAP net income was $213M, FCF was $719M by HubSpot’s definition, and ROIC was 9.02%. From 2021 to the 2026 guide, revenue grows ~23% a year.
The stock fell because the Q4 guide implies flat revenue QoQ. HUBS fell ~11% after hours on Nov 04 and closed 7.4% lower over the next 2 sessions. The guide is ~2% below the revenue consensus of $964.9M, and EPS of $3.85-3.87 is below the $4.09 expected, according to CNBC. Investors read it as a business that slows faster than planned. In my opinion, this reaction made sense: the guide confirms that the problem got worse in Q3, not better.
Still, HubSpot guides conservatively. In August, it guided Q3 revenue to $924-925M and then reported $947.6M, 2.5% more. The CFO said the approach “has not changed”. A beat of the guide by the same 2.5% would give ~$970M in Q4, +15% YoY. The weak part is the trend: in 2024 and 2025, Q4 revenue grew ~5% QoQ, but this guide is flat. Beats alone do not help the stock. The company beat revenue and EPS consensus in each of the last 20 quarters, but HUBS fell ~19% after each Q1 and Q2 report. In August, the reason was similar to now: a lower revenue guide and net adds of 7,000 versus the 9,000-10,000 HubSpot expected.
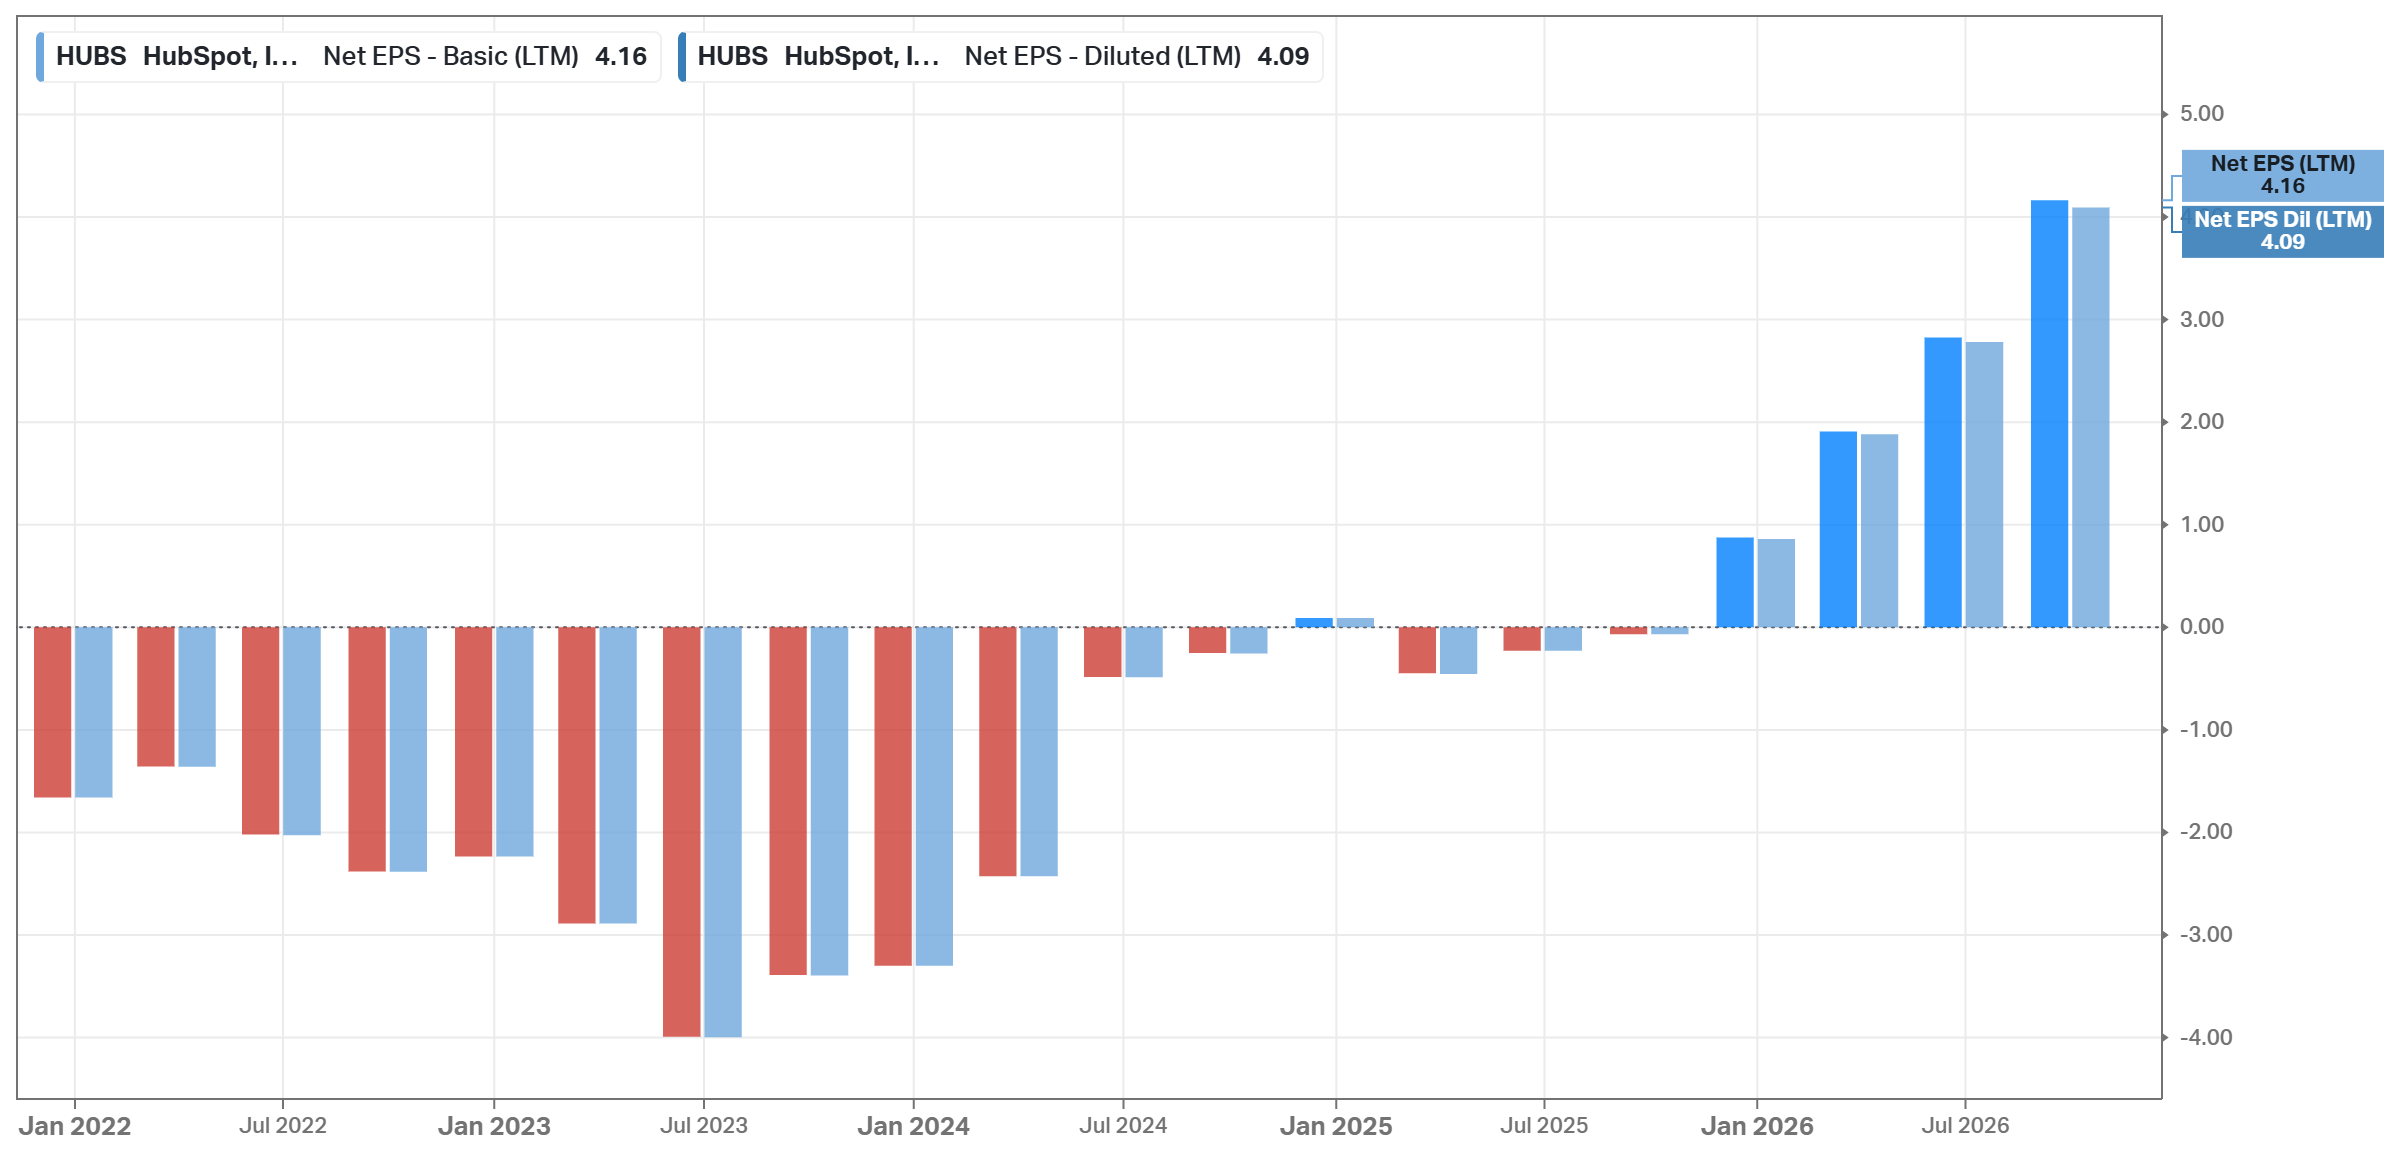
On a GAAP basis, HUBS lost money every year from 2021 to 2023 and broke even in 2024 ($4.6M). LTM diluted EPS is now $4.09.
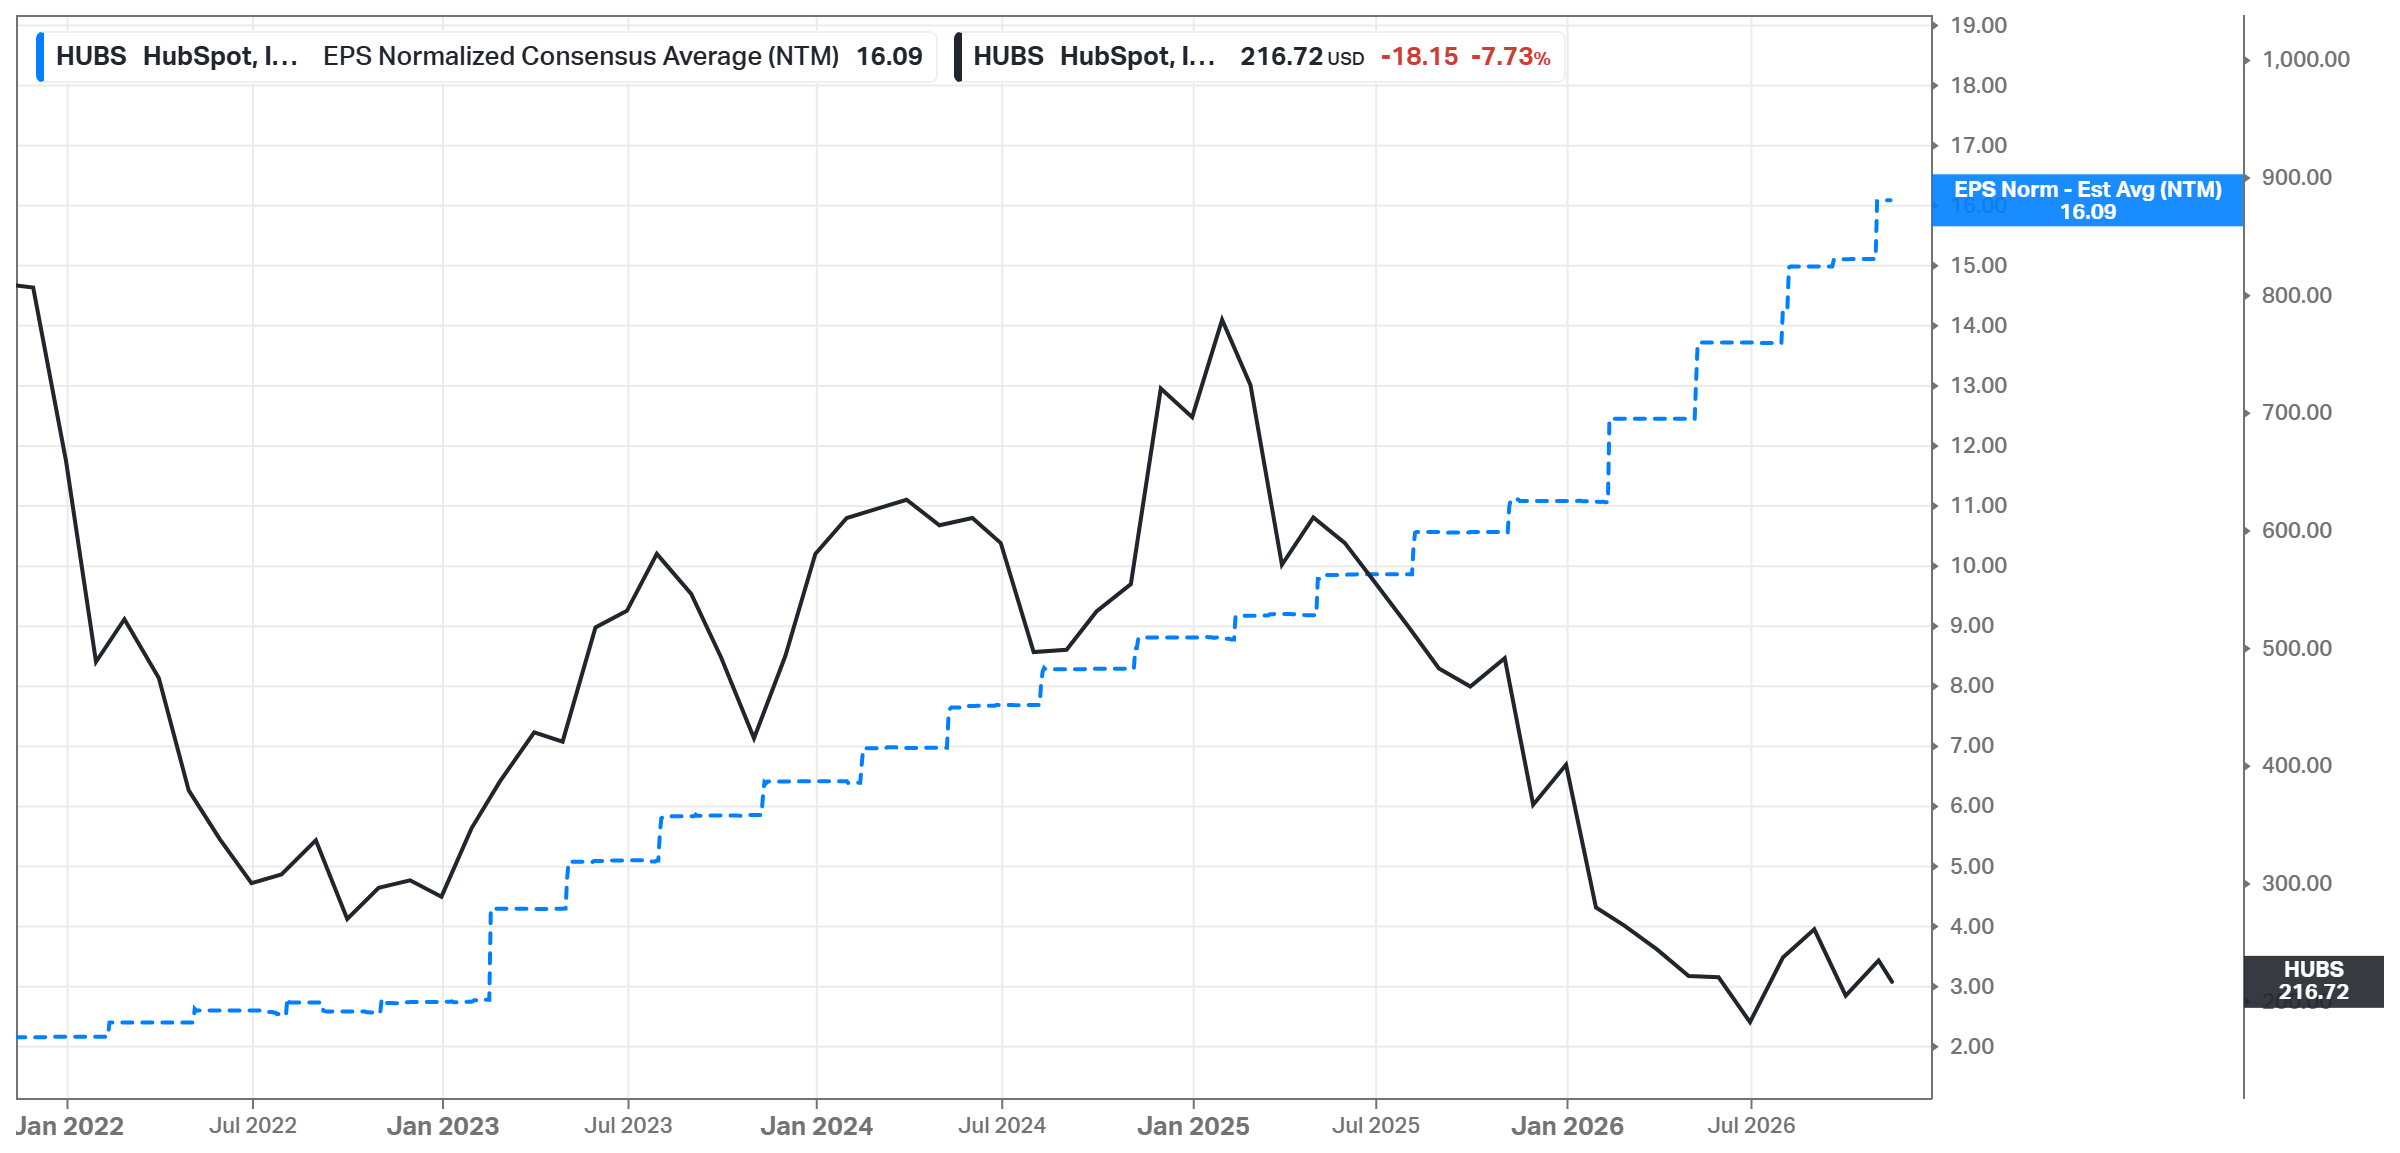
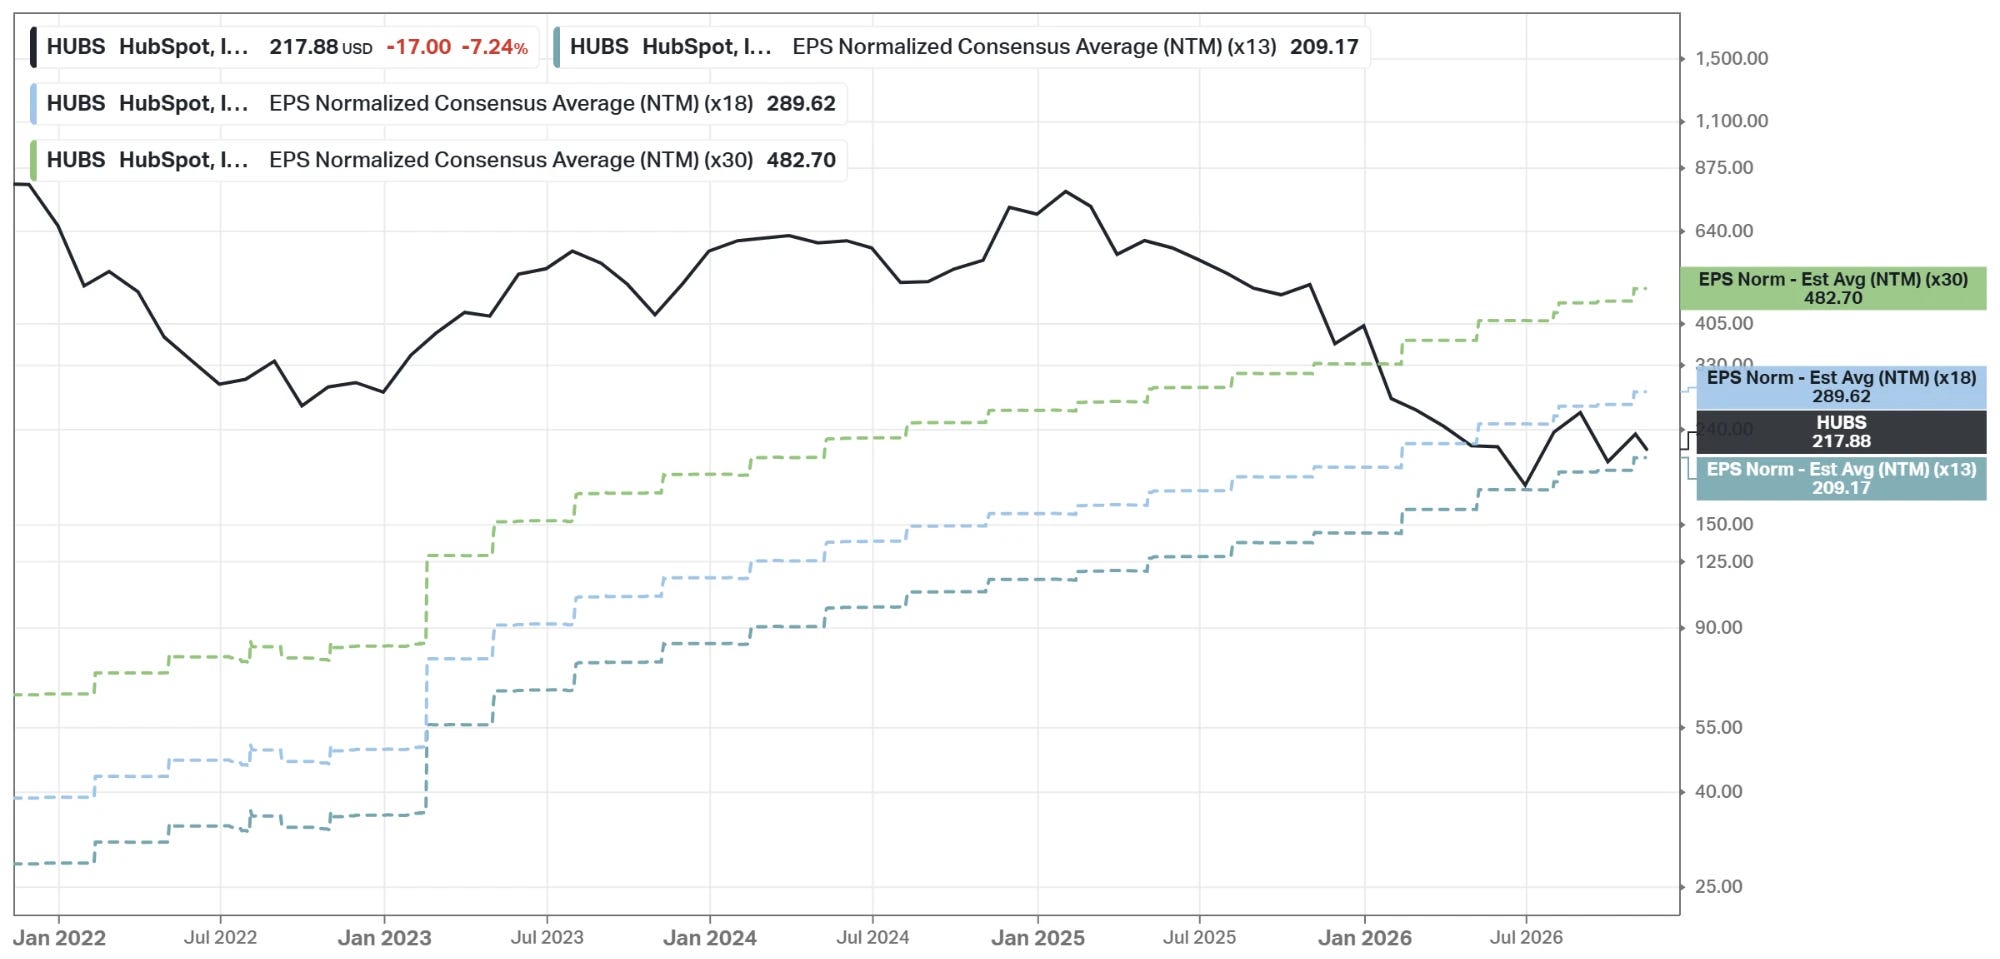
This chart shows the disconnect. The NTM EPS consensus increased almost every quarter for 5 years, now at $16.09. At the same time, the price fell from ~$800 to ~$200; since mid-2025, the two lines have moved in opposite directions. Part of the 2026 rise in the EPS line is not operating: the 15% tax rate added ~6% to every EPS estimate, and buybacks cut the diluted share count 6% YoY. So the gap is smaller than the chart shows. But it is real: non-GAAP operating income, which neither of the two touches, grew 33% in Q3.
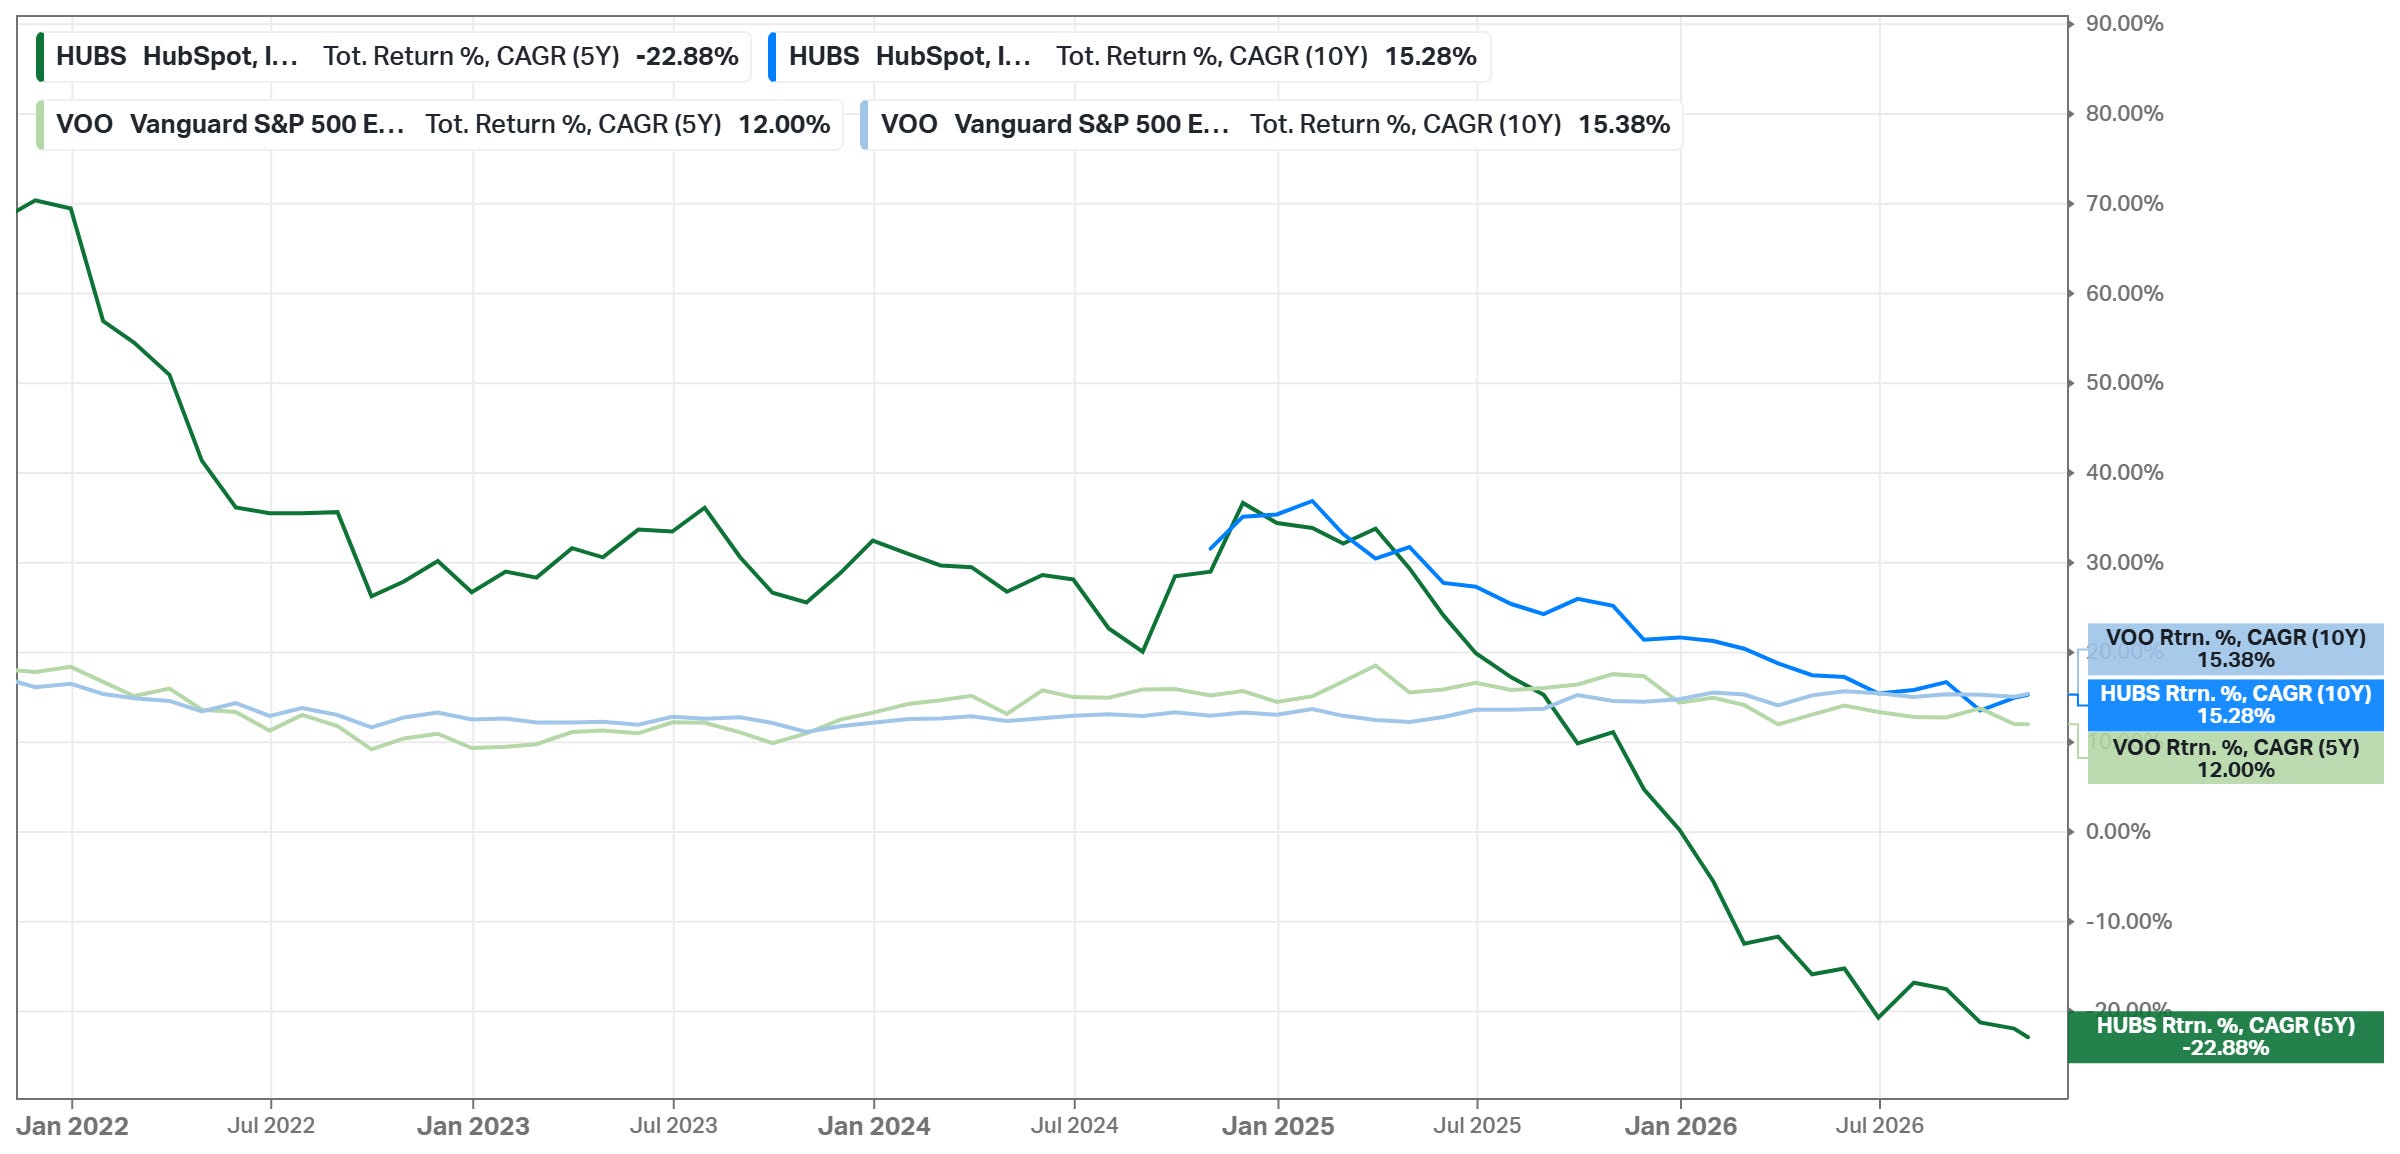
Over 5 years, HUBS returned -22.88% a year, against +12.0% for VOO. On a 10Y view, the two are almost equal: 15.28% against 15.38%. So the long-term holder has kept pace with the market; the investor who bought at the 2021 high lost ~75%.
Future

Consensus expects revenue to slow, but EPS to keep growing. For 2026, the Koyfin consensus is $13.62 of EPS, in line with HubSpot’s guide of $13.59-13.61. Then it expects $16.79 in 2027 (+23%) and $19.77 in 2028 (+18%). Revenue should reach $4.10B in 2027 (+11%) and $4.53B in 2028 (+11%). To compare, revenue grew ~23% a year from 2021 to the 2026 guide, so consensus expects about half that pace.
The 2027 EPS consensus did not move after the weak Q4 guide: it is still $16.79, while the Q4 EPS consensus fell 5.6%. Analysts also set it before the CEO change. With a flat Q4, $4.10B of revenue in 2027 needs ~3% growth QoQ in every quarter of 2027. So I read the 2027 consensus as an upper bound until the February guide.
The 5Y EPS growth estimate is 29.6%, almost equal to its 28.86% mean, so analysts did not cut the long-term view. Still, I do not trust this number. From $13.62 in 2026, 29.6% a year gives ~$50 of EPS in 2031. That needs ~36% a year after 2028, while consensus slows from 23% in 2027 to 18% in 2028. Part of the gap can be the tax change: if the estimate starts from 2025 EPS at the old 20% rate, the lower rate alone adds ~1-2 points. So the 2026-2028 path of ~20% a year is the cleaner number. It is close to my 20% cap, but it slows every year, to 18% in 2028.
The math behind 2027 is margins and buybacks. By my calculation, revenue +11.1% gives EPS +23% only under two conditions. The non-GAAP operating margin has to increase from ~21% in 2026 to ~23%, the low end of the target. And the share count has to stay at the Q4 level of 48.9M. That level is already ~3% below the 2026 average of 50.4M, so ~3 points of 2027 growth come from buybacks already done. Keeping the count there needs buybacks of roughly the SBC amount, ~$500M a year. This suggests that 2027 EPS depends more on cost discipline than on demand; cost discipline is exactly what a “refounding” can change.
Analysts are skeptical. On Nov 06, 35 analysts rated HUBS: 25 a Hold, 6 a Strong Buy, 2 a Buy, and 2 a Sell or Strong Sell. In June, 19 rated it a Strong Buy. The mean price target was $228.9, +5.6% from today, with a range of $170-320. After the Q3 report, Citi cut its target from $287 to $230, and TD Cowen cut it from $260 to $215. Four brokers also downgraded HUBS; Cantor Fitzgerald went as far as Underweight. On Nov 13, after the CEO change, UBS set a $190 target with an Underperform rating.
Company guidance: for Q4, revenue of $945-947M (+12%), a non-GAAP operating margin of ~23%, and EPS of $3.85-3.87. For 2026, revenue of $3.685-3.687B (+18%), a 21% margin, EPS of $13.59-13.61, and FCF of ~$720M. The 2027 guidance will accompany the Q4 report in February. At the Analyst Day, HubSpot targeted a 23-24% non-GAAP operating margin for 2027 and 30% for 2030, with SBC at 10% of revenue.
Current Valuation
Current vs 5Y mean:
Price/Fwd Earnings: 13.5x vs 87.0x (-1 SD: 23.2x)
Price/Fwd Sales: 2.7x vs 9.3x (-1 SD: 5.3x)
Price/FCF (LTM): 12.7x vs 68.6x (-1 SD: 31.3x)
Price/Book: 6.6x vs 17.6x (-1 SD: 10.1x)
PEG (5Y estimate): 0.46 vs 3.09
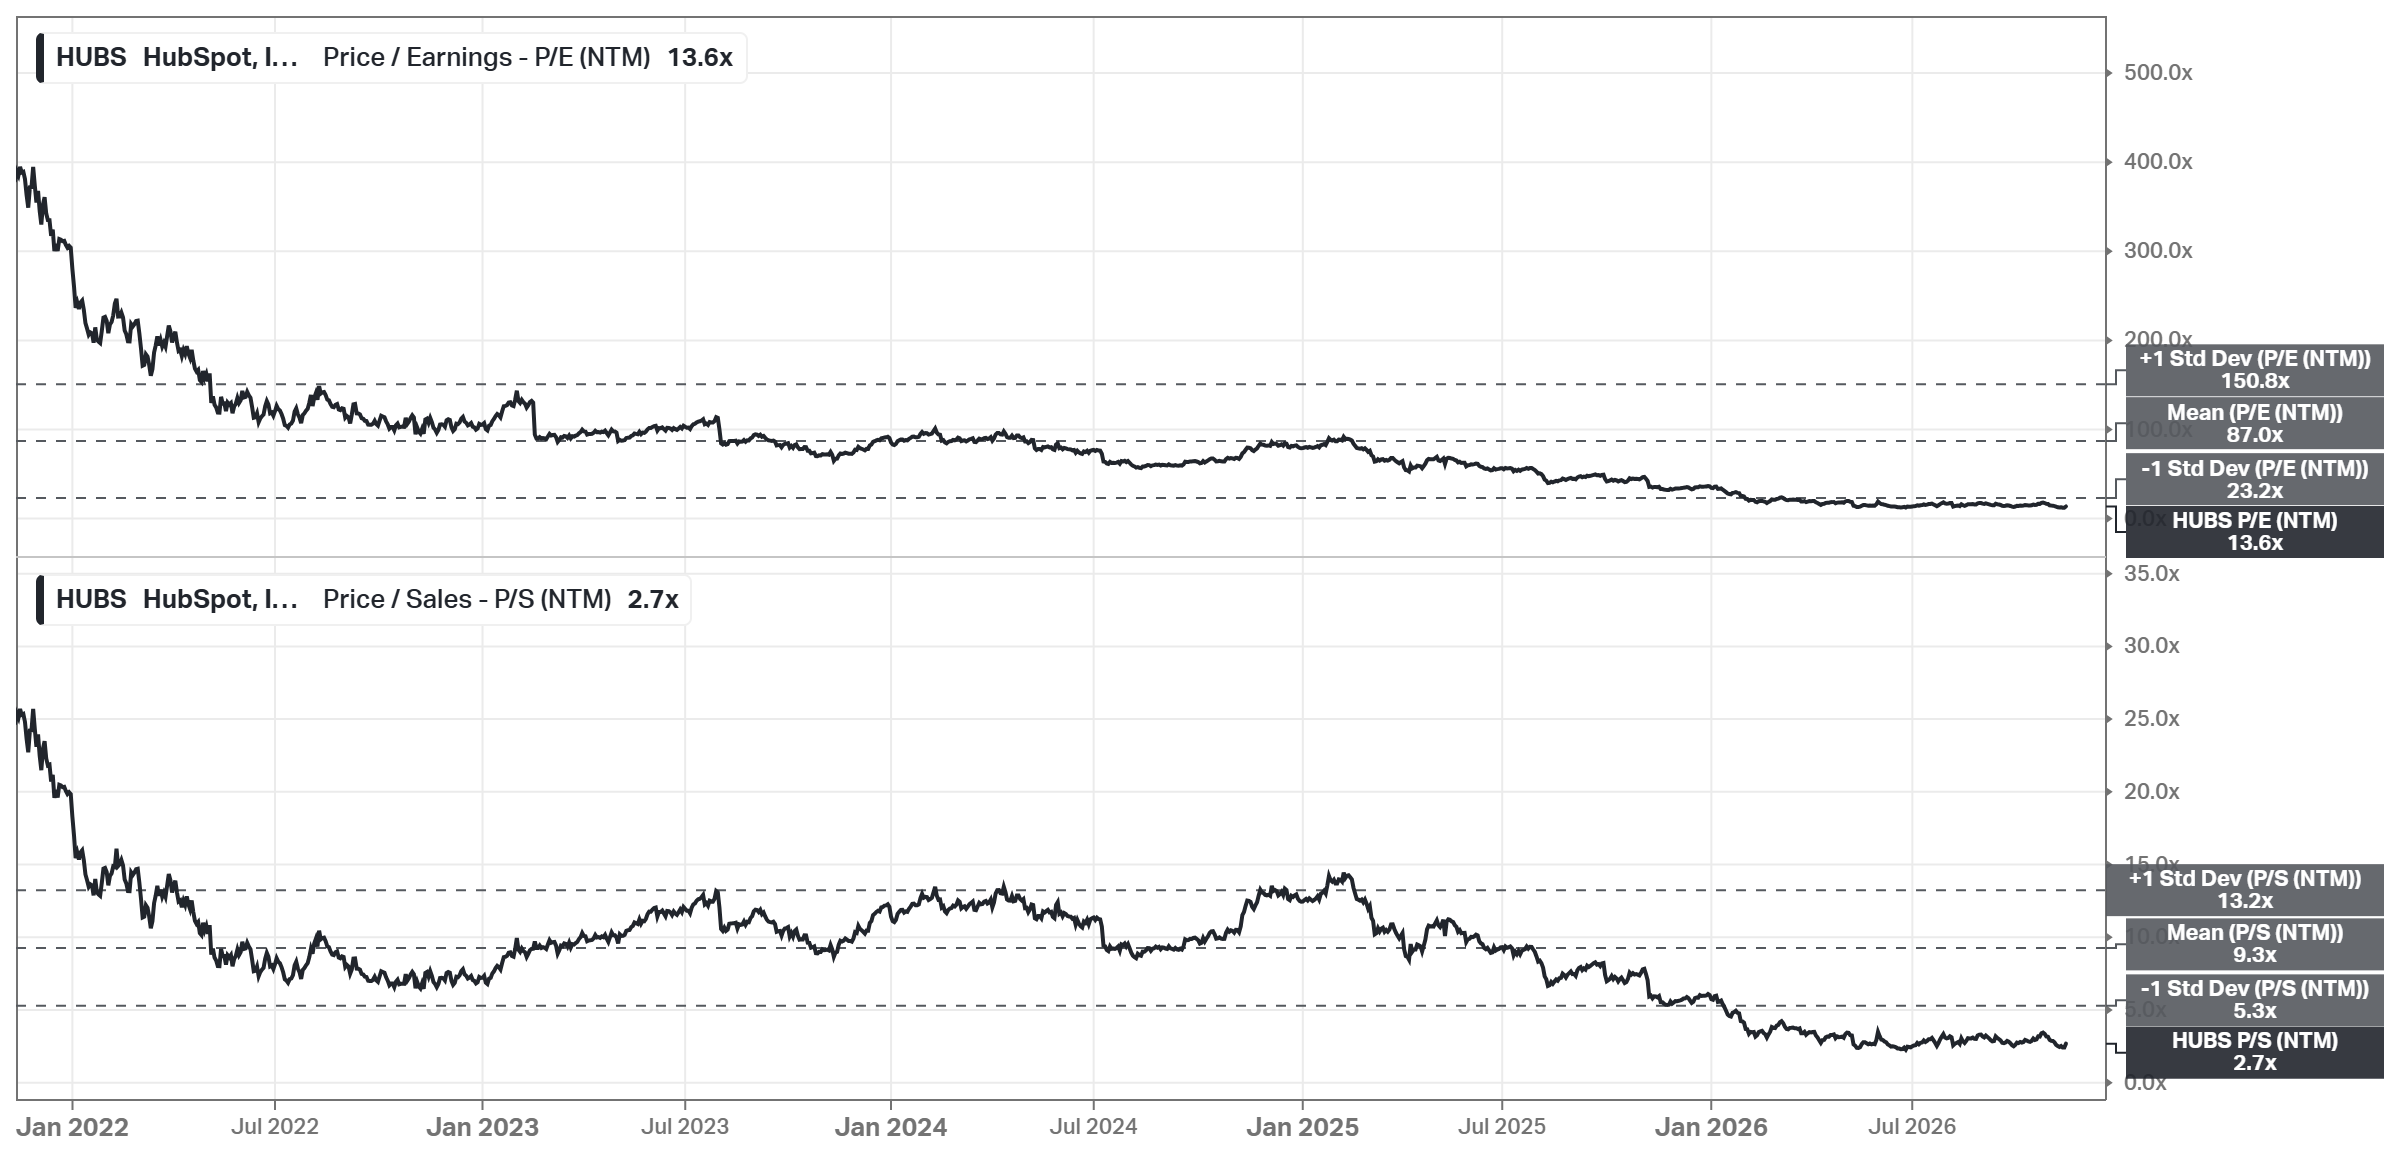
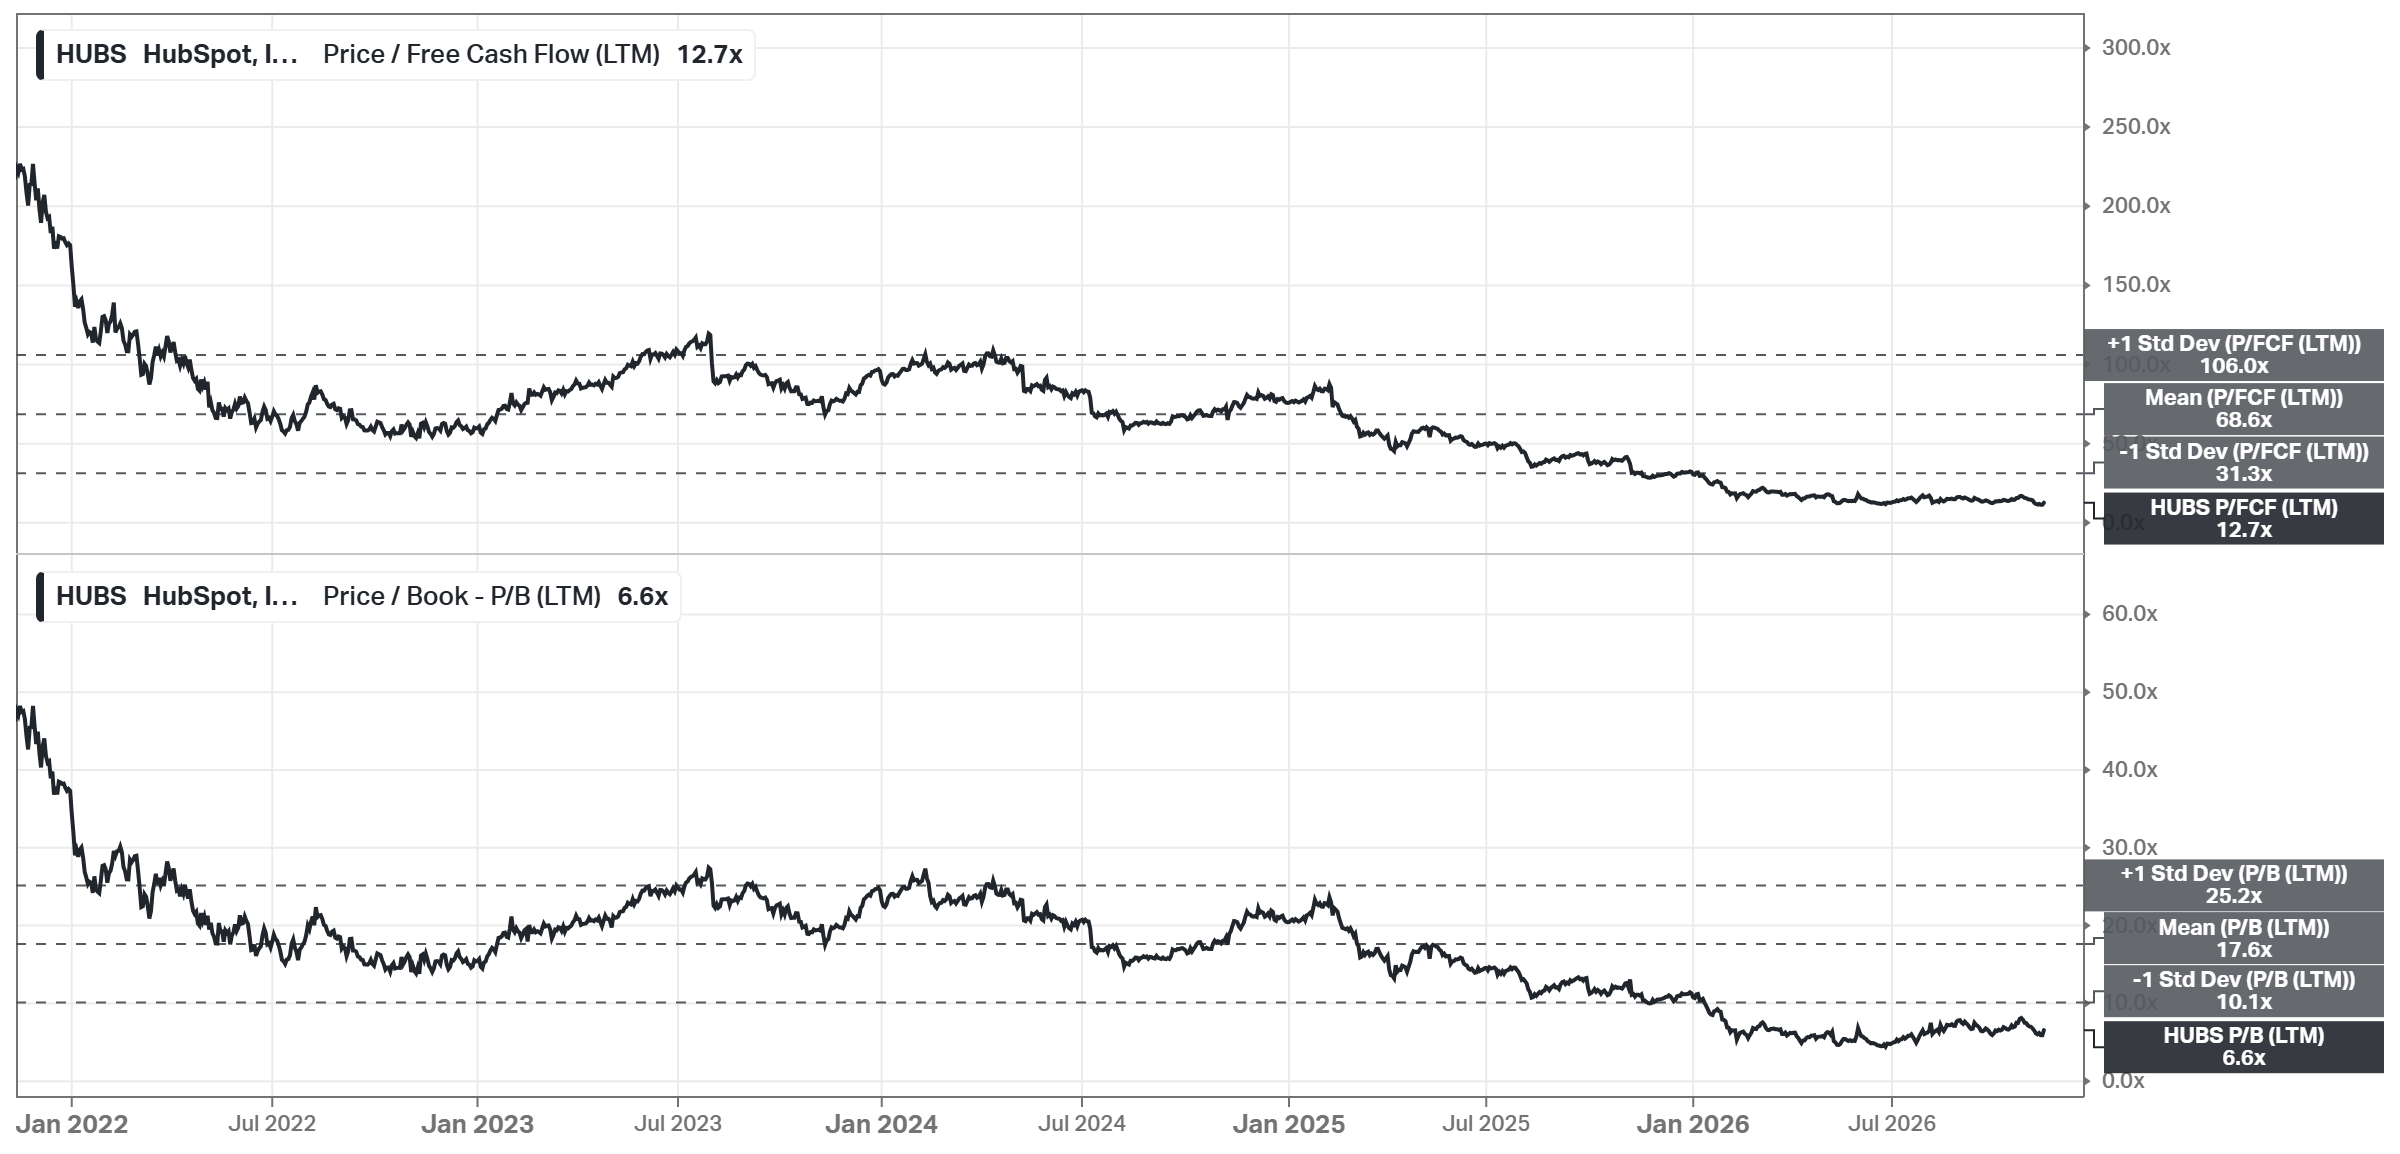
Every multiple is below its -1 SD band. HUBS trades at 13.5x forward earnings, 2.7x forward sales, 12.7x FCF, and 6.6x book. For comparison, FRSH trades at 14.1x forward earnings, MNDY at 10.6x, and the technology sector (XLK) at ~19x.
But the stock is less cheap than 13.5x suggests. The P/E uses non-GAAP EPS, which leaves out $504M of SBC (~$8.65 a share after tax). On GAAP EPS, the LTM P/E is ~53x. FCF tells the same story: P/FCF is ~14.7x on HubSpot’s own number, but ~49x after SBC. A simple DCF on FCF after SBC gives only ~$89 a share.
I still use non-GAAP EPS, but the cost is real. Since competitors report it too, I value every company on the same basis. Buybacks of ~$500M a year only keep the share count flat. If SBC falls to its 10% target by 2031, my 13x Bear Case multiple equals ~20x EPS after SBC, by my calculation. At 14% of revenue, the same 13x is ~25x, so my fair prices are too high.
Analyst’s note:
The 87.0x 5Y P/E mean is distorted: in late 2021 and early 2022, HubSpot’s non-GAAP EPS was only ~$2-3, and its P/E was 150-400x; in 2023-2024, it was still ~60-140x. This also applies to the -1 SD band of 23.2x, which still includes 2022-2024. So I do not use the mean anywhere in my model. Since April 2026, HUBS has traded at ~12-18x; this range is my reference.
What does the price already assume? If I buy at $216.72, want 12% a year, and the multiple is 13x on 2031 EPS, then EPS has to grow ~17% a year from the 2026 consensus of $13.62. At 18x, ~9% a year is enough. Consensus expects 23% next year and ~20% a year through 2028 ($13.62 to $19.77). So at 13x, EPS can grow a few points slower than consensus and still give me 12% a year. If EPS grows 20% and the multiple never recovers, HUBS still returns ~15% a year.
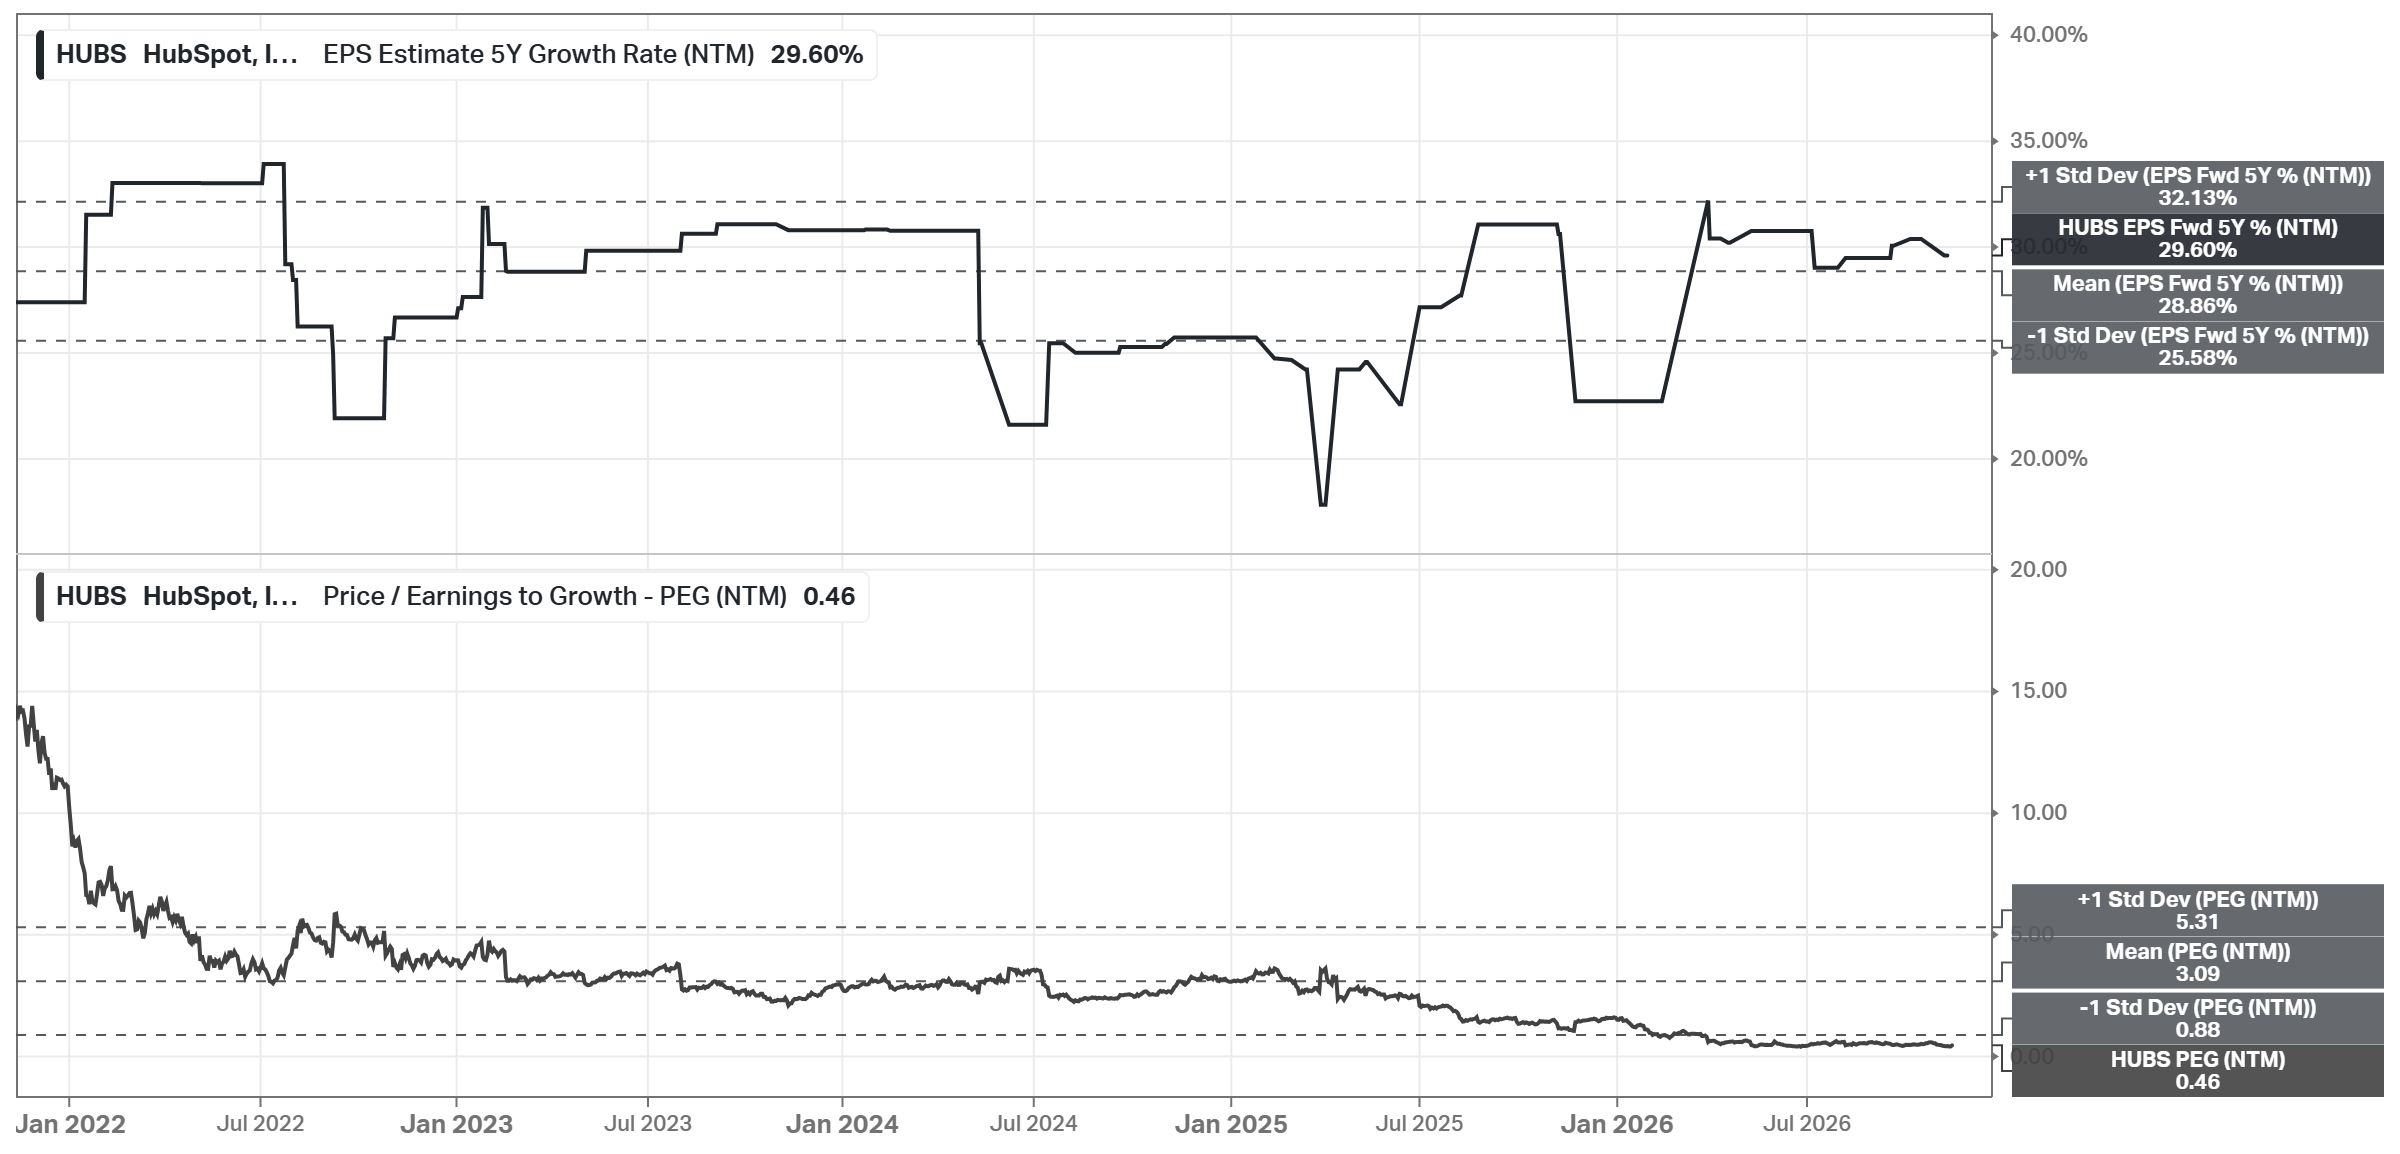
PEG fell from ~3 to 0.46, while the 5Y EPS growth estimate stayed close to its mean. So the estimates did not move much; the multiple did.
One chart frames this whole section. The three lines are today’s NTM EPS of $16.09 at my exit multiples: 13x ($209), 18x ($290), and 30x ($483). My fair prices are different: they use 2031 EPS, discounted at 12%. HUBS fell below the 18x line in spring 2026 and has stayed under it since; in June, it was even below the 13x line. Now it is just above the 13x line.
Fair Price
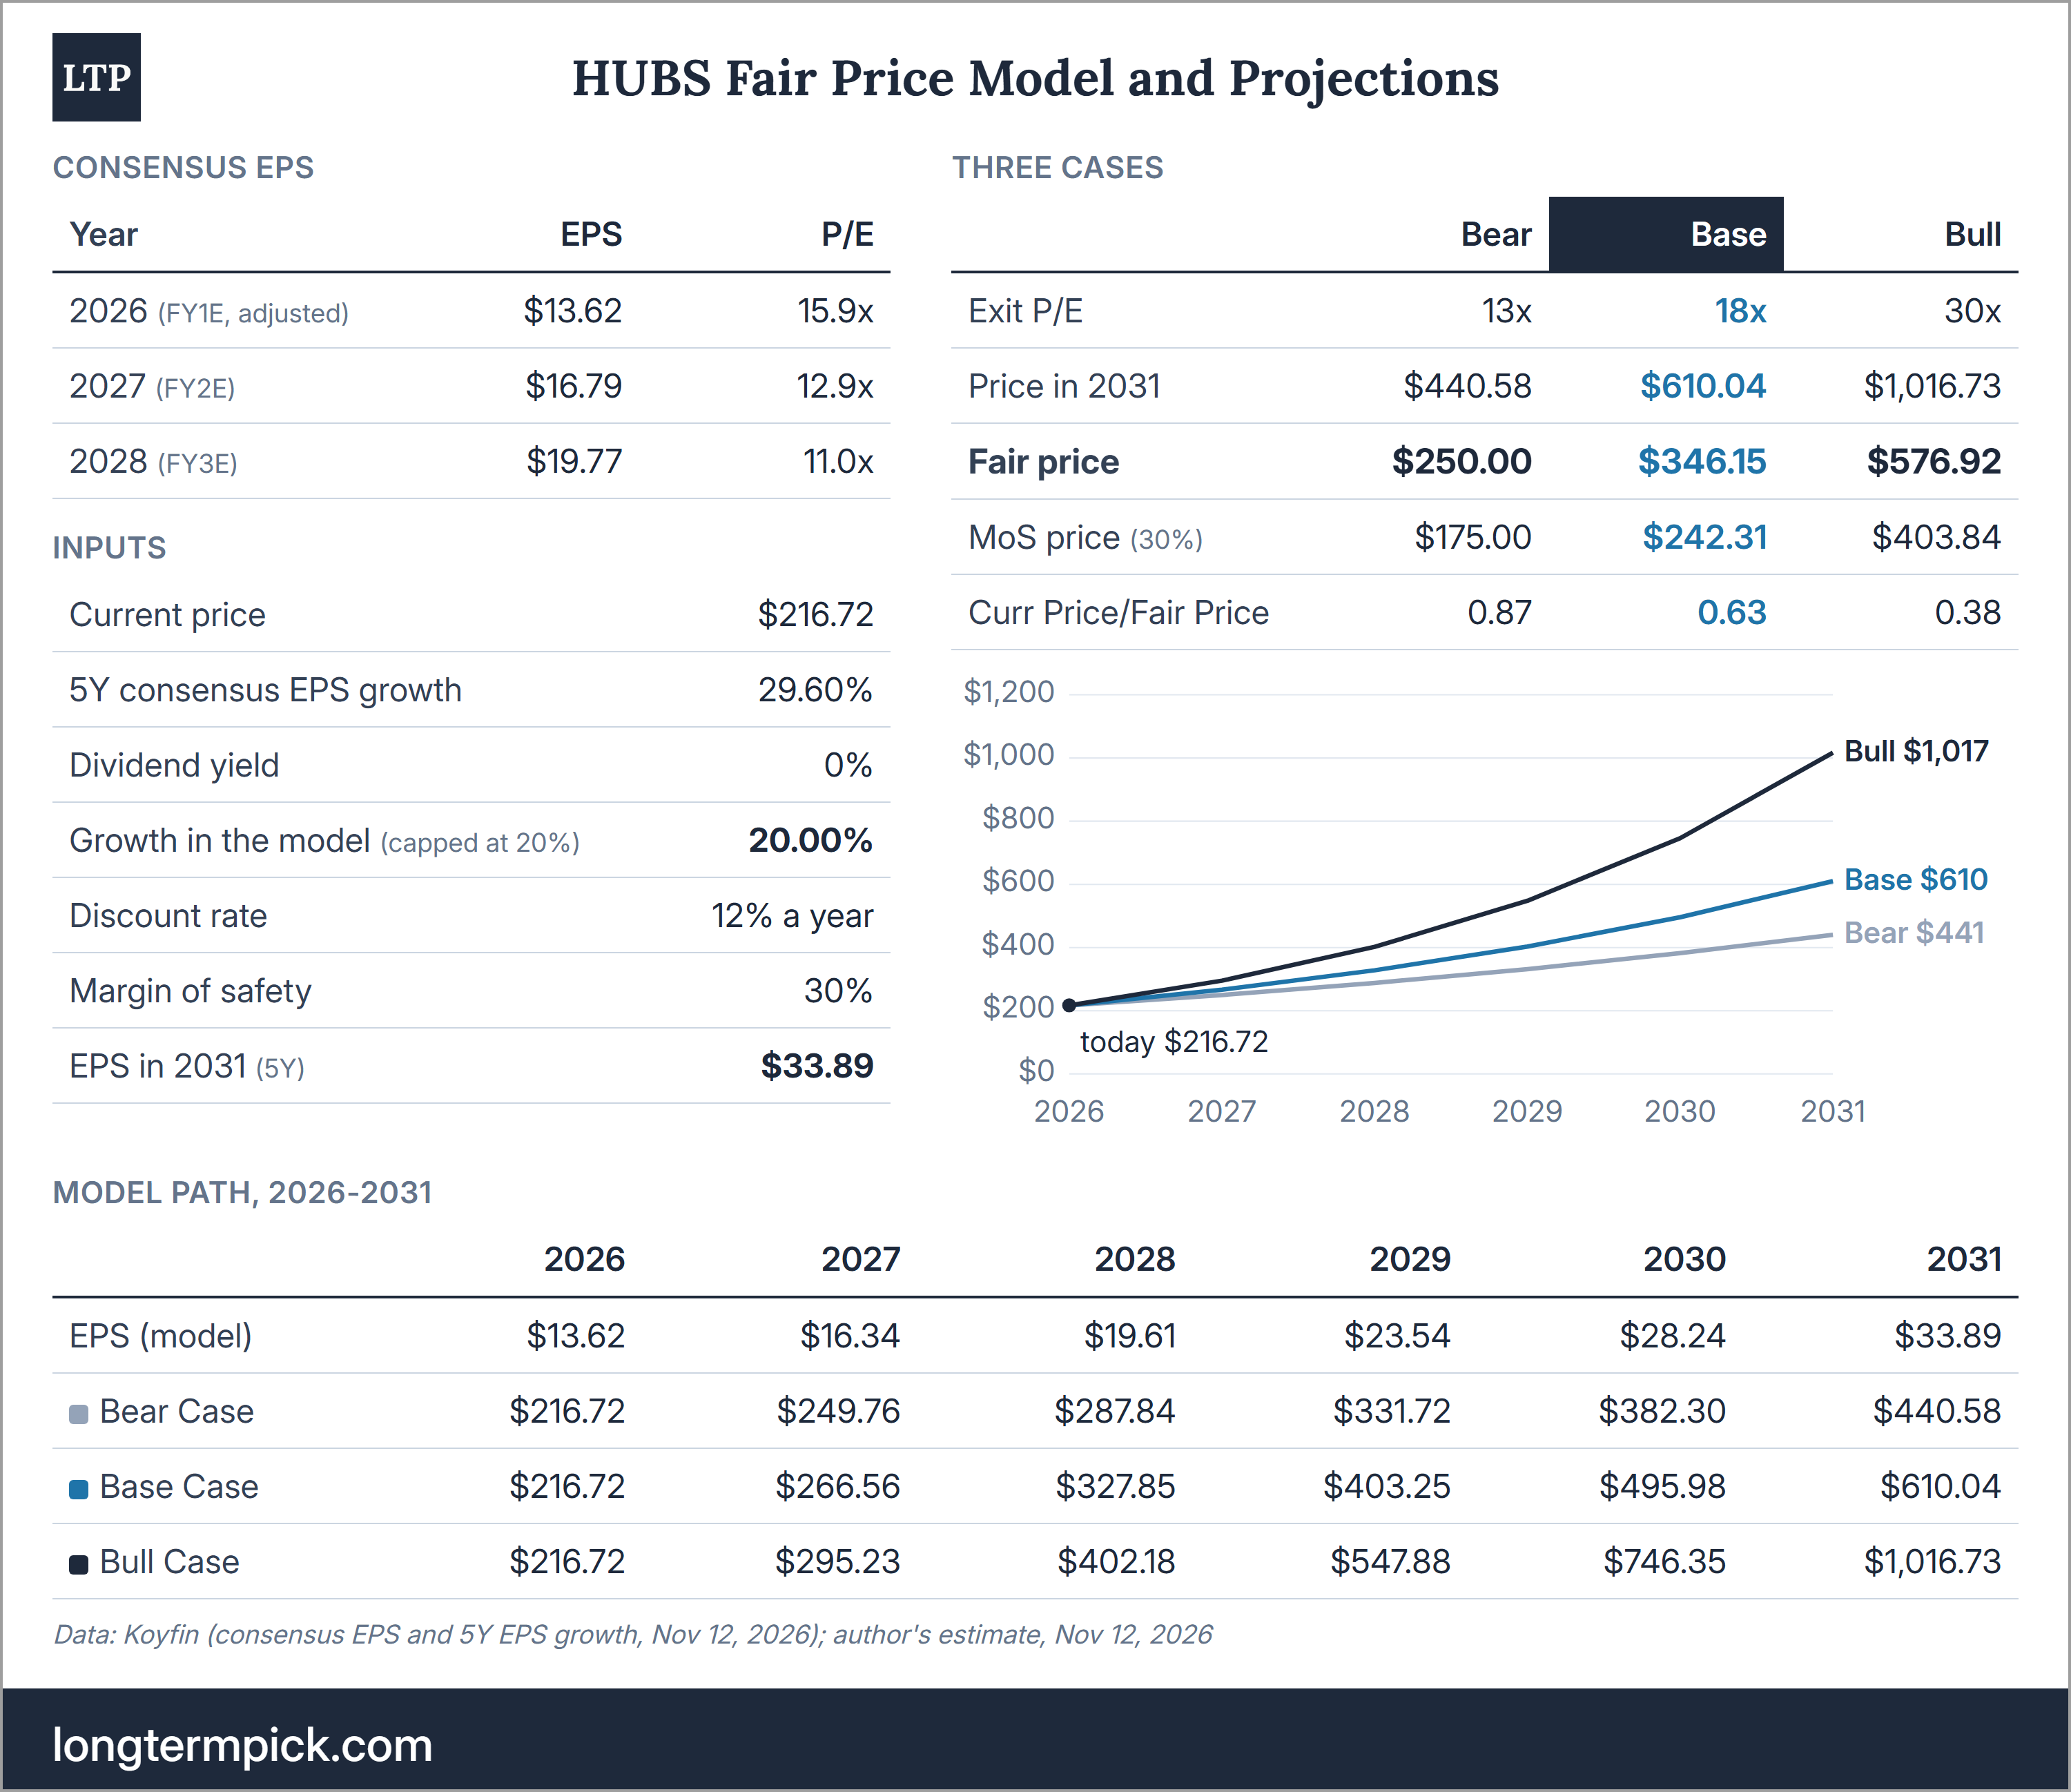
Consensus expects 29.6% growth over 5 years; my model accounts for this by capping future growth at 20%. So the model uses 20% a year from the 2026 consensus EPS of $13.62. The 2026-2028 consensus is ~20% a year, so the cap mostly removes the later years of the 29.6% estimate. As a result, EPS reaches $33.89 in 2031. The discount rate is 12%; the margin of safety is 30%.
The exit multiples are 13x/18x/30x. For the Bear Case, I use 13x, today’s multiple rounded down; it assumes the market never pays more for HUBS than now. Still, 13x is not the floor. At the June low of $170, HUBS traded at ~12x, and MNDY is at 10.6x today. If the exit multiple is ~11x, between these two, the Bear Case falls to ~$212, just below today’s price.
The Base Case uses 18x, the upper end of the range since April. I take the top, not the middle, because 18x is a PEG of 0.9 at my 20% cap, still below 1 for the ~20% a year that consensus expects to 2028. But the exit is in 2031, when growth will likely be lower, and FRSH and MNDY trade at a PEG of ~0.6 today. So 18x holds only if EPS grows as consensus expects; at 15x, the middle of the range, the Base Case would be ~$288, with HUBS still 25% below it. The distorted 87.0x mean plays no role here. And the Bull Case uses 30x, my ceiling: a PEG of 1.5 at 20% growth, and still below the multiples HUBS had before 2026.
Bear Case (exit P/E 13x): fair price $250 - MoS price $175
Base Case (exit P/E 18x): fair price $346 - MoS price $242
Bull Case (exit P/E 30x): fair price $577 - MoS price $404
Analyst’s note:
The 20% cap is the most sensitive part of this model. Consensus expects ~30%, but the 2027 revenue consensus is only +11.1%. EPS can outgrow revenue only while margins expand. If revenue grows ~11% a year, $33.89 of EPS in 2031 needs a non-GAAP operating margin of ~27% with 3% fewer shares every year, or ~31% with a flat share count, by my calculation. The ~31% is about the 30% target for 2030, which the Nov 12 release did not repeat.
At 15% EPS growth, the Bear Case would be ~$202 and the Base Case ~$280, so at $216.72, HUBS would be above the zone. If EPS follows consensus to 2028 ($19.77) and growth then slows to 15%, 13%, and 12% in 2029-2031, the Bear Case is ~$212 (by chance, the same as at 11x) and the Base Case ~$294. With 10% growth and 13x, the fair price is ~$162. Today’s price is below the Bear Case fair price only if EPS grows ~17% a year or more.
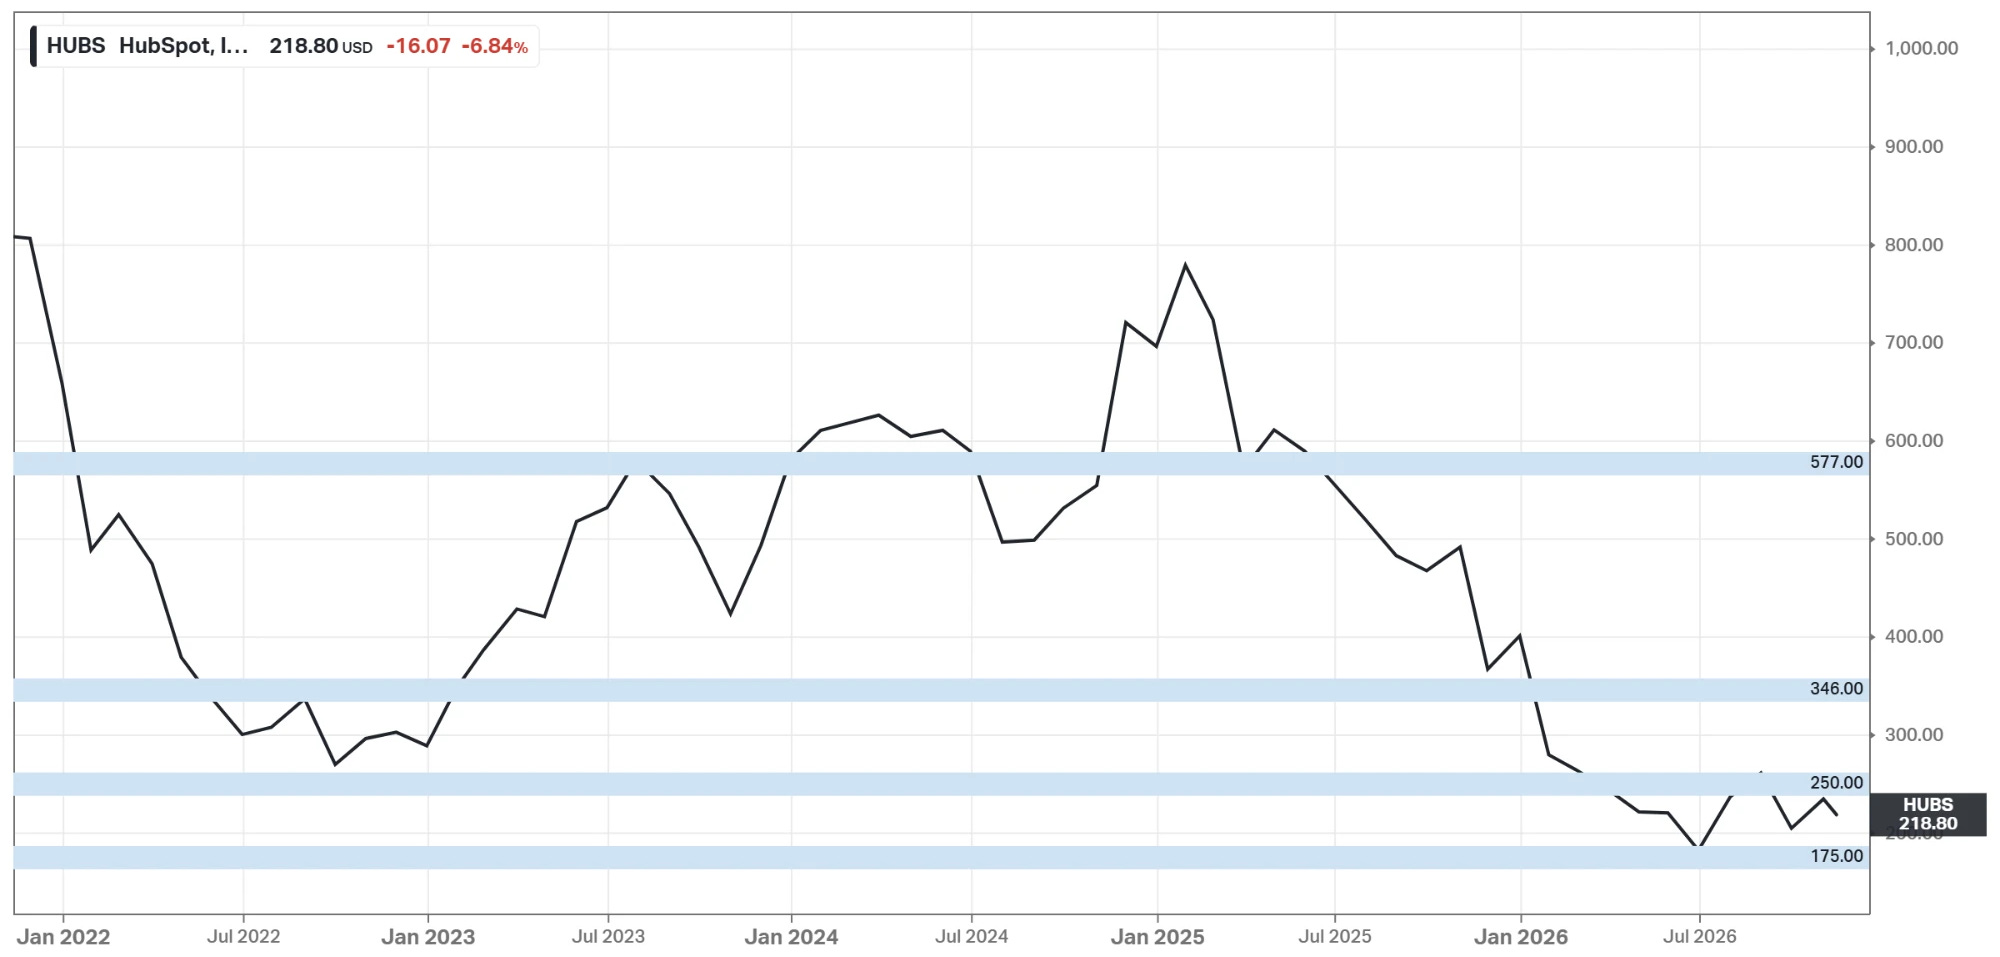
At $216.72, HUBS is 37% below the Base Case and 13% below the Bear Case fair price. So HUBS is inside my accumulation zone of $175-250.
Due Diligence
Profitability (12 of 15):
Positive Gross Profit: $2.98B
Positive Operating Income: $196M (GAAP EBIT)
Positive Net Income: $213M
Positive FCF: $719M (HubSpot definition)
Gross margin >= 40%: Yes (83.02%)
Net margin >= 10%: No (5.95%)
FCF margin >= 10%: Yes (20.0%; 23.49% on Koyfin)
Management (ROIC, ROE, ROA) >= 10%: No (9.02%/12.25%/3.52%)
Strong 3Y Revenue Growth: Yes (21.8% per year, FY2022-FY2025)
Revenue Growth Forecast: Yes (+11.1% in 2027)
ROE is increasing: Yes (negative until 2025 -> 12.25%)
ROIC is increasing: Yes (negative until 2025 -> 9.02%)
Revenue surprises in the last 5Y in a row: Yes (20 of 20)
EPS surprises in the last 5Y in a row: Yes (20 of 20)
EPS growth YoY 5Y in a row: No (GAAP losses grew in 2022 and 2023)
Financial Strength (5 of 6):
Total assets ($3.48B) exceed total liabilities ($1.85B) by 1.9x
Negative Net Debt: Yes ($1.07B of net cash)
Low Debt/Equity: Yes (13.8%; 5Y mean: 49.8%)
Debt/Capital: Yes (12.1%; 5Y mean: 30.67%)
Interest coverage (FFO): Yes (852.5x)
Piotroski F-Score: No (5 of 9)
Valuation and Advantage (3 of 4):
Valuation < 5Y mean: Yes (P/S 2.7x vs 9.3x; the P/E mean is distorted)
Valuation < the industry: Yes (P/E 13.5x vs ~19x for XLK)
Does it have a moat: Yes (narrow)
Outperformed the S&P 500 over 5Y: No (-22.88% vs 12.0% CAGR)
Shares (2 of 3):
Insider ownership >= 5%: No (3.74%)
Fewer shares outstanding YoY: Yes (diluted 49.5M vs 52.7M in Q3 2025)
Insider buys in the last 6M: Yes (a director, 925 shares on Aug 10; Shah’s May buy is outside 6M)
Price (2 of 4):
1Y price forecast > 10%: No (+5.6%)
Next 5Y EPS growth estimate (CAGR) > 10%: Yes (29.6%)
DCF Value: Yes, ~$246 (FCF of $720M growing 8-12%, 12% discount rate); only ~$89 if SBC is counted as a cost
Short Interest < 5%: No (8.17%)
Verdict
In my view, HubSpot is a good business at a low price, in the middle of a change it does not control yet. It still grows double digits, earns an 83% gross margin, has $1.07B of net cash, and has bought back 9% of its market cap over the LTM. At the same time, at 13.5x forward earnings against ~23% expected EPS growth, the price assumes that consensus is too high, not that growth stops. My fair prices are $250/$346/$577. At $216.72, HUBS is inside the $175-250 accumulation zone, 37% below the Base Case. The realistic bear case is a business that stabilizes at ~10% growth, while the new CEO spends to rebuild the funnel; then EPS grows ~10% a year, so at 13x, the fair price is ~$162, below today’s price. So the price is inside the zone, but 24% above the $175 MoS price, and it does not cover this bear case. In my opinion, HUBS is a stock to watch until February, not to accumulate yet; two answers decide it: a 2027 revenue guide of ~10% or more, and a confirmed 23-24% margin target under Halligan. What I watch: revenue growth in Q4 and Q1 2027, net new customers, net revenue retention, the global rollout of the new pricing, SBC as a share of revenue, and whether Halligan stops his share sales.
One-Pager
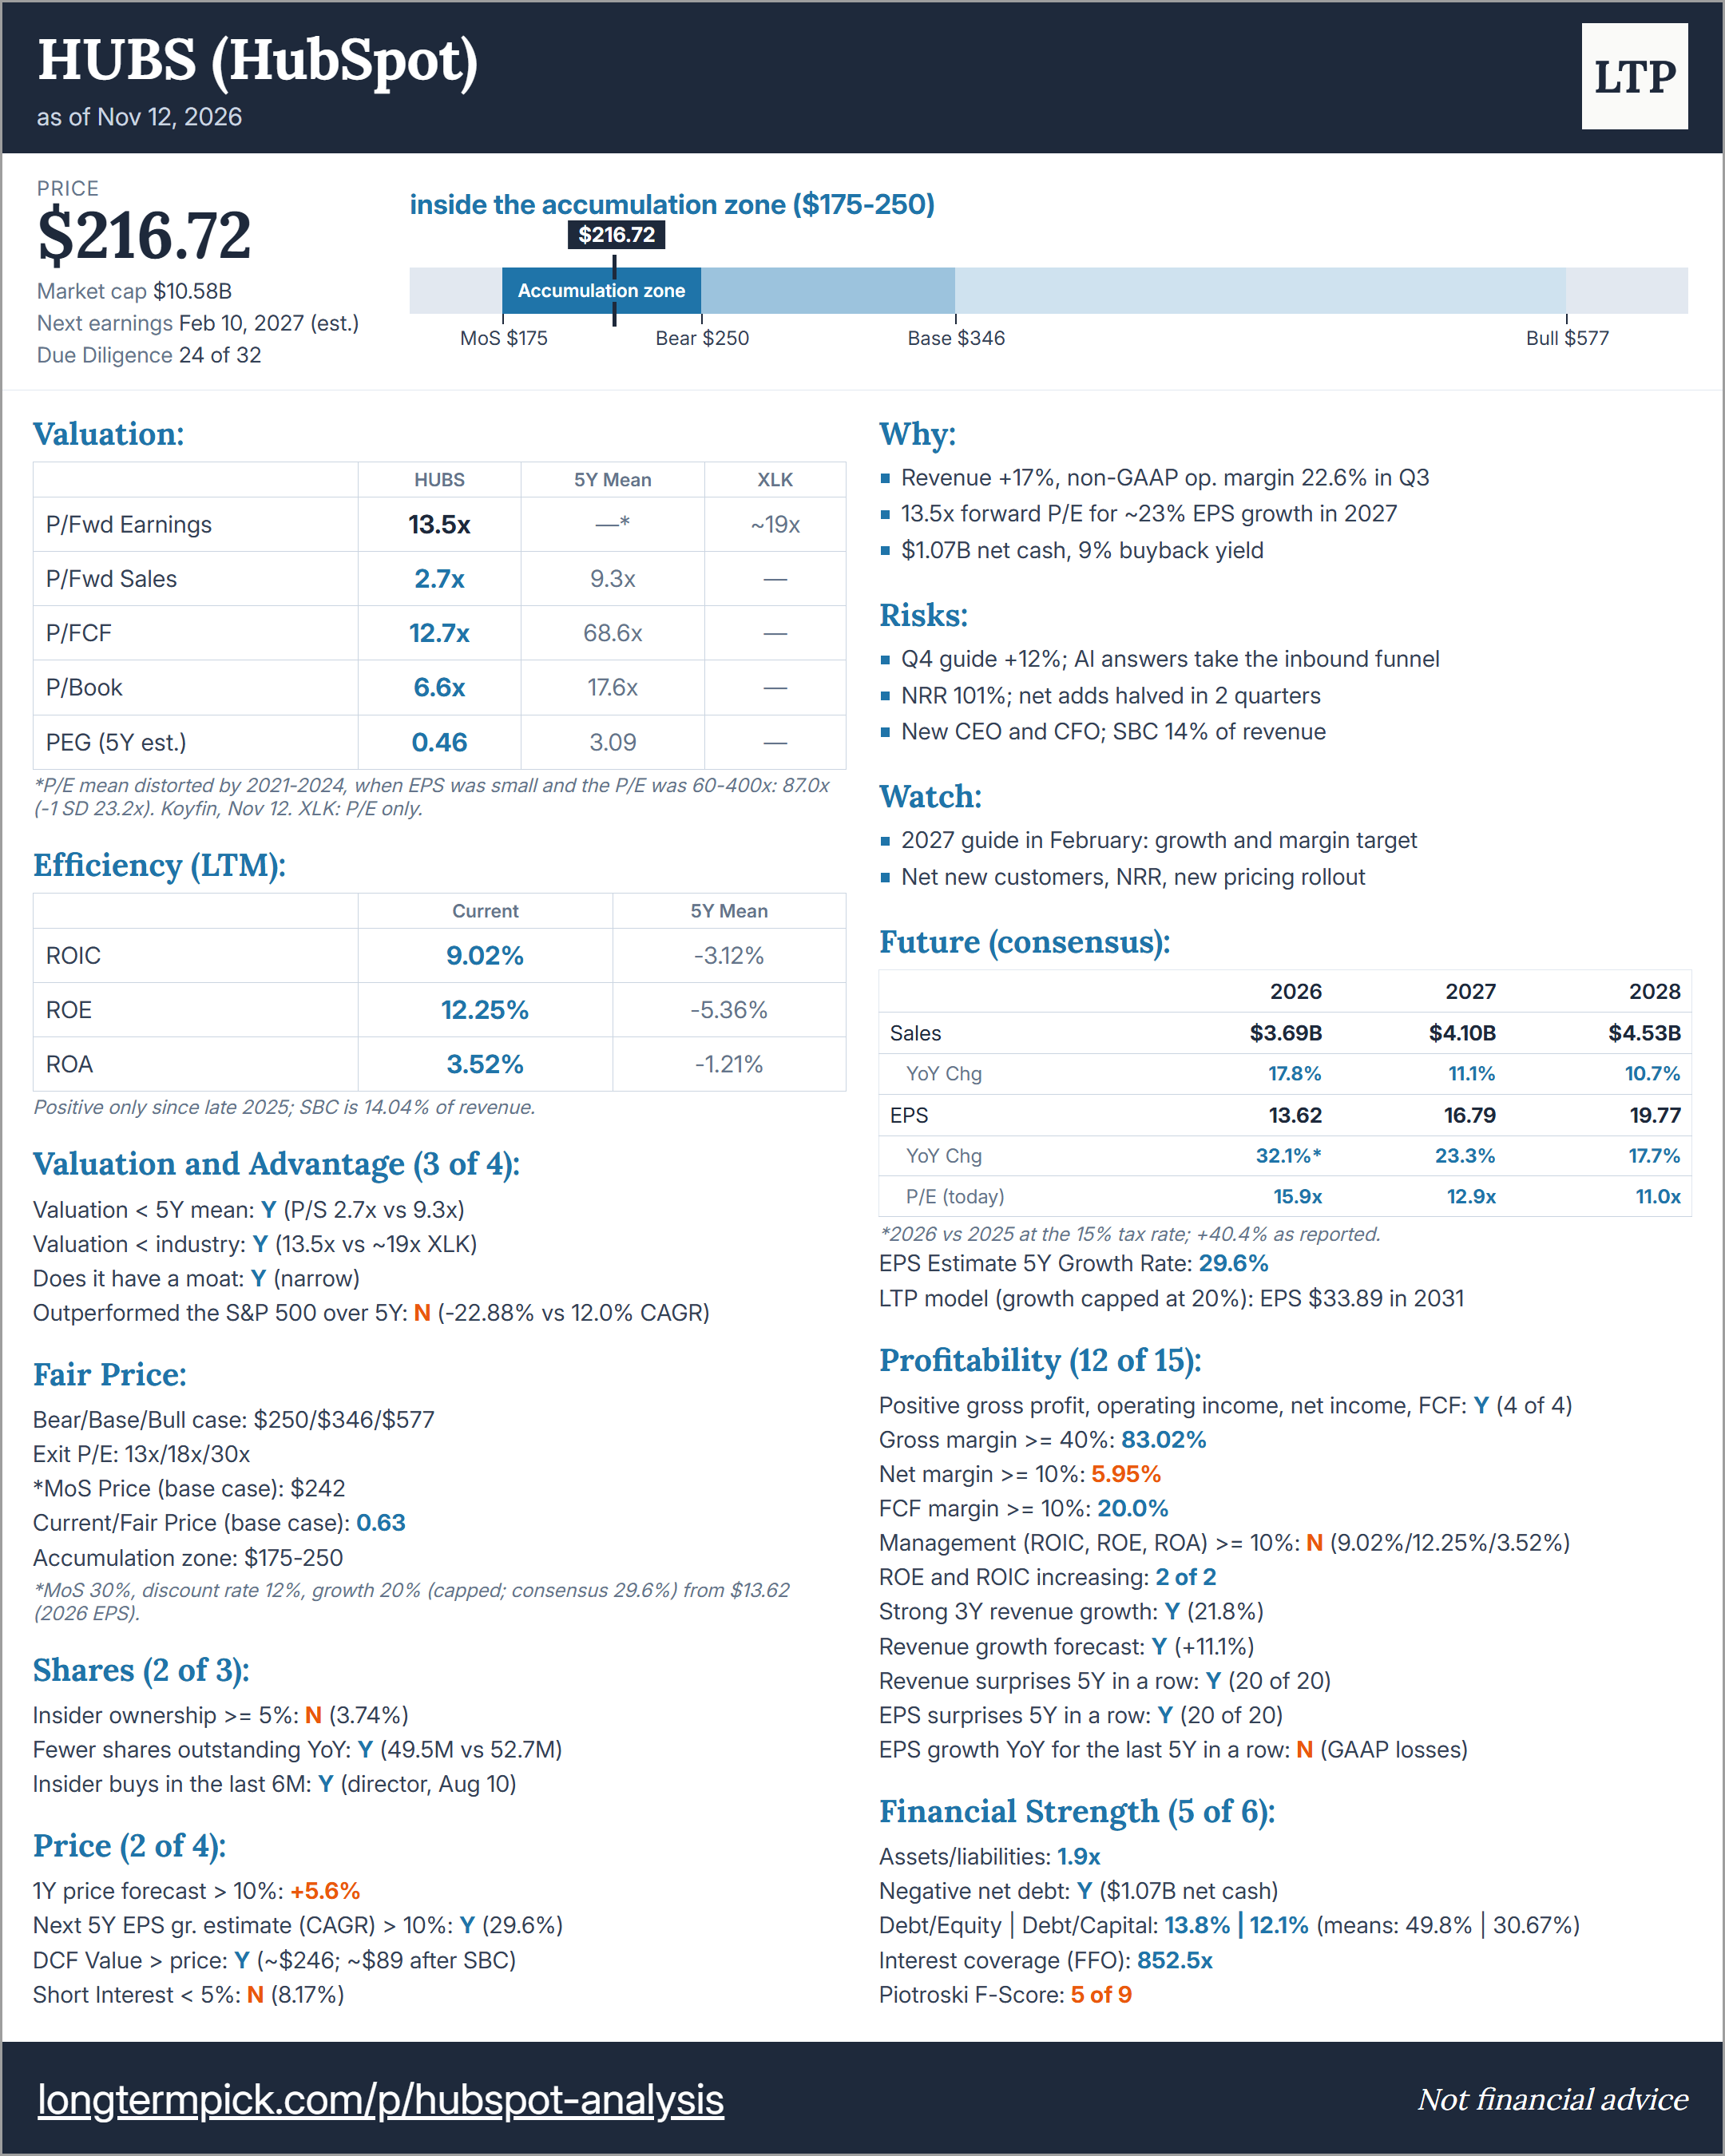
This is not a financial or investing recommendation. It is solely for educational purposes.