
Netflix: From Subscriber Growth to Profit Growth
A comprehensive analysis of Netflix (NFLX).

Content:
• Company Overview
• Market Overview
• Economic Moat
• Business Strategy
• Capital Allocation
• Advantages
• Disadvantages
• Competitors
• Past
• Future
• Current Valuation
• Fair Price
• Due Diligence
• Investment Thesis
Company Overview
IPO Date: May 23, 2002
Market Cap: ~$324.56B
Sector: Communication Services
Industry: Entertainment
Type: Large Growth
Total Number of Employees: ~16,000
Next earnings report: Apr 17, 2026 (estimated, after-market)
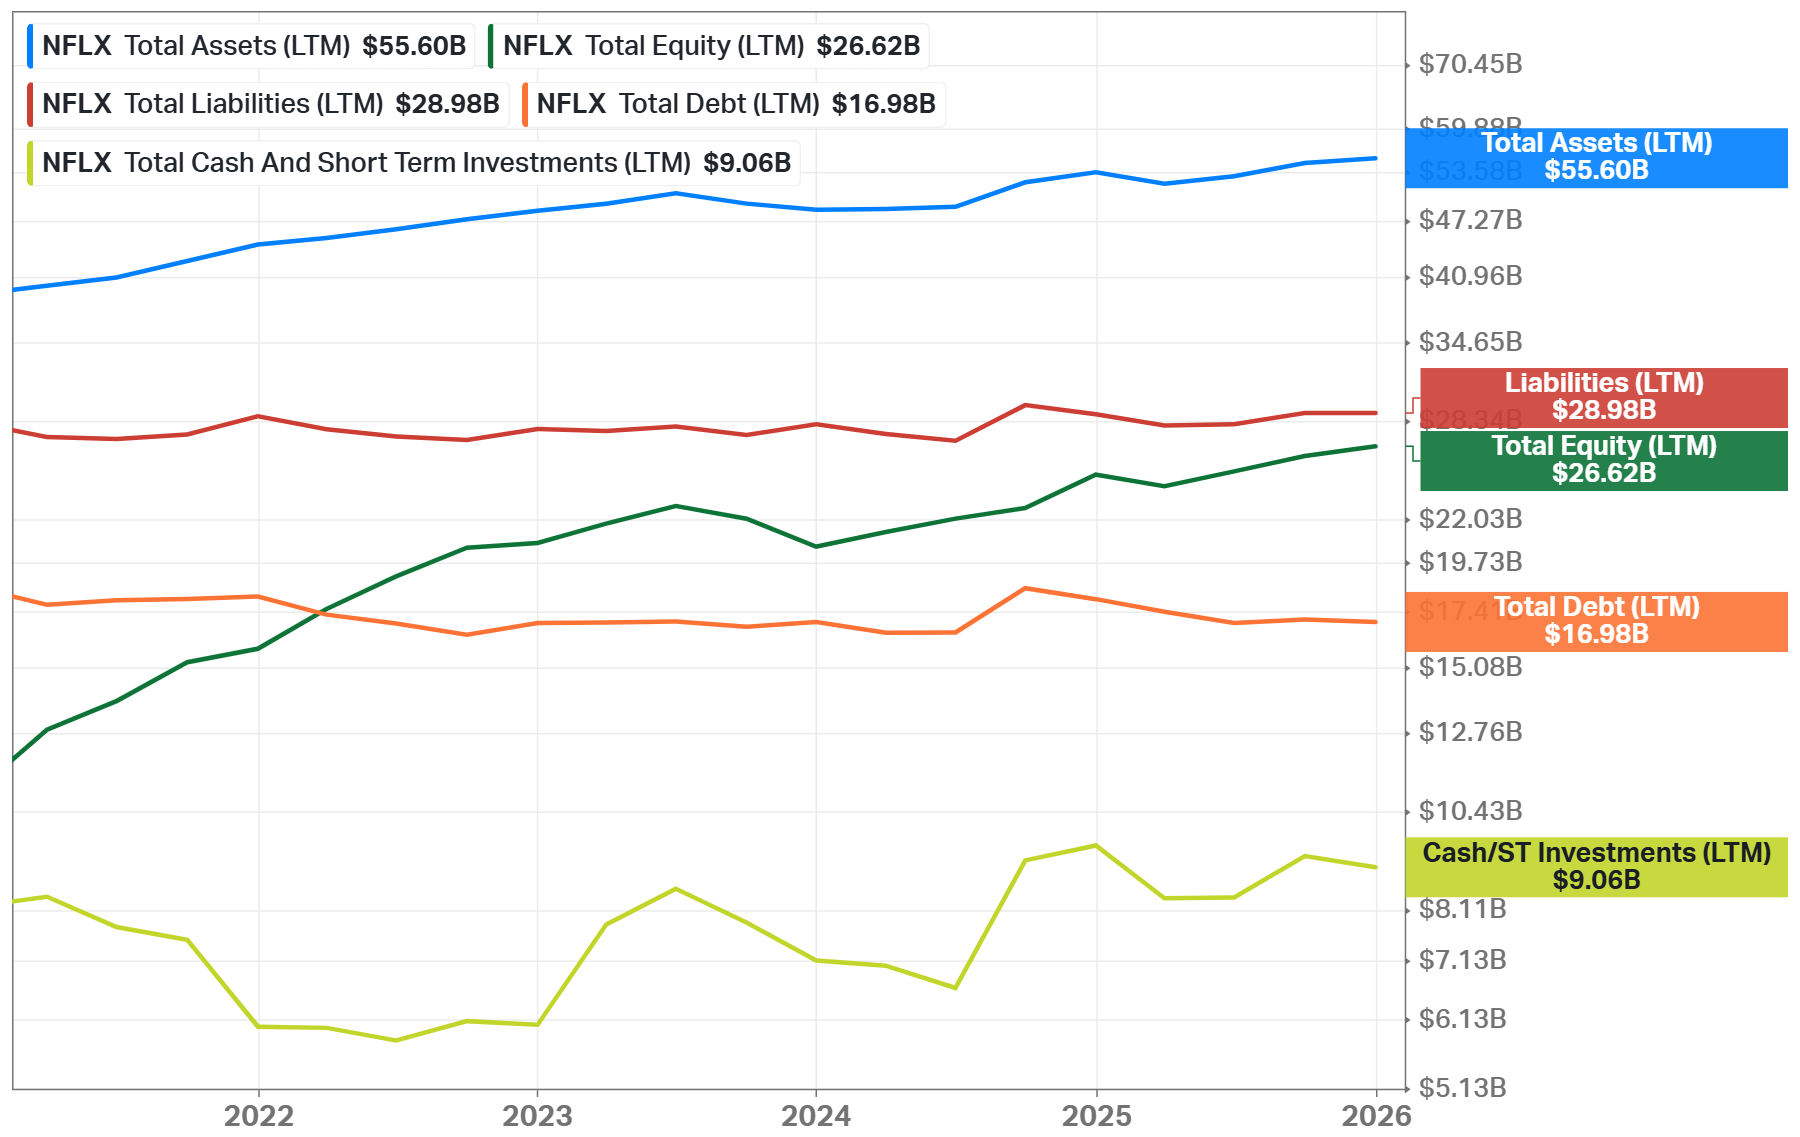
Total Debt: $16.98B
Cash & Investments: $9.06B
Beta: 1.71
Website: www.netflix.com
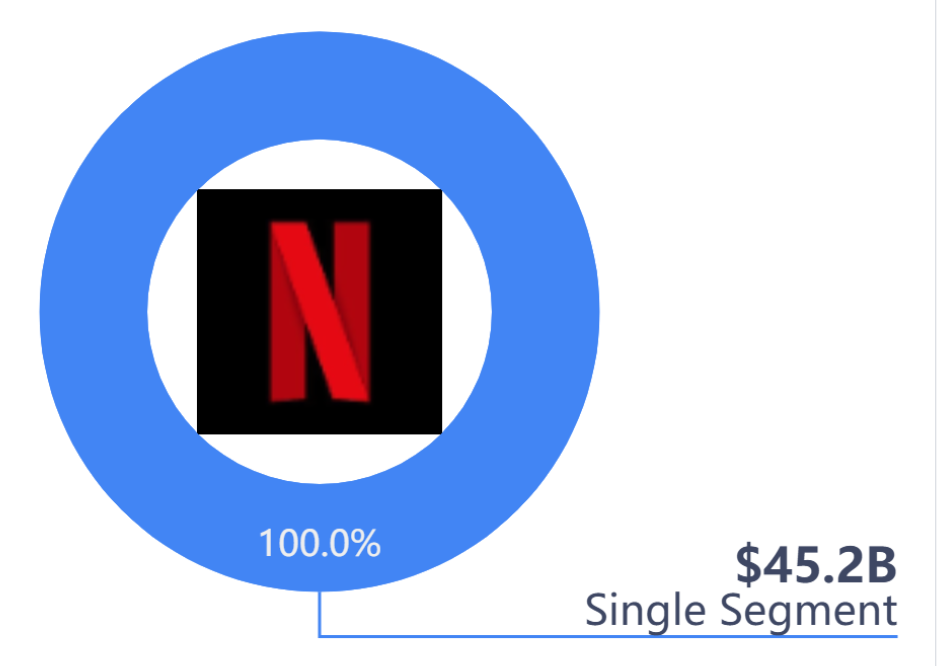
Netflix is a global subscription-based entertainment platform focused on streaming video content. In 2025, the company generated USD 45.2 billion in revenue, representing 16% year-over-year growth. This growth exists because NFLX continues to monetize its scale through pricing actions, advertising, and content expansion rather than relying only on new subscriber additions. The business can grow even as user penetration rises in mature markets.
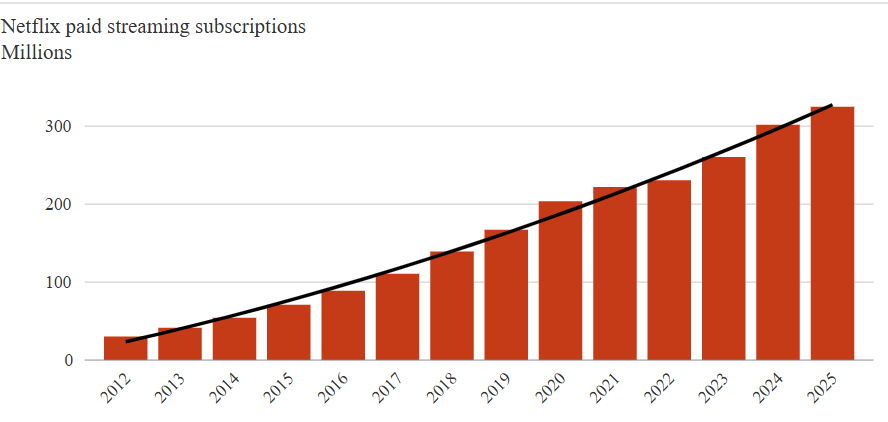
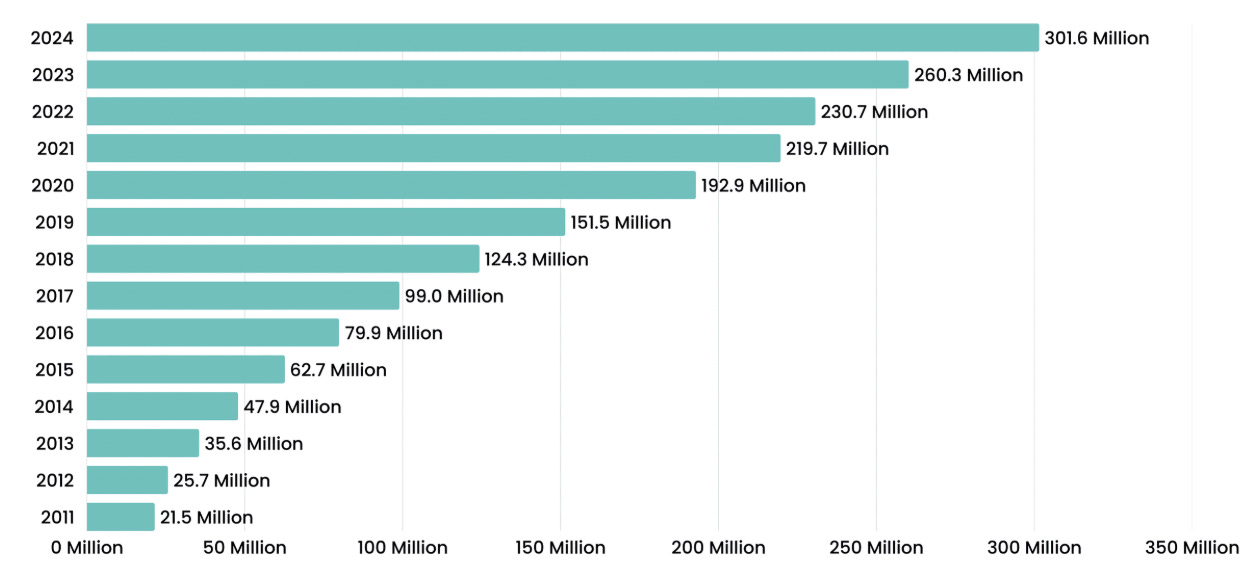
By the end of 2025, NFLX exceeded 325 million paid memberships worldwide. This scale is economically important because it allows Netflix to spread content costs across a very large audience, lowering the average cost per viewer. The company now has an audience approaching one billion people globally when shared accounts and household viewing are considered. This supports long-term engagement stability and improves monetization efficiency.
Leadership is shared between Co-Chief Executive Officers Ted Sarandos and Greg Peters. Sarandos is responsible for content strategy, creative partnerships, and global programming decisions, while Peters controls product development, monetization, partnerships, and long-term growth initiatives. This structure reflects that Netflix operates at the intersection of entertainment and technology, separating creative risk from commercial execution.
The company produces content through a hybrid model that combines internally commissioned originals with externally produced and licensed titles. NFLX finances and commissions series and films from independent production studios, global creators, and established showrunners, often retaining long-term distribution rights. In addition, Netflix licenses second-run and pay-one window films from major studios to broaden its catalog. This model allows Netflix to control intellectual property in key franchises while maintaining flexibility through partnerships. The approach supports geographic diversification of content and reduces dependence on a single creative channel.
Netflix works with a broad set of third-party partners. For instance, in advertising, the company integrates with Amazon’s platform globally and AJA’s platform in Japan, allowing advertisers to access the company’s inventory through established systems. On the content side, NFLX maintains licensing relationships with Sony Pictures Entertainment, Universal, Paramount, and other studios to complement its original content slate. These partnerships expand content breadth while keeping Netflix independent from owning legacy media assets.
To Read: Japanese anime studio MAPPA announced a strategic partnership with Netflix
Market Overview
The streaming industry is now in a mature expansion phase rather than an early adoption phase. According to PwC’s Global Entertainment & Media Outlook 2025–2029, the broader entertainment and media sector is expected to grow at roughly a 3.7% compound annual growth rate (CAGR) through 2029, reflecting slower but stable long-term demand as markets saturate. Most developed households already subscribe to digital media services, so future growth depends more on monetization efficiency than on new users.
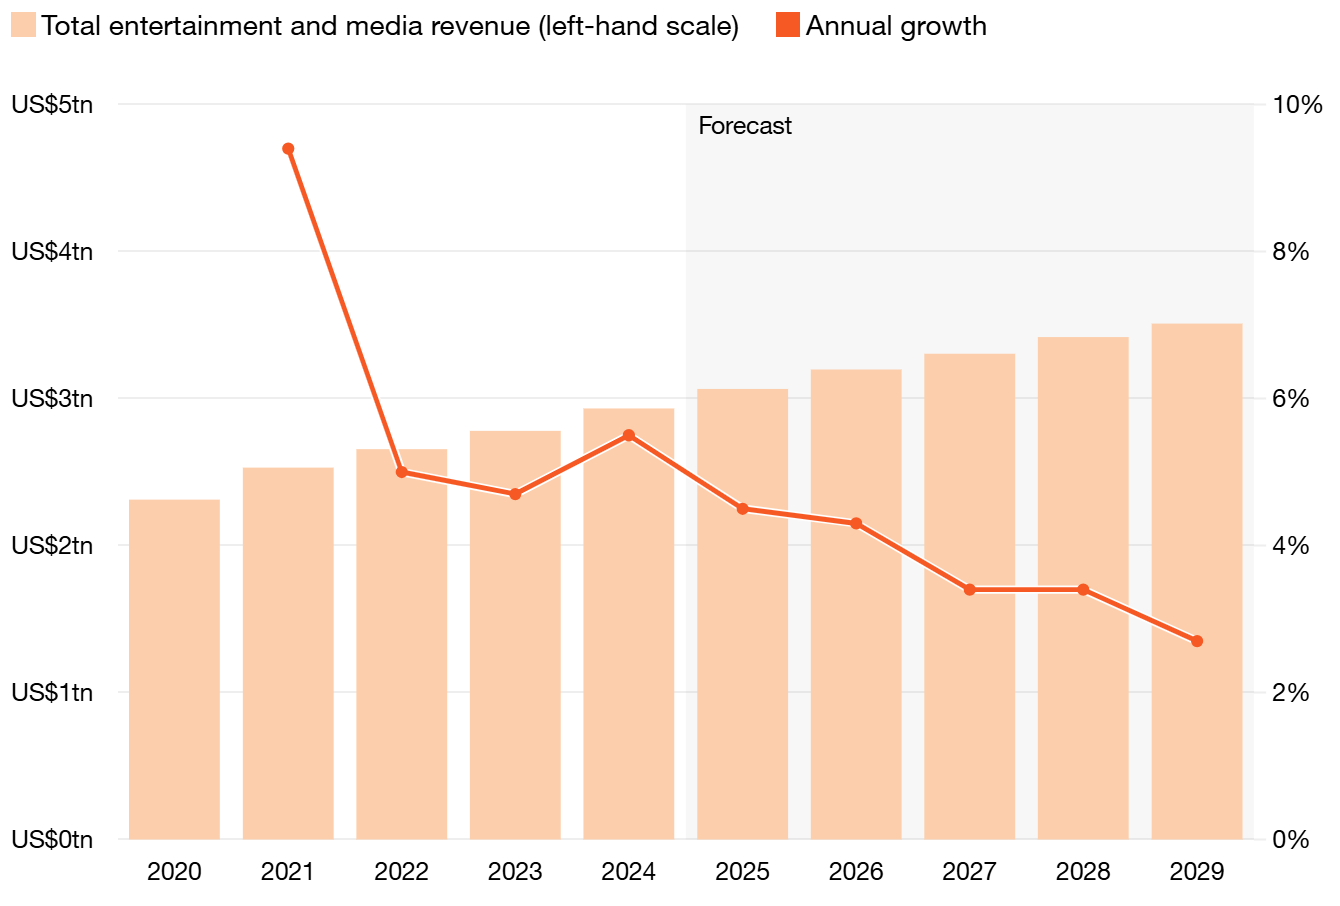
Advertising is becoming the main growth driver of the industry. PwC research highlights that digital advertising formats are rapidly increasing their share of total media revenue. Revenue growth increasingly comes from monetization per viewer rather than subscriber expansion.
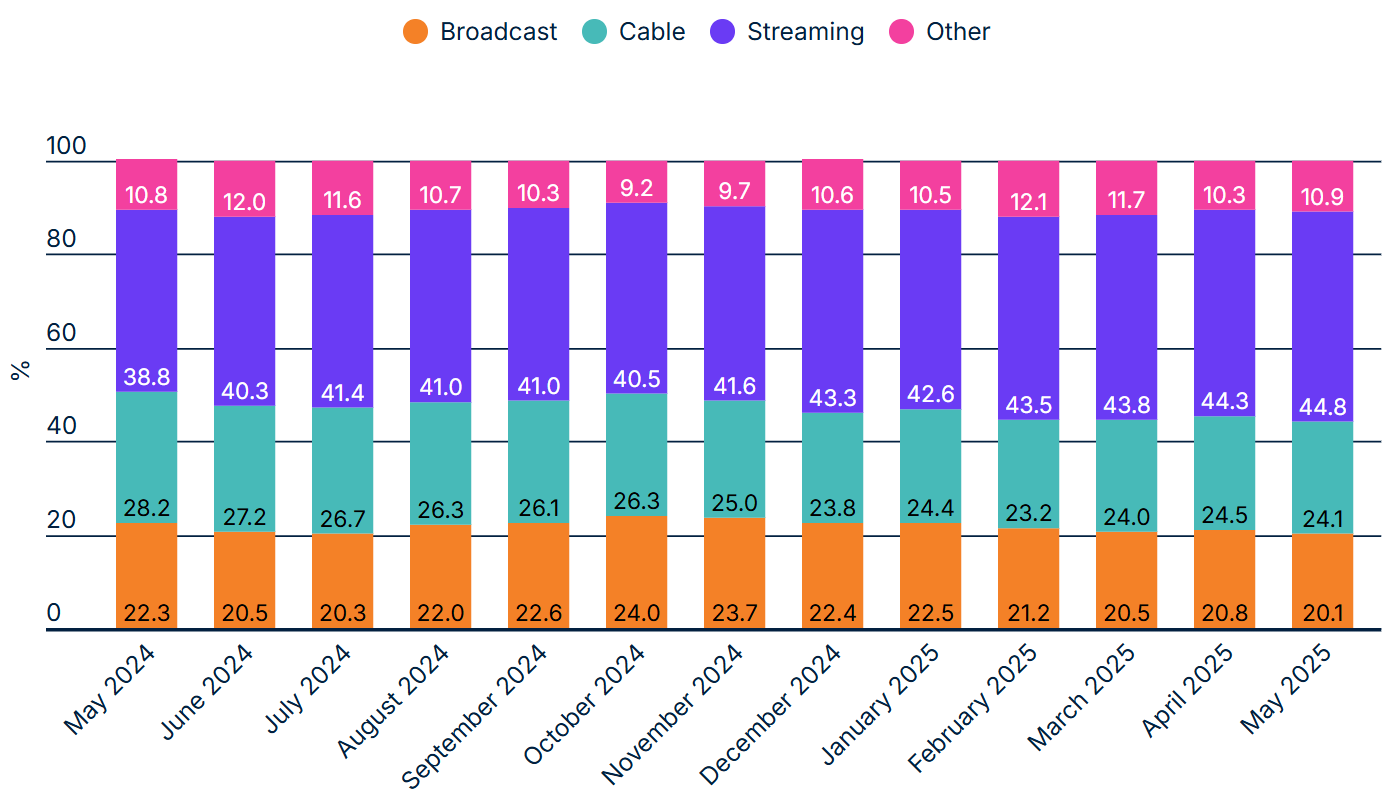
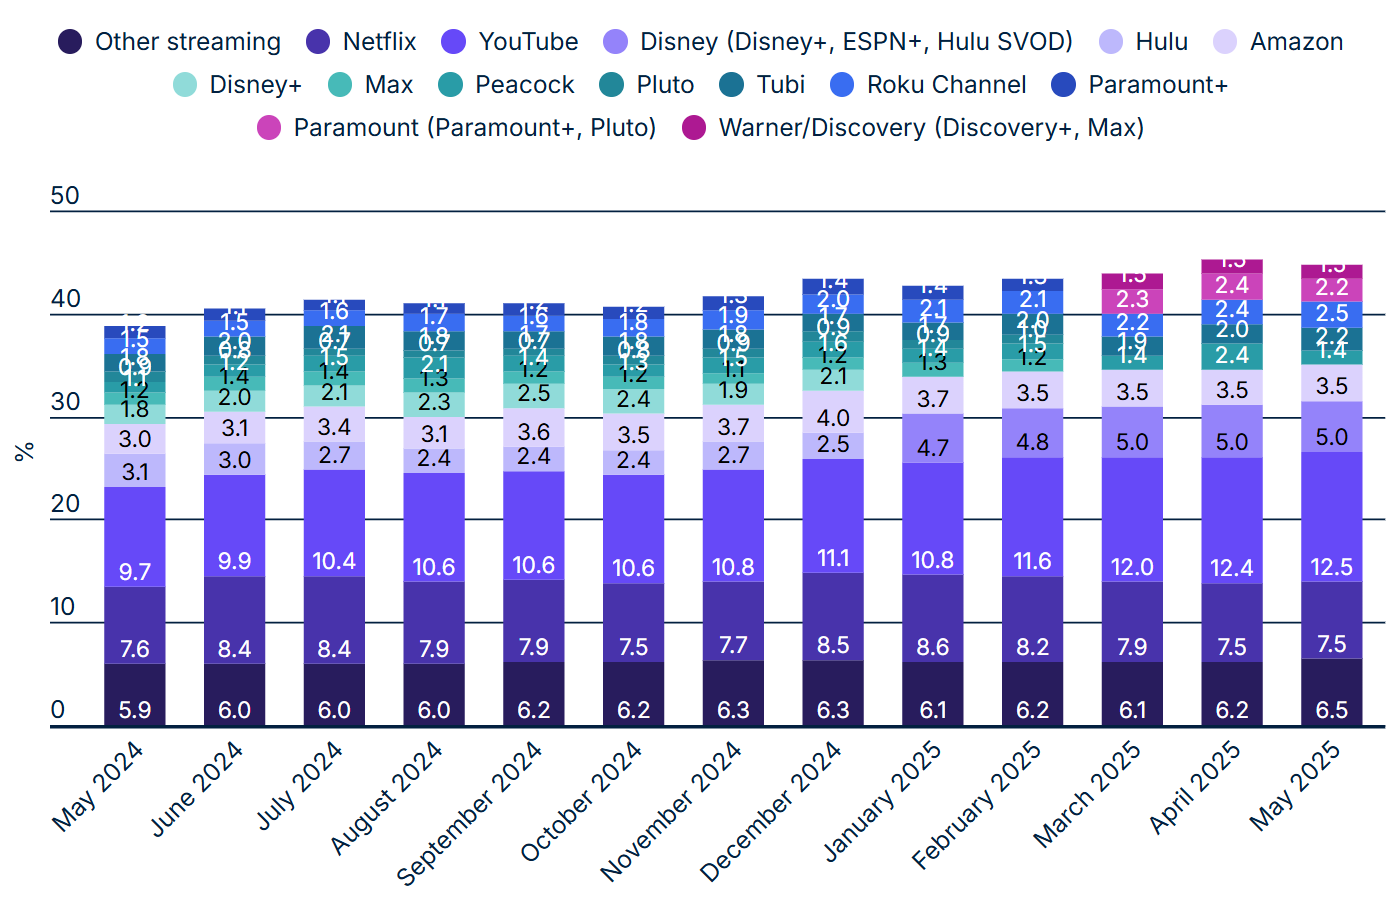
Consumer behavior already reflects a structural shift toward streaming. Nielsen data shows streaming captured about a record 44.8% of total TV viewing in mid-2025, surpassing both cable and broadcast television combined. This transition indicates streaming is no longer a substitute product but the primary viewing format, supporting durable demand for major platforms.
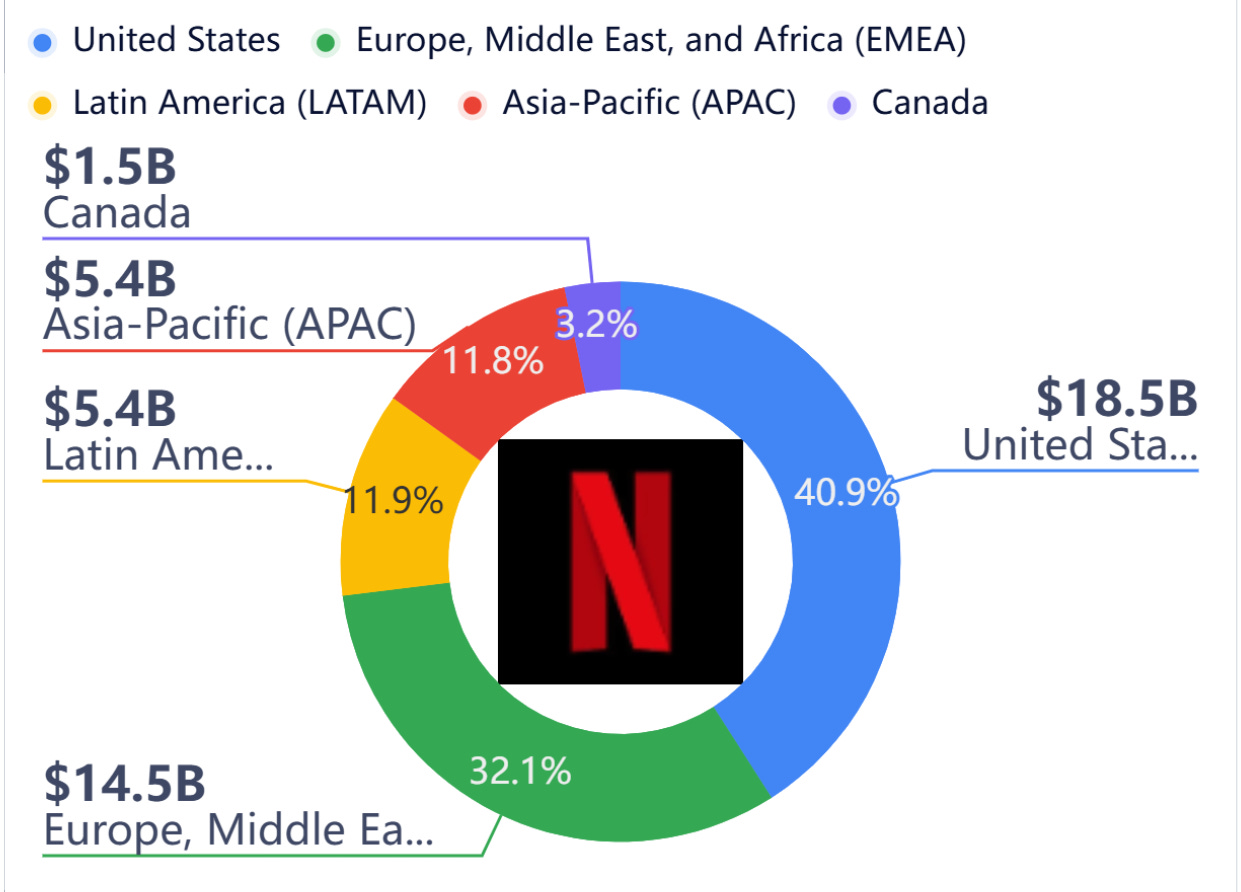
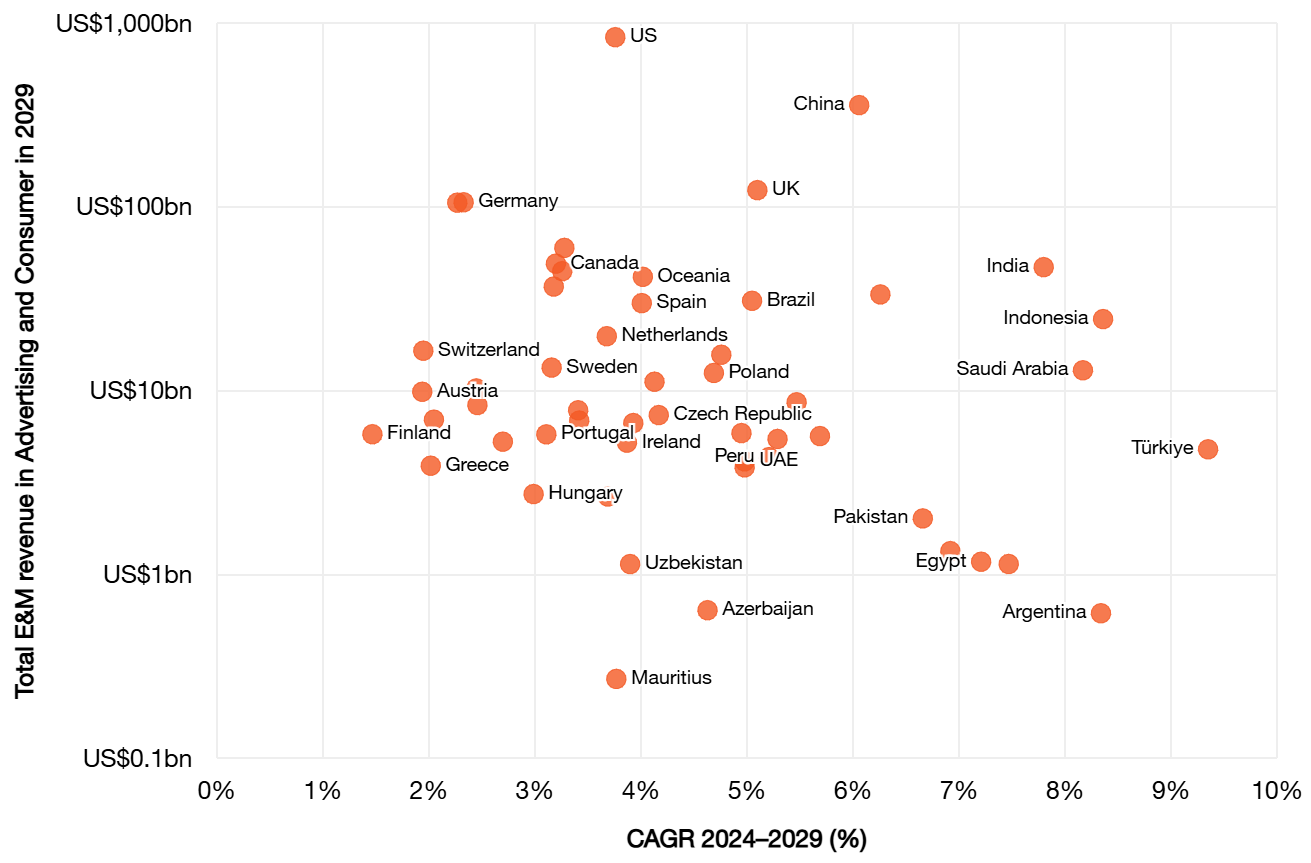
Growth is also geographically unequal. Mature markets show slower subscription expansion, while emerging regions contribute most new viewers due to improving internet access and smartphone adoption. This dynamic supports continued scale growth but at lower revenue per user, making pricing strategy and advertising adoption critical for profitability.
Economic Moat
NFLX has a narrow economic moat driven by intangible assets and scale. The moat exists because the company built a large global subscriber base before most competitors entered the market, allowing it to move past the heavy early-stage cash burn typical of streaming platforms. This early scale reduced long-term unit economics risk and remains positive for sustaining returns above the cost of capital.
Engagement data is a core moat component. In the second half of 2025, Netflix users watched 96 billion hours of content globally. This volume is driven by a steady flow of content across genres and regions, lowering dependence on individual franchises. High engagement supports advertising demand and lowers churn risk.
The moat remains narrow because the content itself is not exclusive in the long term. Competitors with sufficient capital can fund large content libraries and bid for talent. It limits excess returns and explains why Netflix must continuously reinvest to defend its position.
Business Strategy
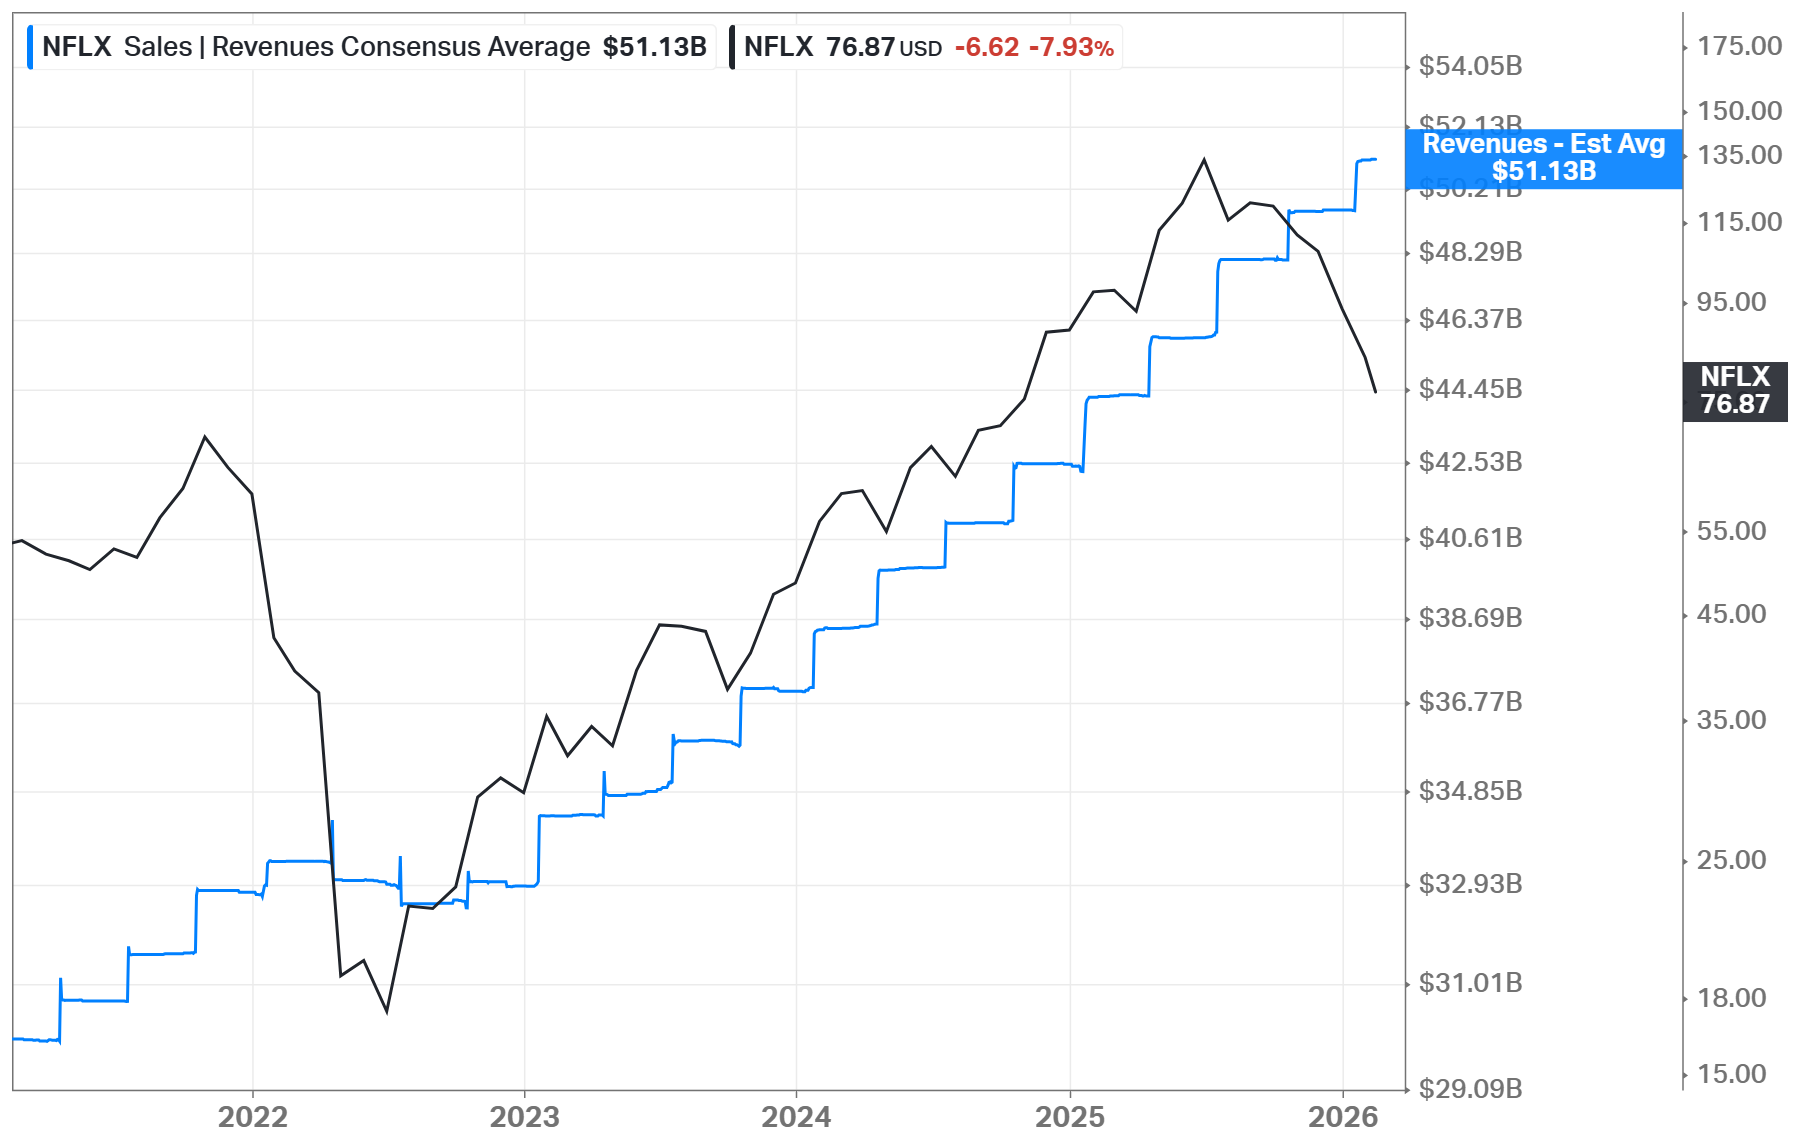
Netflix’s strategy focuses on organic growth supported by steady content investment and expanding monetization tools. For 2026, management guides revenue between USD 50.7 billion and USD 51.7 billion, implying year-over-year growth of 12% to 14%. This moderation reflects that NFLX is operating from a much larger revenue base. Growth remains strong for a company of this size.
Advertising is a central strategic component. In 2025, advertising revenue exceeded USD 1.5 billion, rising more than 2.5 times year-over-year. This growth exists because Netflix expanded its ad-supported tier across more markets and improved advertiser tools. Advertising increases revenue per user without requiring proportional increases in content spending.
Netflix is also expanding into live events, games, and video podcasts. These initiatives exist to deepen engagement and extend time spent on the platform. The short-term financial impact is neutral, but the long-term impact is positive if these formats improve retention and advertising inventory quality.
To Read: Netflix is ‘judiciously’ expanding into interactive experiences

Capital Allocation
The company does not pay dividends, which reflects management’s priority to reinvest capital into content, product development, and advertising infrastructure rather than return cash directly to shareholders. The absence of dividends is positive for long-term growth investors, as retained capital is directed toward expanding competitive advantages rather than distributing cash prematurely.
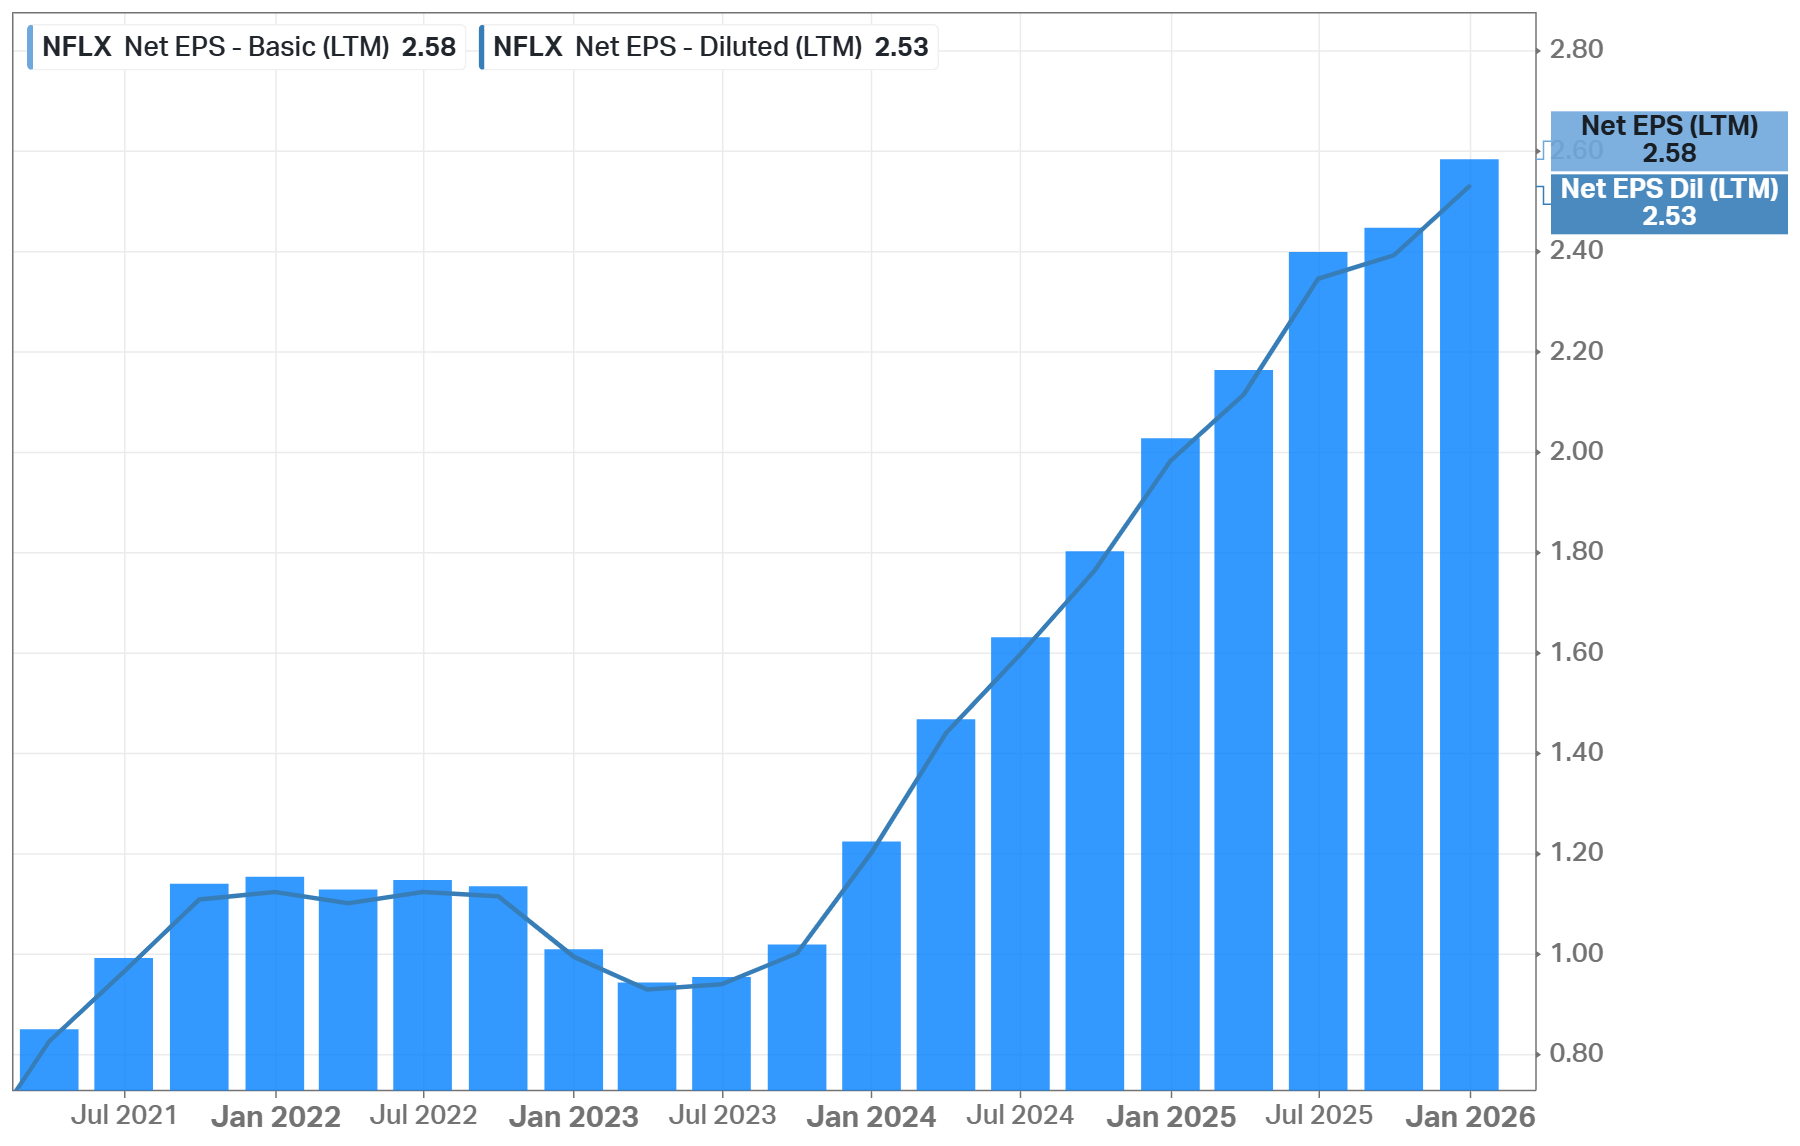
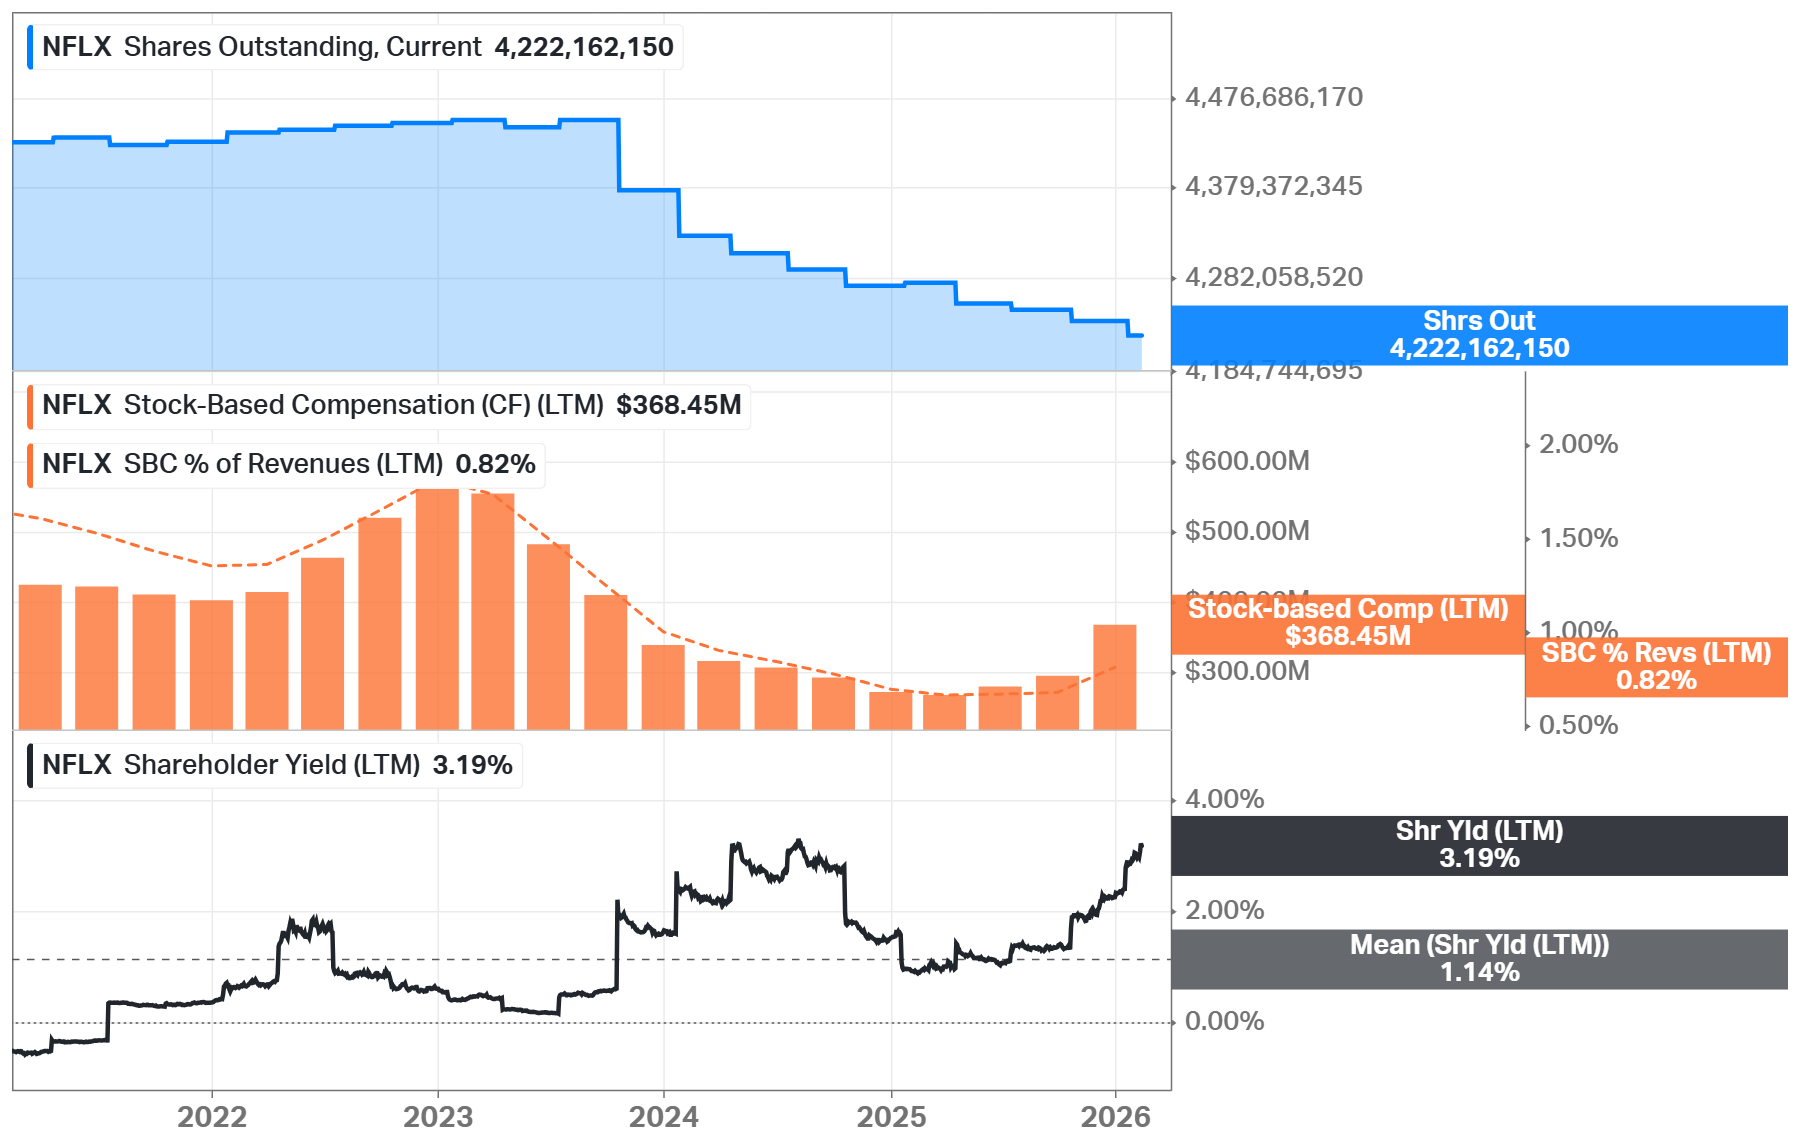
Netflix also continues to reduce its diluted share count gradually. This reduction reflects management's decision to use excess cash for share repurchases when appropriate, which supports earnings per share growth over time.
In addition, Netflix is actively pursuing strategic expansion through acquisitions, including efforts to close a transaction involving Warner Bros.
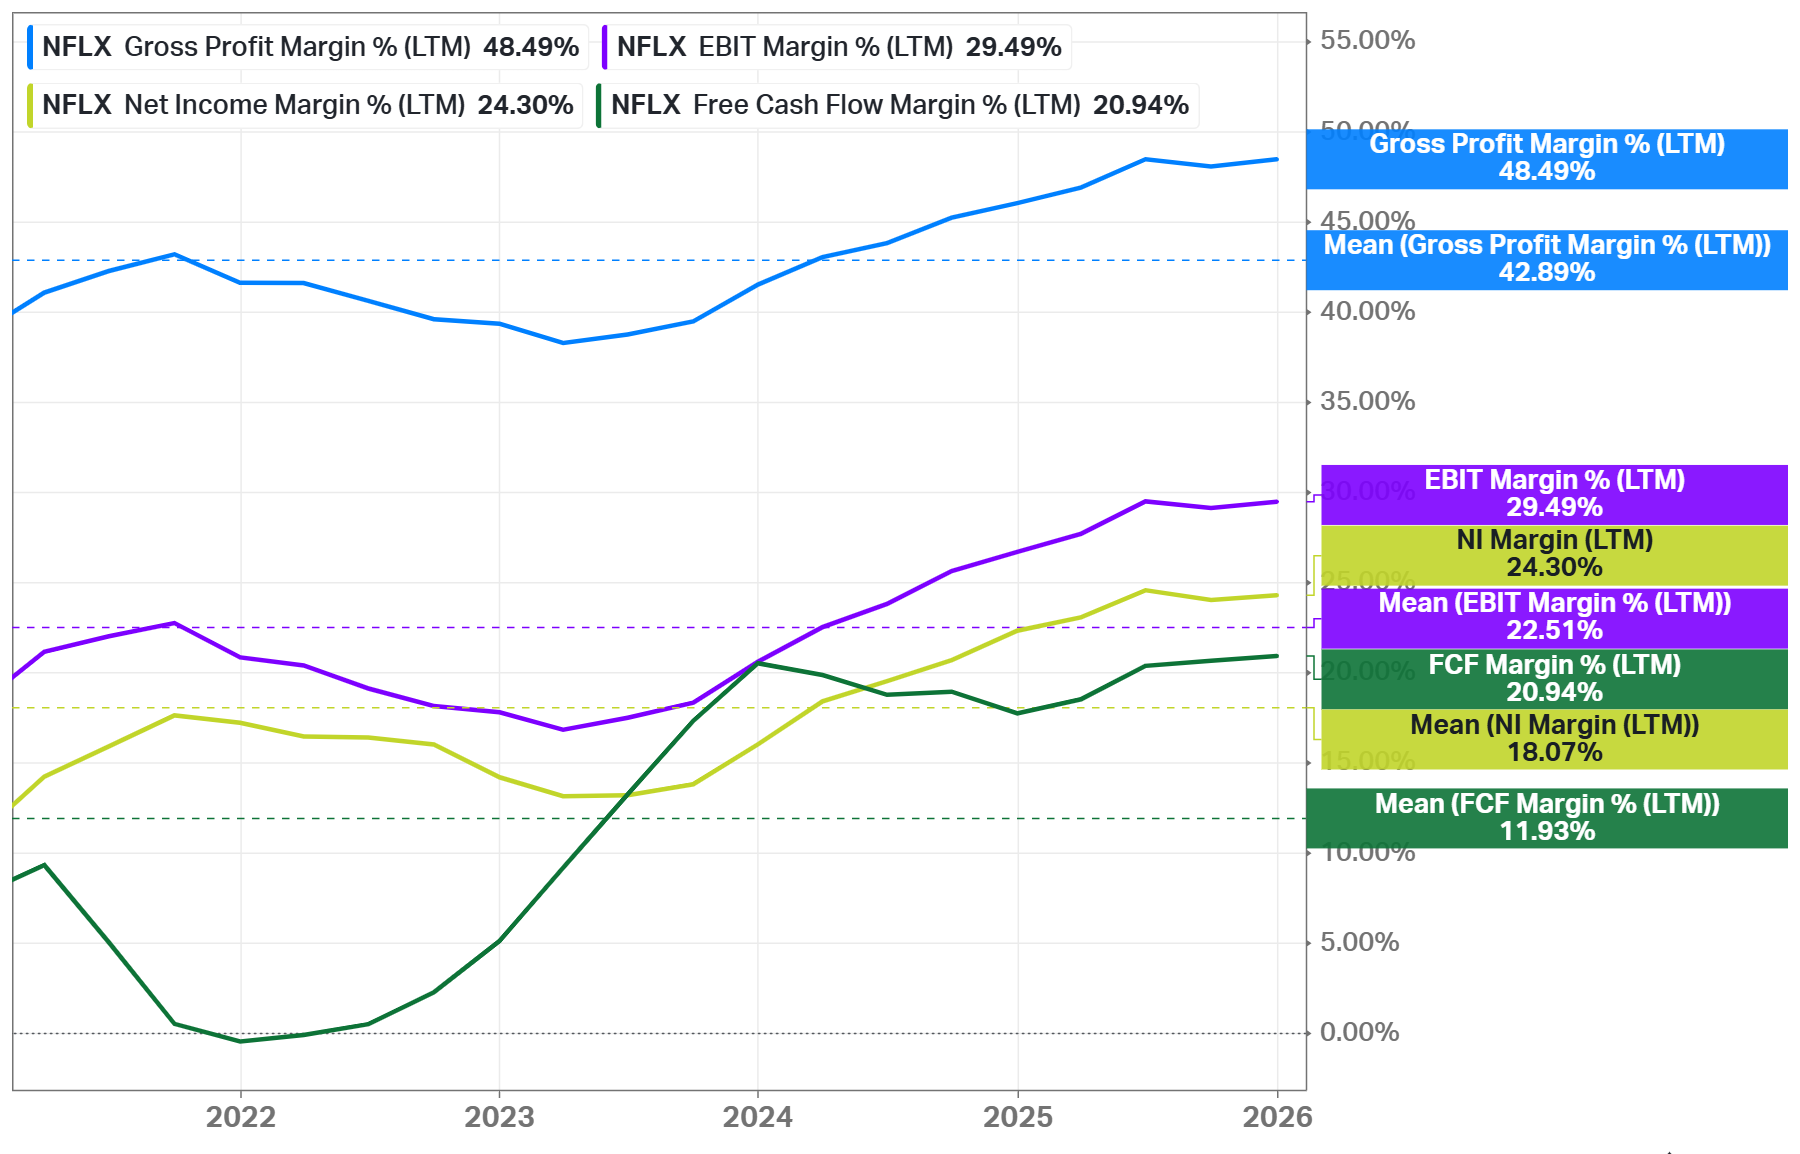
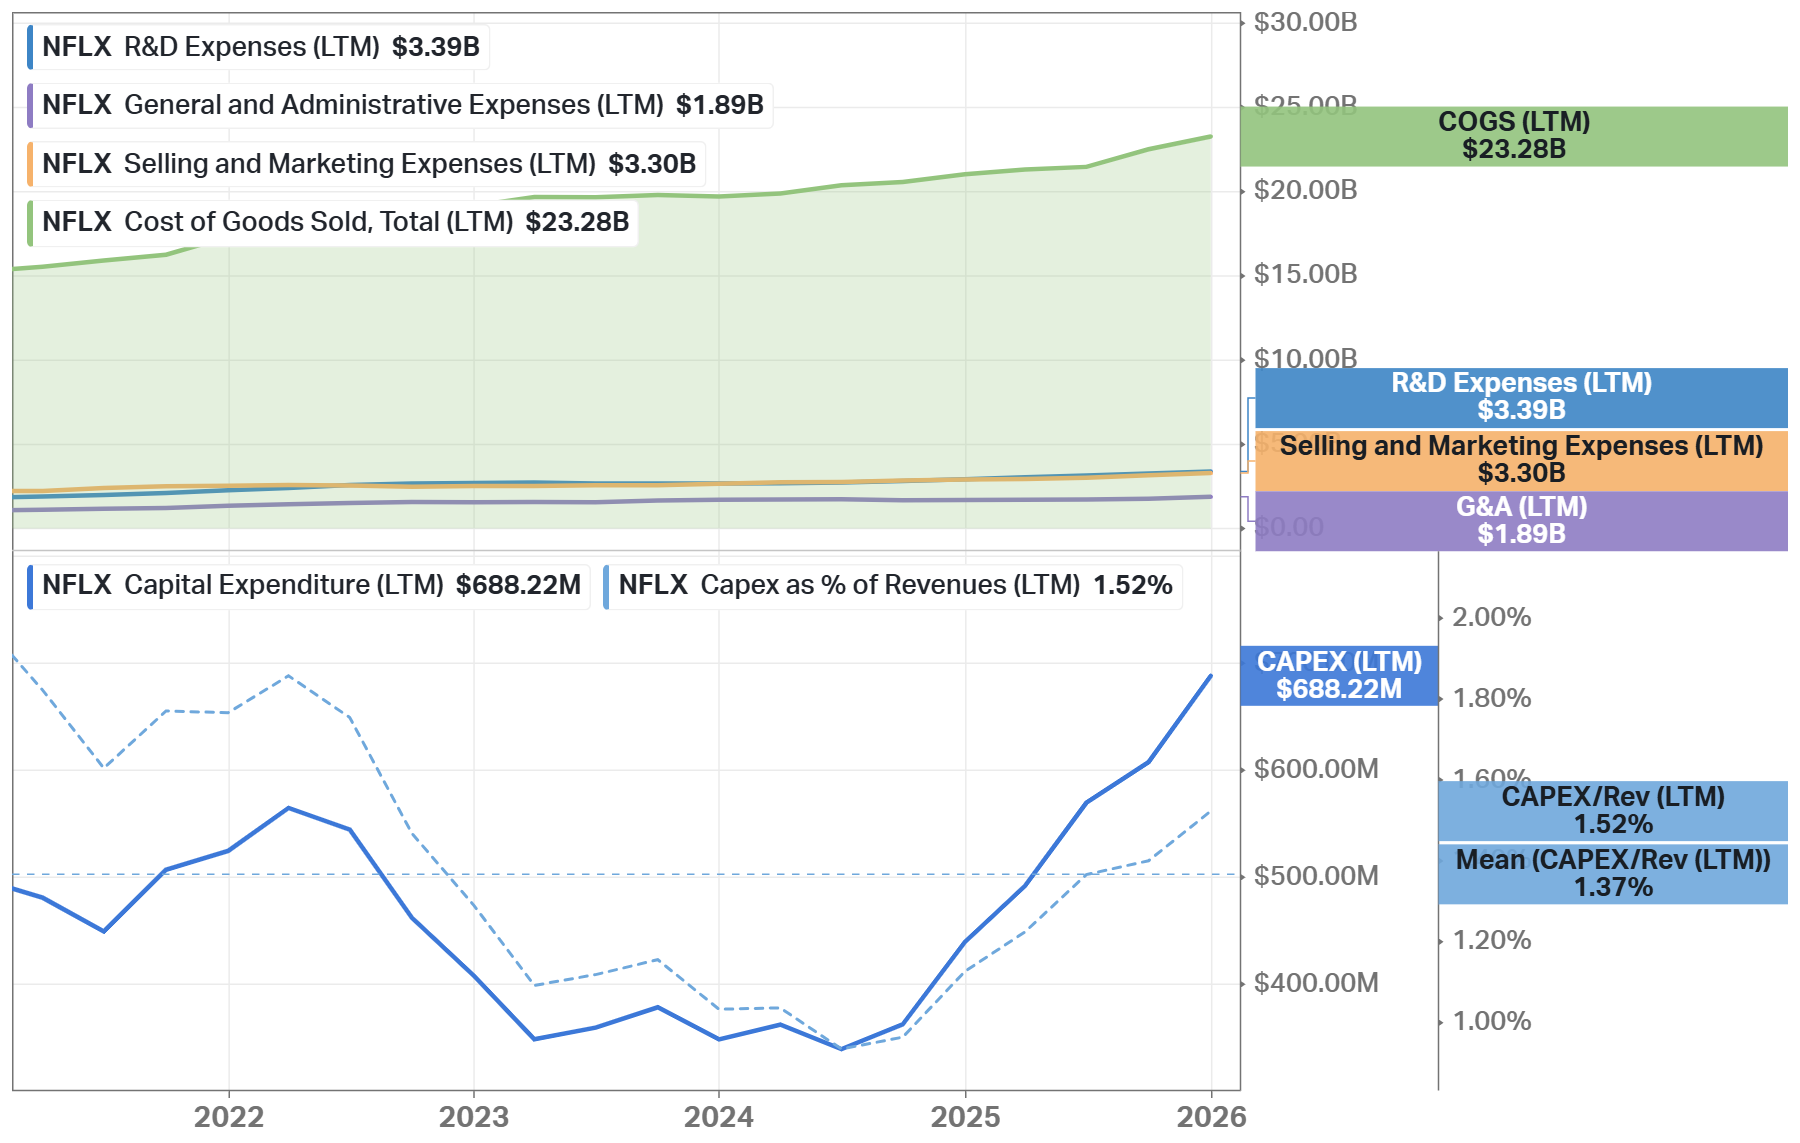
In 2025, the company achieved an operating margin of 29.5%, an improvement of three percentage points compared with the prior year. This expansion reflects revenue growth outpacing operating cost growth. It shows operating leverage in a content-heavy business.
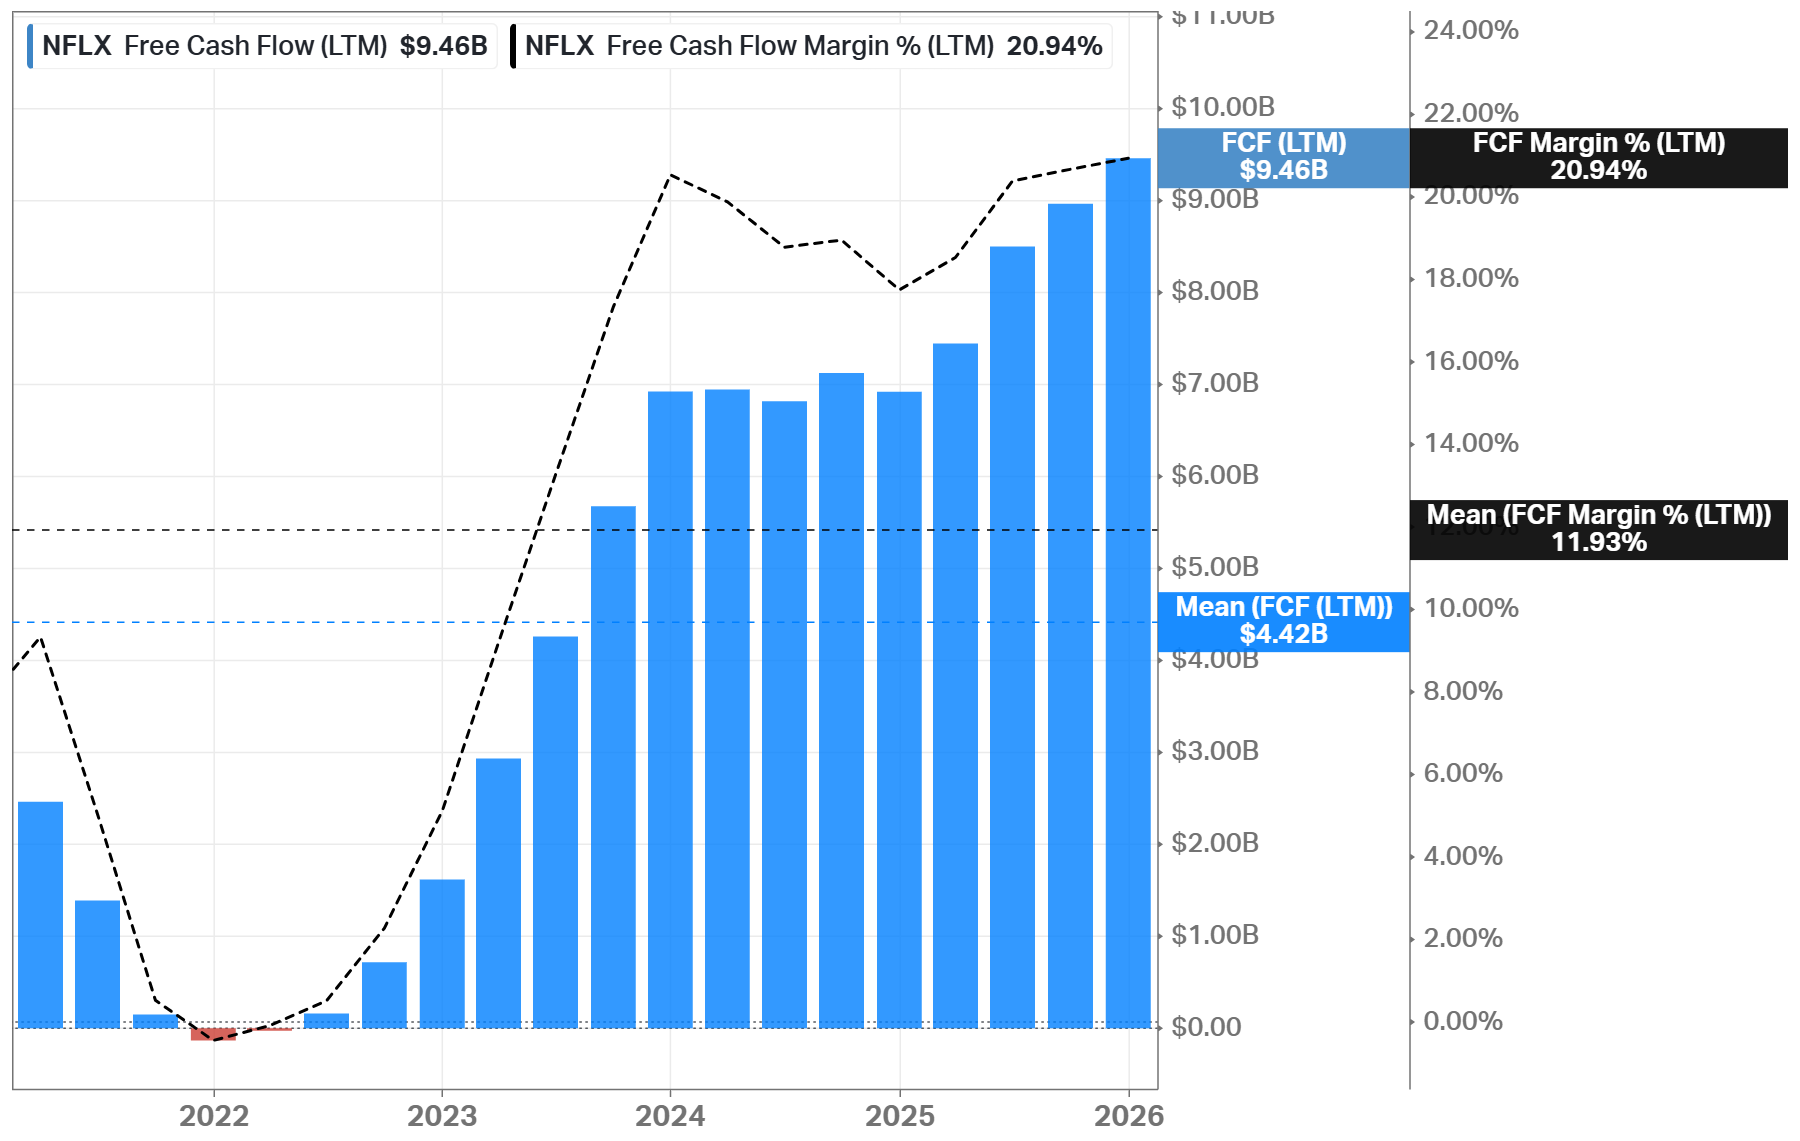
Free cash flow generation has improved significantly. Management expects approximately USD 11 billion in free cash flow in 2026. This improvement comes from revenue expanding faster than content cash spending. It reduces reliance on external financing and increases strategic flexibility.
Content amortization is expected to grow by around 10% in 2026. This increase reflects a fuller and more balanced release slate. The impact is neutral, as content remains the primary driver of engagement and long-term revenue stability.
Analyst’s Note:
Content amortization is the accounting process of spreading the cost of produced or licensed content (like movies, TV shows, or software) over its estimated useful life rather than expensing it all at once. It matches the expense to the revenue generated over time, usually over 10 years or less, typically using a straight-line method based on viewing patterns.
Advantages
Unmatched global scale, serving hundreds of millions of paying households. This matters economically because fixed content costs are spread across a very large base, lowering average cost per viewer and improving returns on successful titles.
The advertising model. Management expects advertising revenue to roughly double again in 2026. This matters because each viewing hour becomes more valuable without raising subscription prices.
Strong engagement supports pricing power. Viewing of branded originals increased 9% year over year in the second half of 2025. This matters because premium content supports future pricing actions.
Operational focus reduces complexity. Netflix avoids managing declining legacy assets such as cable networks. This matters because capital can be reinvested into growth rather than maintenance.
Improving profitability supports valuation durability. Operating income grew 30% year over year in the fourth quarter of 2025. This matters because profit growth exceeded revenue growth.
Disadvantages
Revenue growth is structurally decelerating. Guidance implies mid-teens growth rather than historical acceleration. This is negative for valuation multiples.
The United States and Canada markets are mature. Household penetration is already high. This limits future user growth and increases reliance on pricing and advertising.
Content spending remains structurally heavy. Streaming content obligations exceeded USD 20 billion. This limits margin expansion during weaker content cycles.
International exposure increases volatility. Currency and tax issues can distort reported results. This is negative for earnings predictability.
Competition for leisure time is intense. Streaming competes with gaming, social media, and live entertainment. This limits long-term pricing flexibility.

Competitors
Below are companies whose value depends directly on streaming profits, such as Disney, Warner Bros. Discovery, and Comcast. HBO Max and Paramount+ are covered through their parent companies, while services like Apple TV+ are excluded because streaming is only a small part of their broader ecosystem. Amazon Prime Video affects pricing and content costs but is not treated as a main competitor since its results are driven mainly by retail membership rather than media profits.
Disney operates with a wide economic moat supported by franchises and physical assets. This matters because Disney can subsidize streaming losses through parks and merchandise, while Netflix relies almost entirely on streaming returns.
Warner Bros. Discovery combines streaming with legacy television and film assets. This structure creates internal cash flow pressure from declining businesses. Netflix avoids this burden, improving capital efficiency.
Comcast integrates streaming with broadband and cable services. This bundling reduces churn but dilutes streaming profitability. Netflix’s standalone model keeps unit economics transparent.
Amazon Prime Video is bundled within a broader membership offering. This weakens standalone economics and obscures content returns. Netflix’s pricing reflects direct consumer willingness to pay.
Past
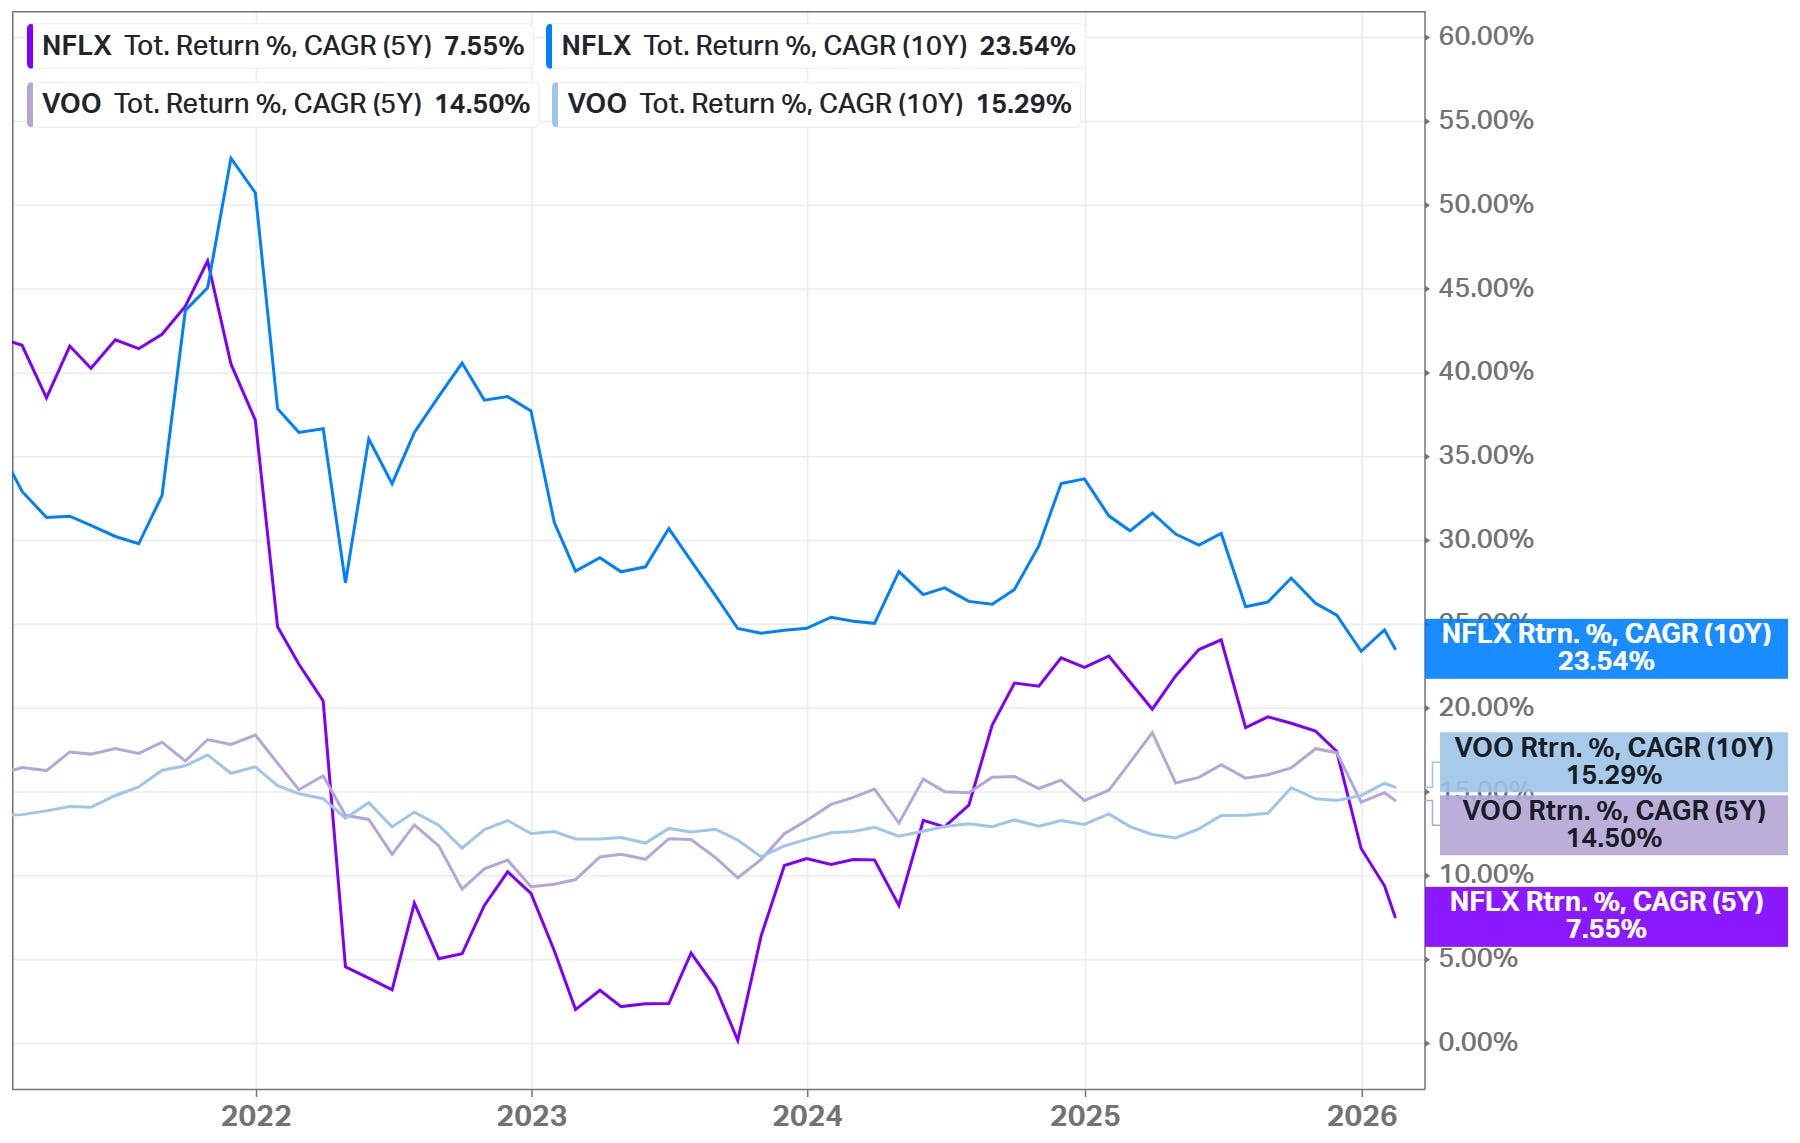
Here are the 5- and 10-year CAGR returns for NFLX, compared to the S&P 500 (VOO).
Below are some significant recent events.
Warner Bros. Discovery Transaction: In January 2026, Netflix amended its agreement with Warner Bros. Discovery to an all-cash structure and publicly supported the board’s commitment to the merger process. The deal originally announced in December 2025 valued the target at about USD 82.7 billion enterprise value. The transaction signals Netflix’s willingness to use large-scale strategic acquisitions to expand its content library and intellectual property portfolio, which could materially strengthen long-term competitive positioning.
Stock Split Announcement: In October 2025, the board approved a ten-for-one forward stock split. The action does not change company fundamentals but improves trading accessibility for smaller investors and often increases liquidity and retail participation.
Physical Experience Expansion: During 2025, Netflix opened themed entertainment locations branded as “Netflix House,” including Philadelphia and Dallas, with a future Las Vegas location planned. This initiative indicates a strategy to extend intellectual property beyond digital viewing into physical experiences and merchandising ecosystems, creating additional monetization channels outside subscriptions.
Mini-Tender Offer Rejection: In December 2025, Netflix recommended that shareholders reject an unsolicited mini-tender offer from TRC Capital. The company stated the offer price was below market value, reinforcing management’s focus on protecting shareholder value and discouraging opportunistic share accumulation.
Toy and Consumer Product Partnerships: Netflix launched major merchandising collaborations tied to original content, including partnerships with Mattel and Hasbro connected to a K-pop franchise. This reflects a broader strategy to monetize intellectual property through consumer products and licensing rather than relying solely on viewing revenue.
Future
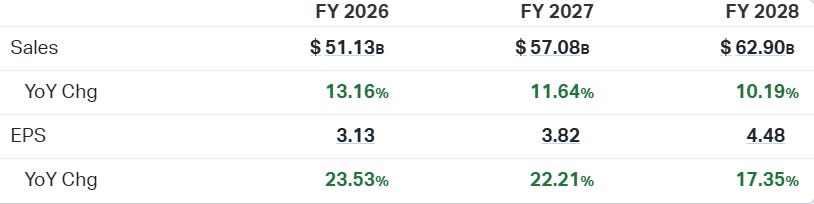
Revenue is projected to rise from about $51B in 2026 to nearly $63B by 2028, while annual growth slows toward ~10% as the business matures. Earnings per share continue increasing, but at a moderating growth rate, indicating profitability is still improving, though the pace of expansion is normalizing.
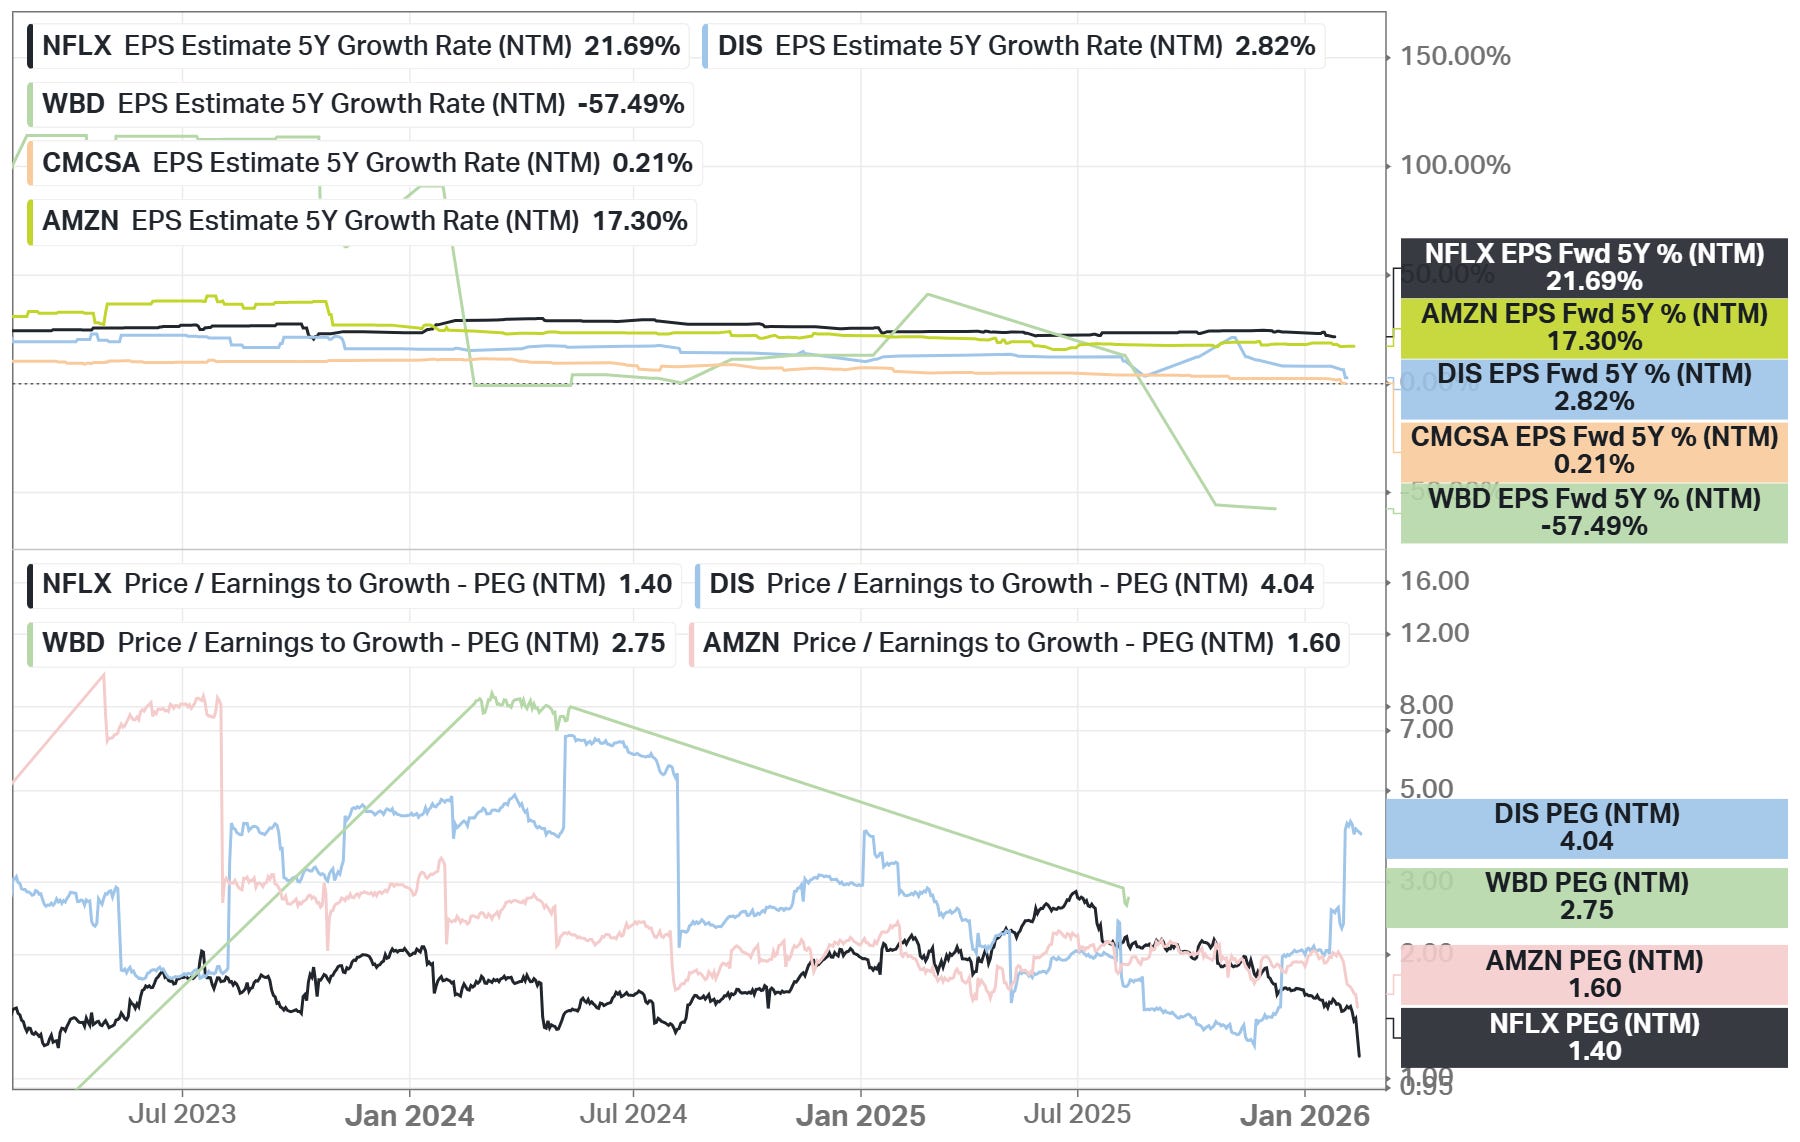
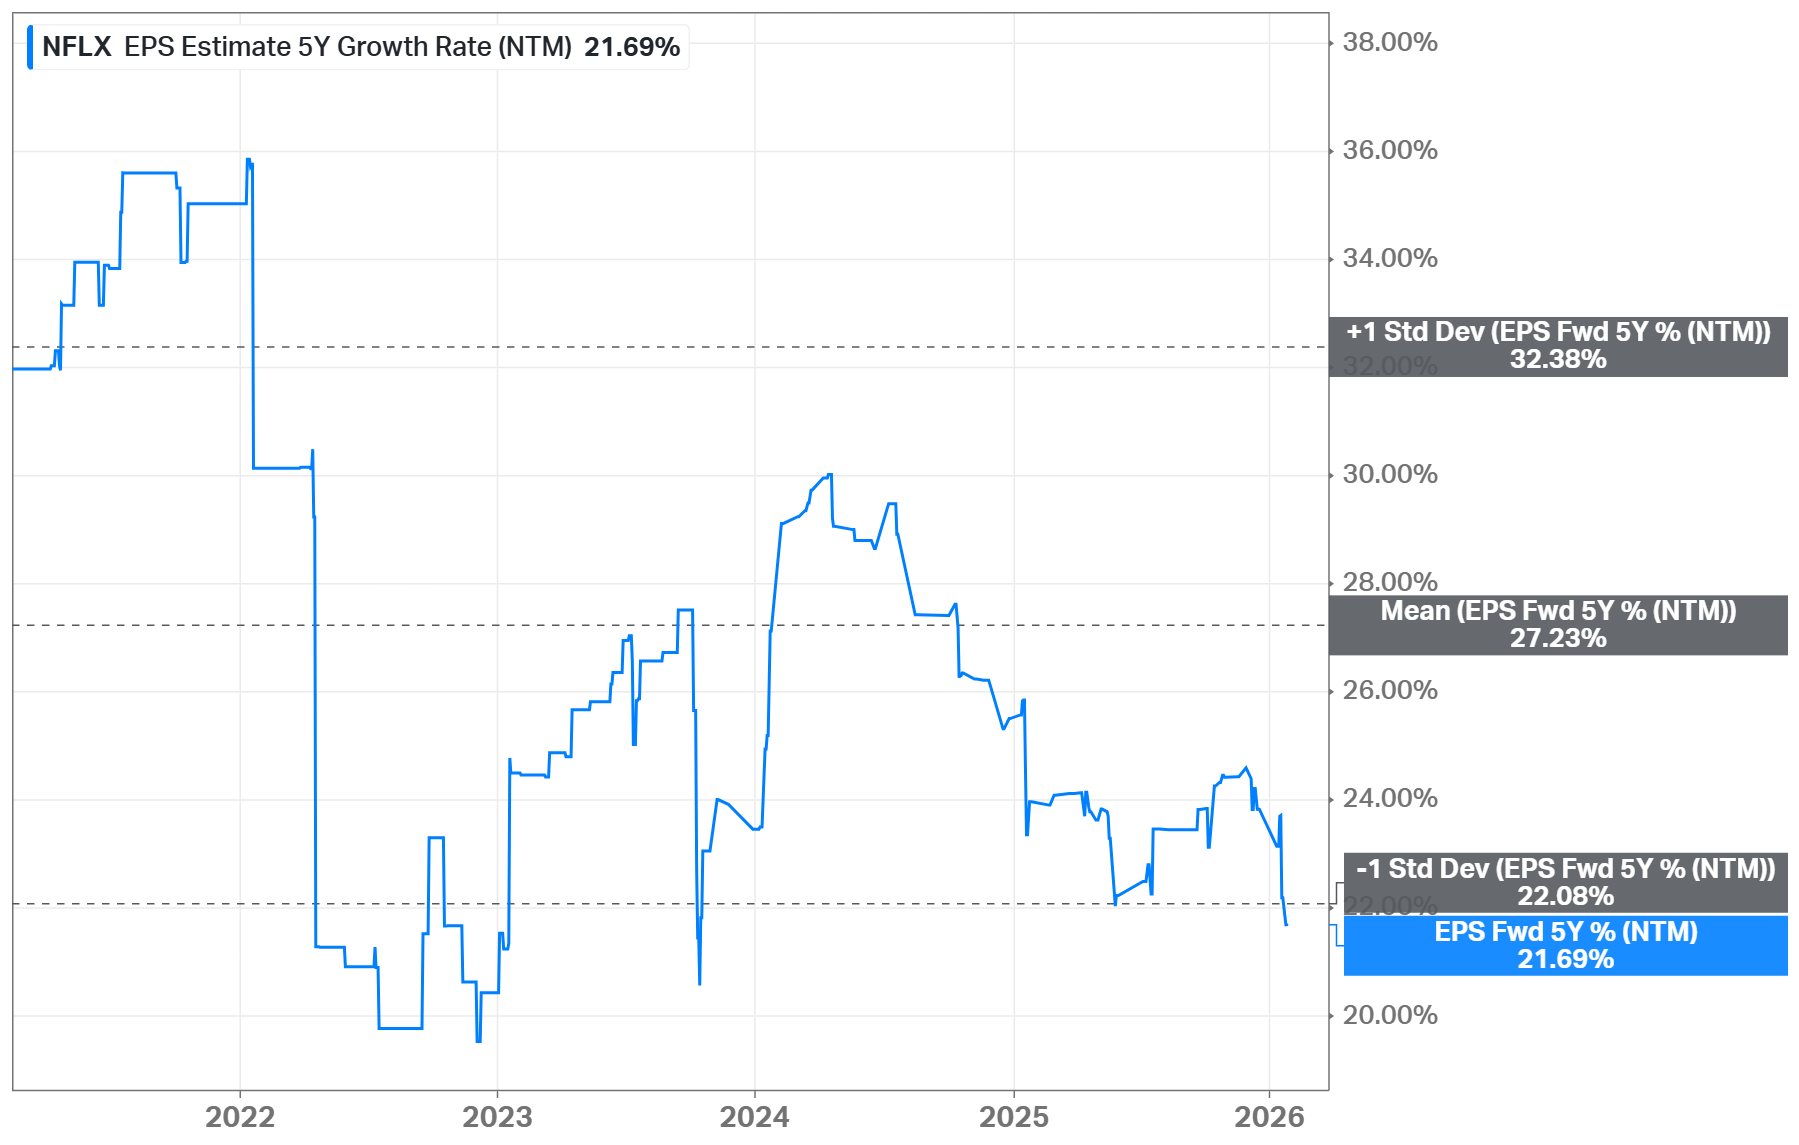
Below is the estimated EPS growth rate for the next 5 years (CARG), the highest value among the competitors (section above).
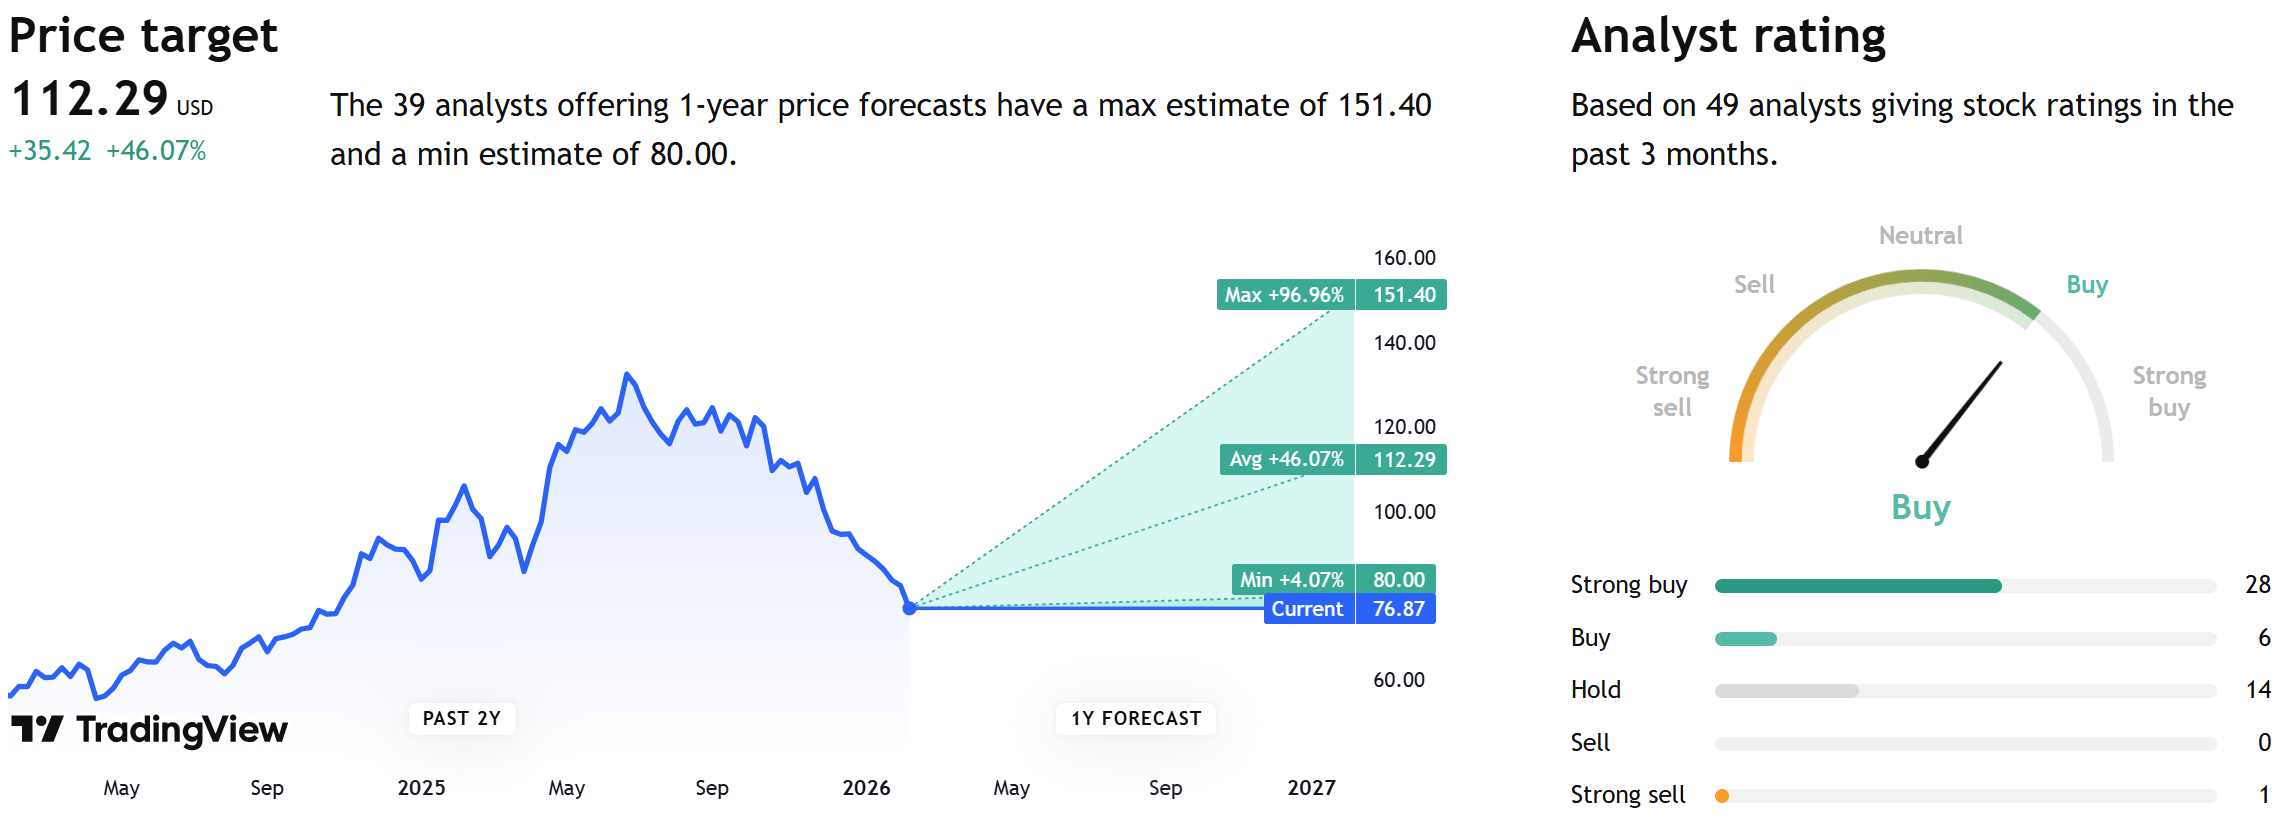
According to 1-year price targets provided by other analysts, the average target for NFLX is $112, indicating a potential increase of 46%.
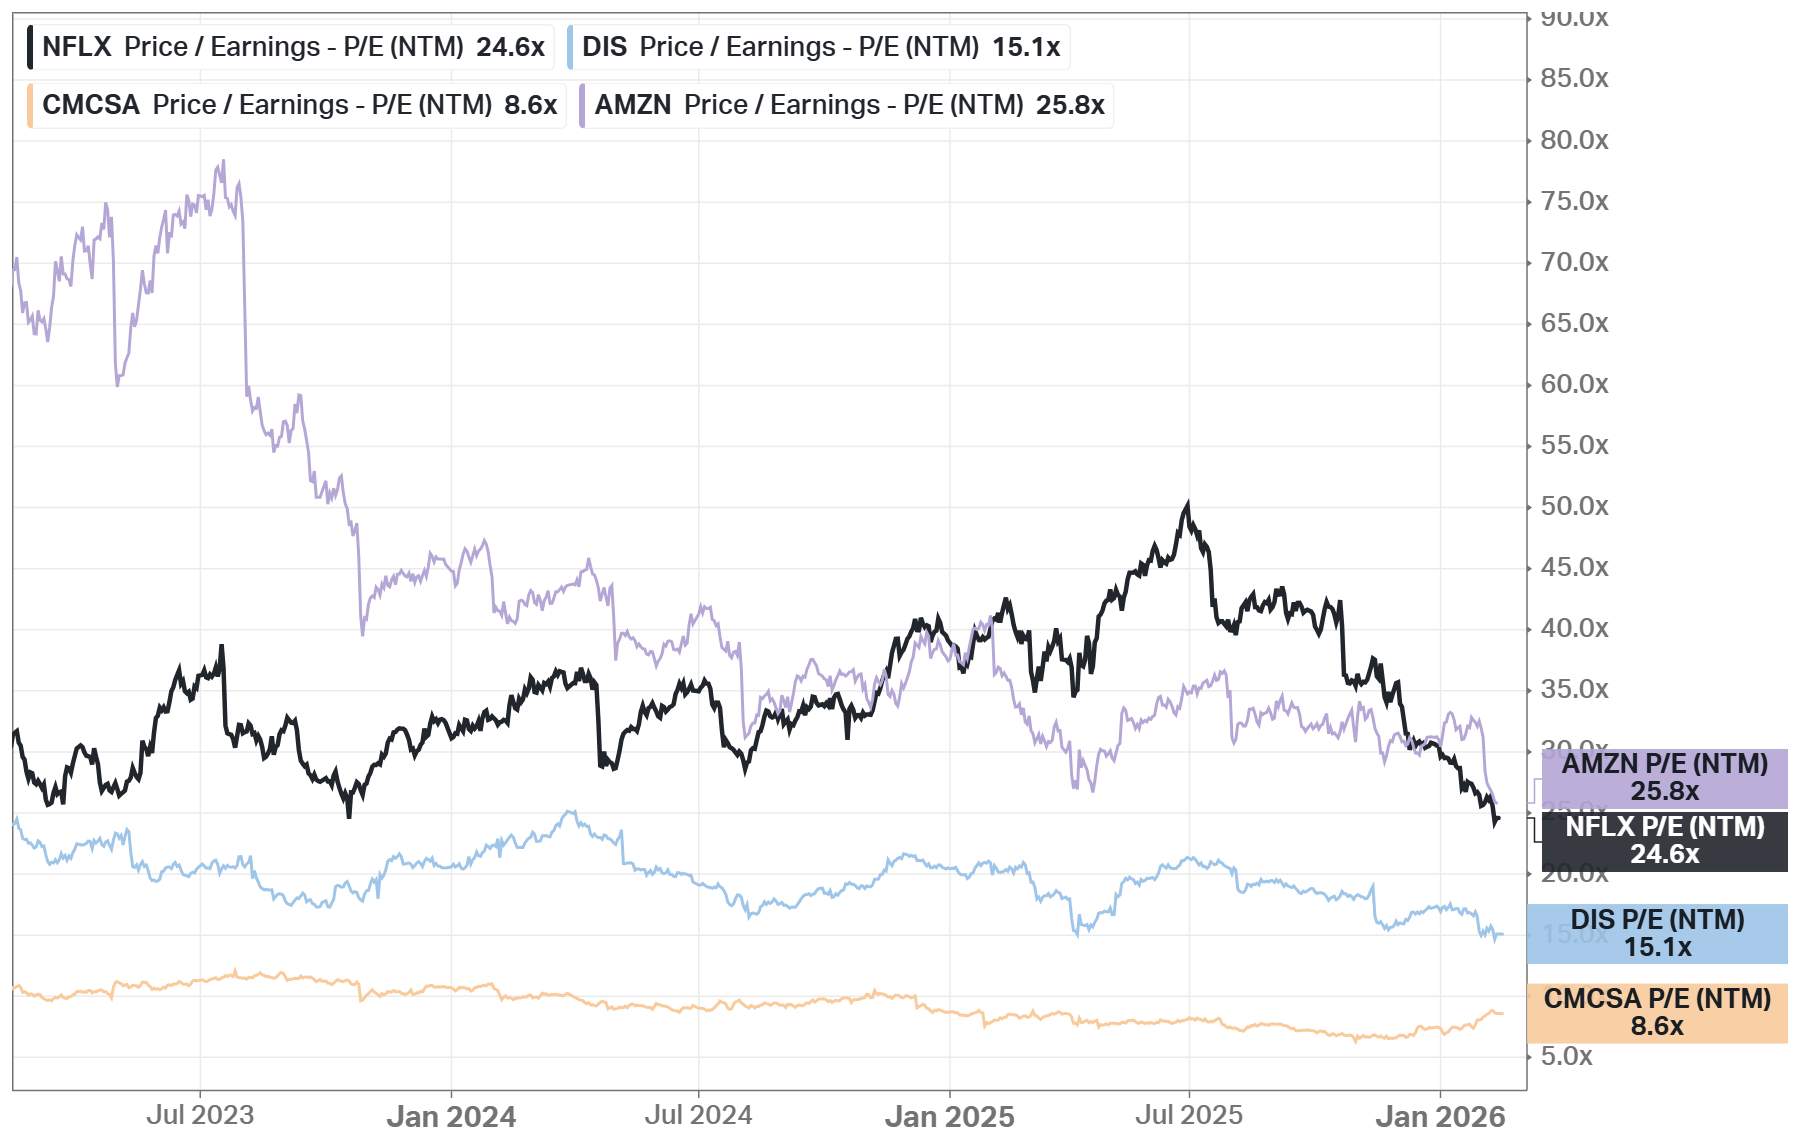
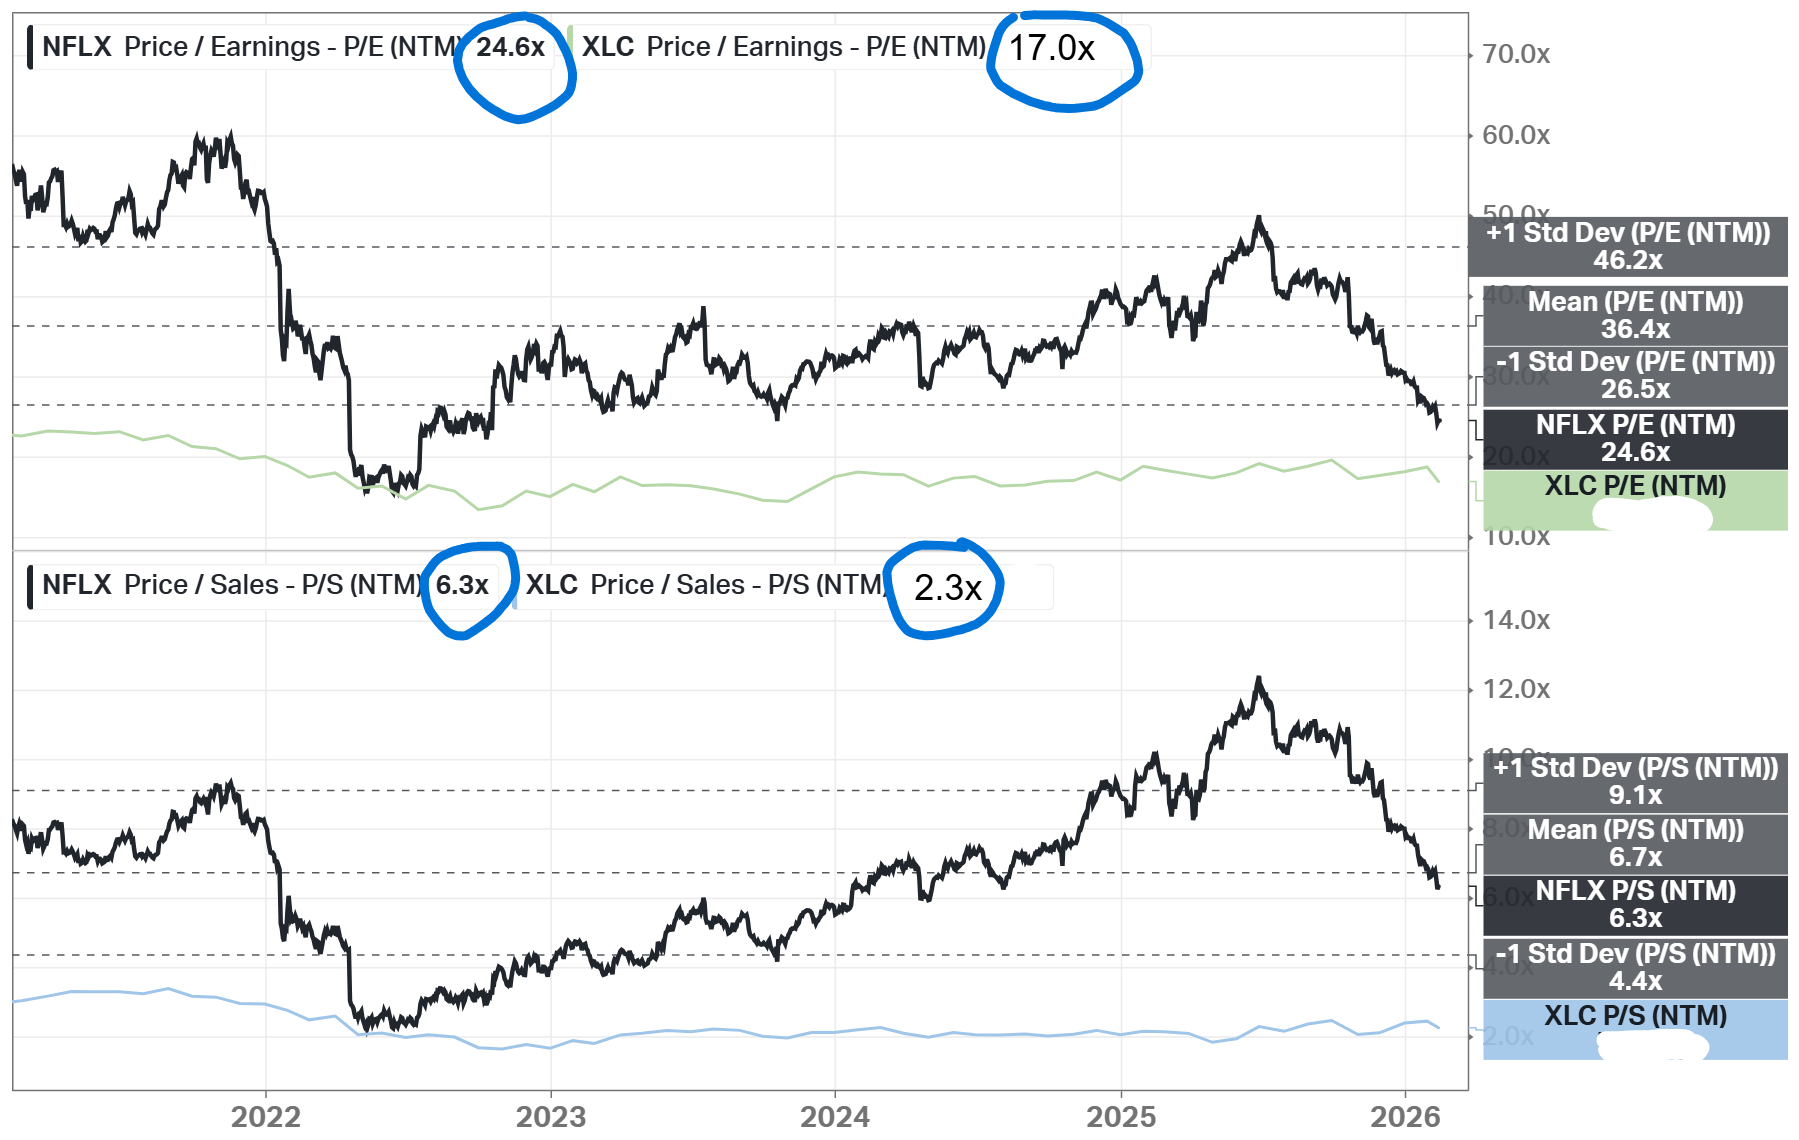
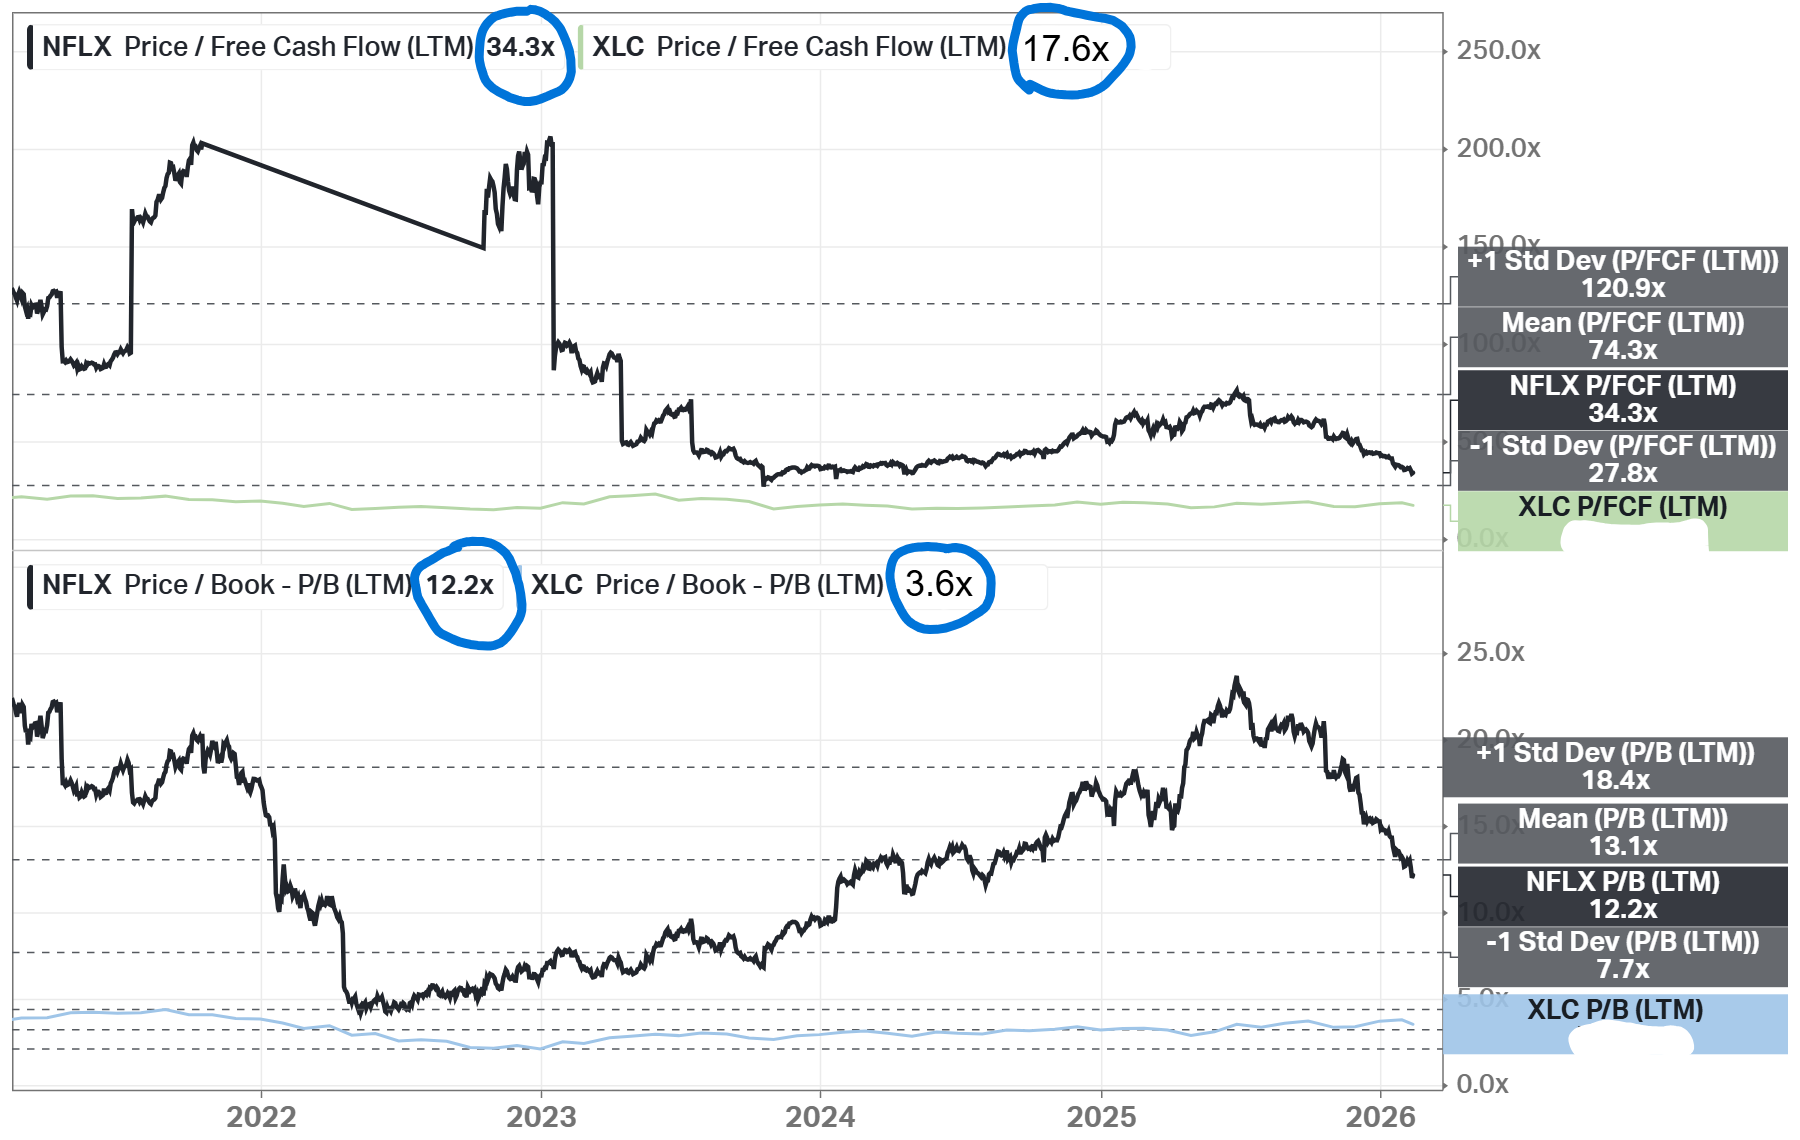
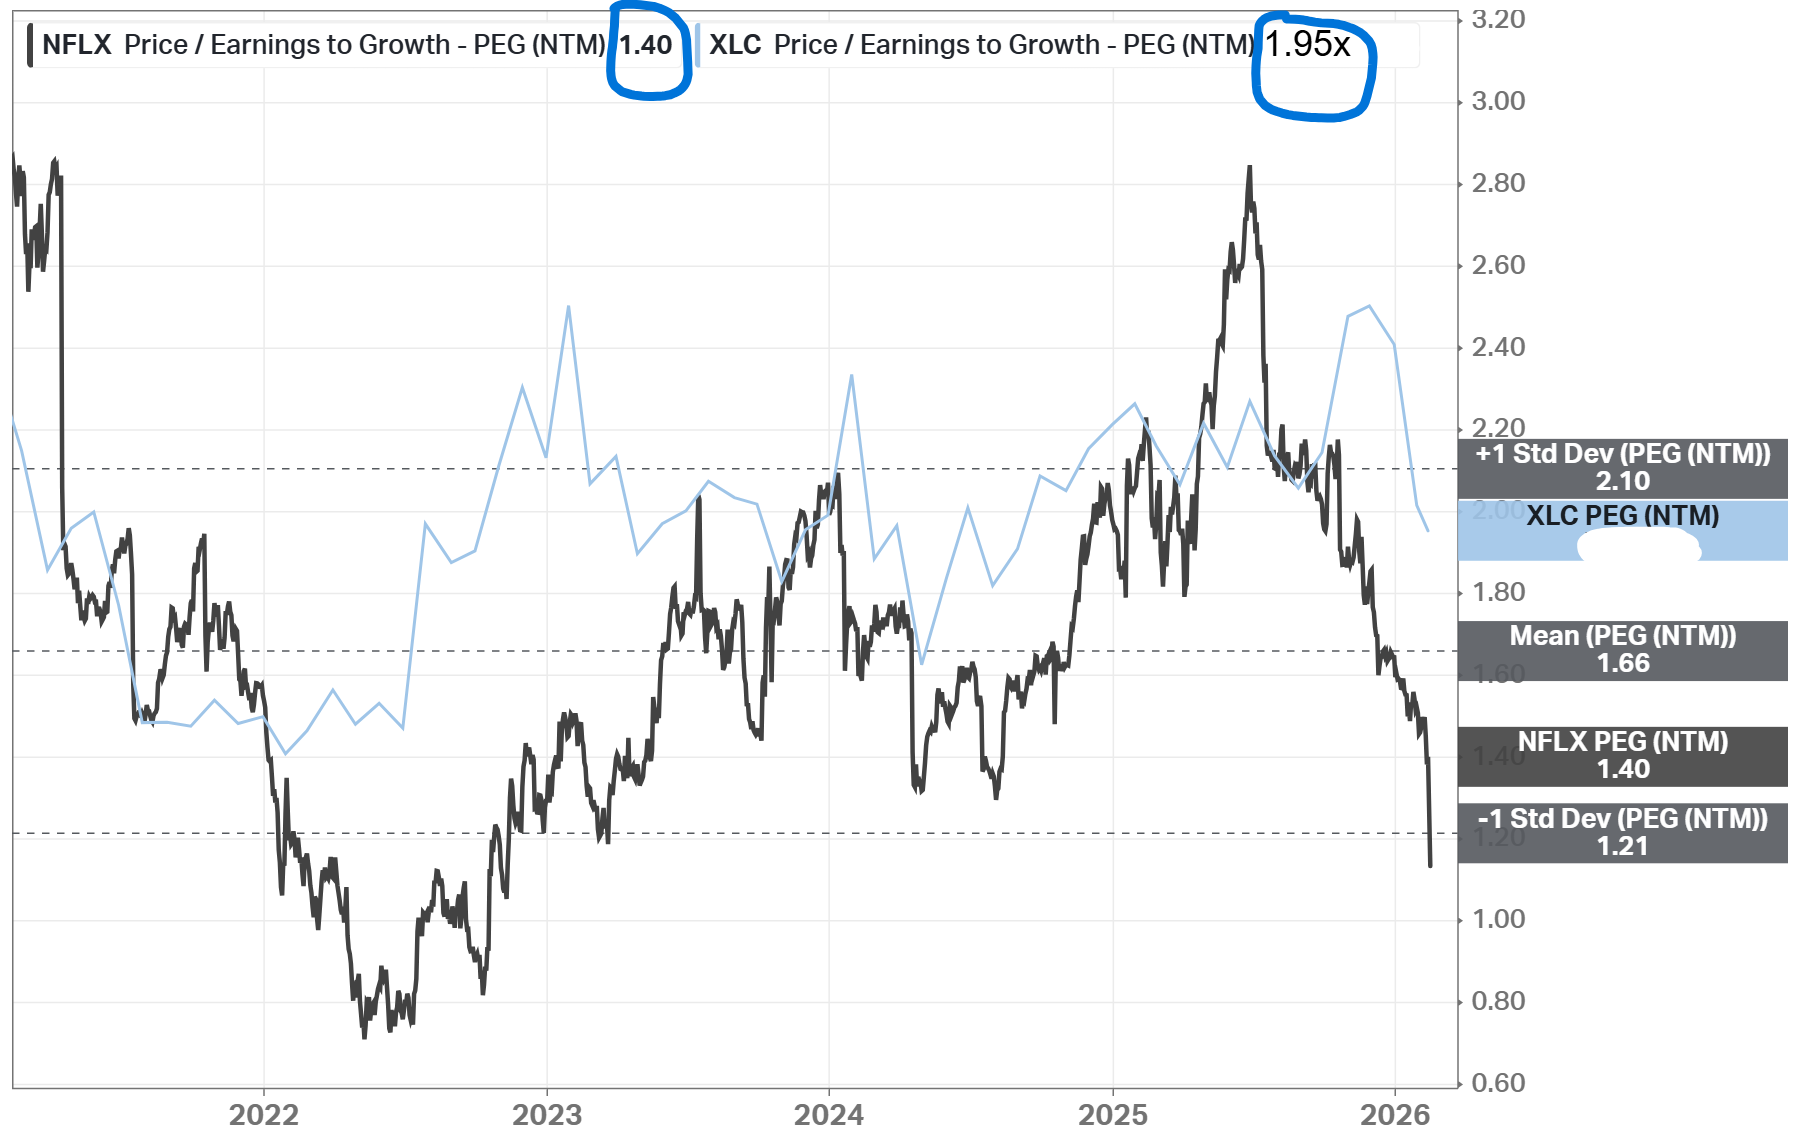
Current Valuation
The charts below display the 5-year average valuation comparison and the comparison to the Communication Services sector (XLC). The company is currently trading below its 5-year averages, but above the sector averages (except the PEG ratio).
Fair Price
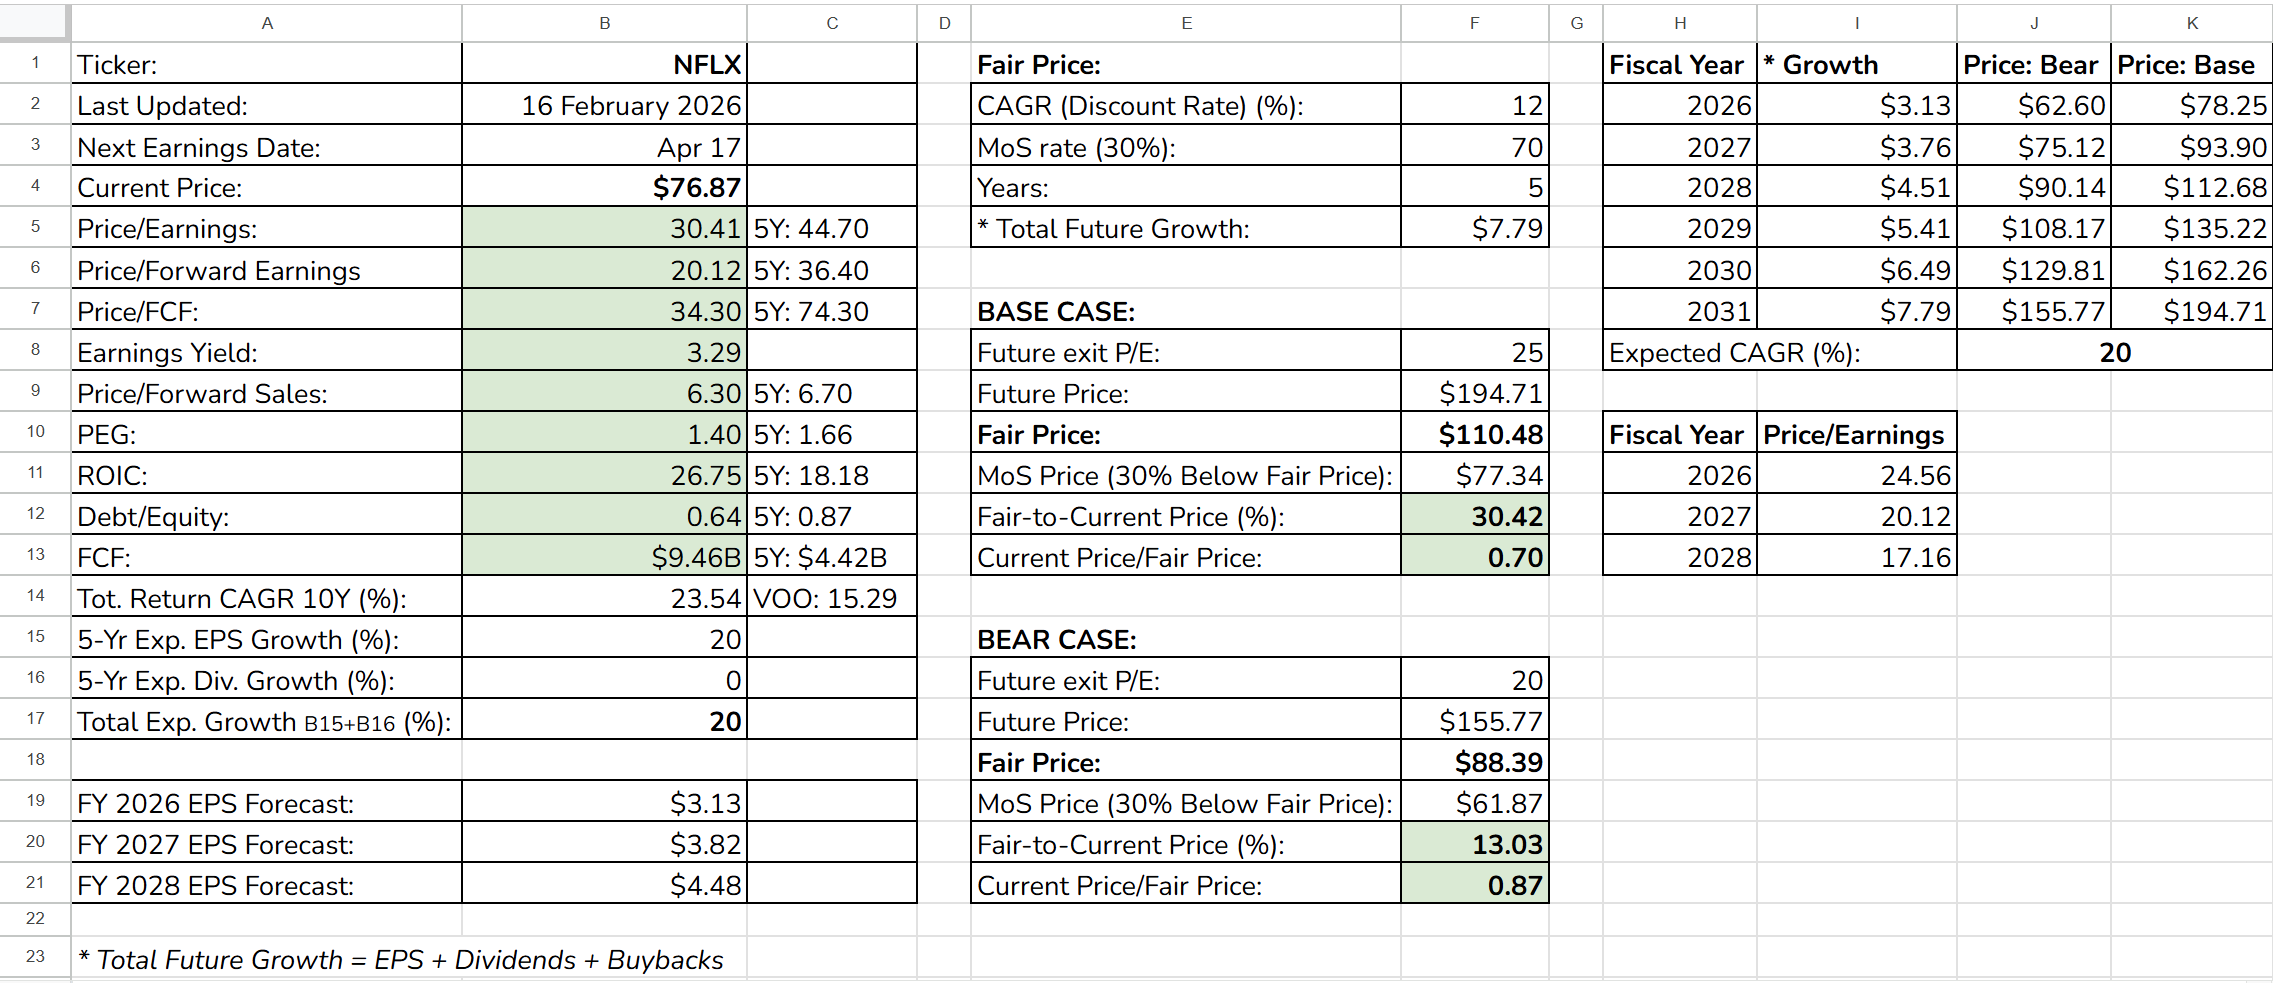
The Long-Term Pick’s Fair Price (Base Case) for NFLX is $110.48. The current price of $76.87 is lower by 30.42%, so the stock is undervalued.
Fair-to-Current Price (%): 30.42%
Current Price/Fair Price: 0.70
Used:
Discount Rate: 12%
Margin of Safety: 30%
Years: 5
Future EPS Growth Rate: 20% (Long-Term Pick’s maximum value)
Future Dividend Yield: 0%
Total Future Annual Growth Rate: 20 + 0 = 20%
For the Base Case, the exit Price/Earnings ratio is set at 25. In the Bear Case, 5 is subtracted from the Base Case value.
The Base Case might be a bit optimistic because the company now operates in a more mature industry where valuation multiples typically compress as growth slows and competition remains high. Therefore, it’s recommended to use the Bear Case, which is still above the current price by 13%.
Due Diligence
Financial Strength (8 of 10):
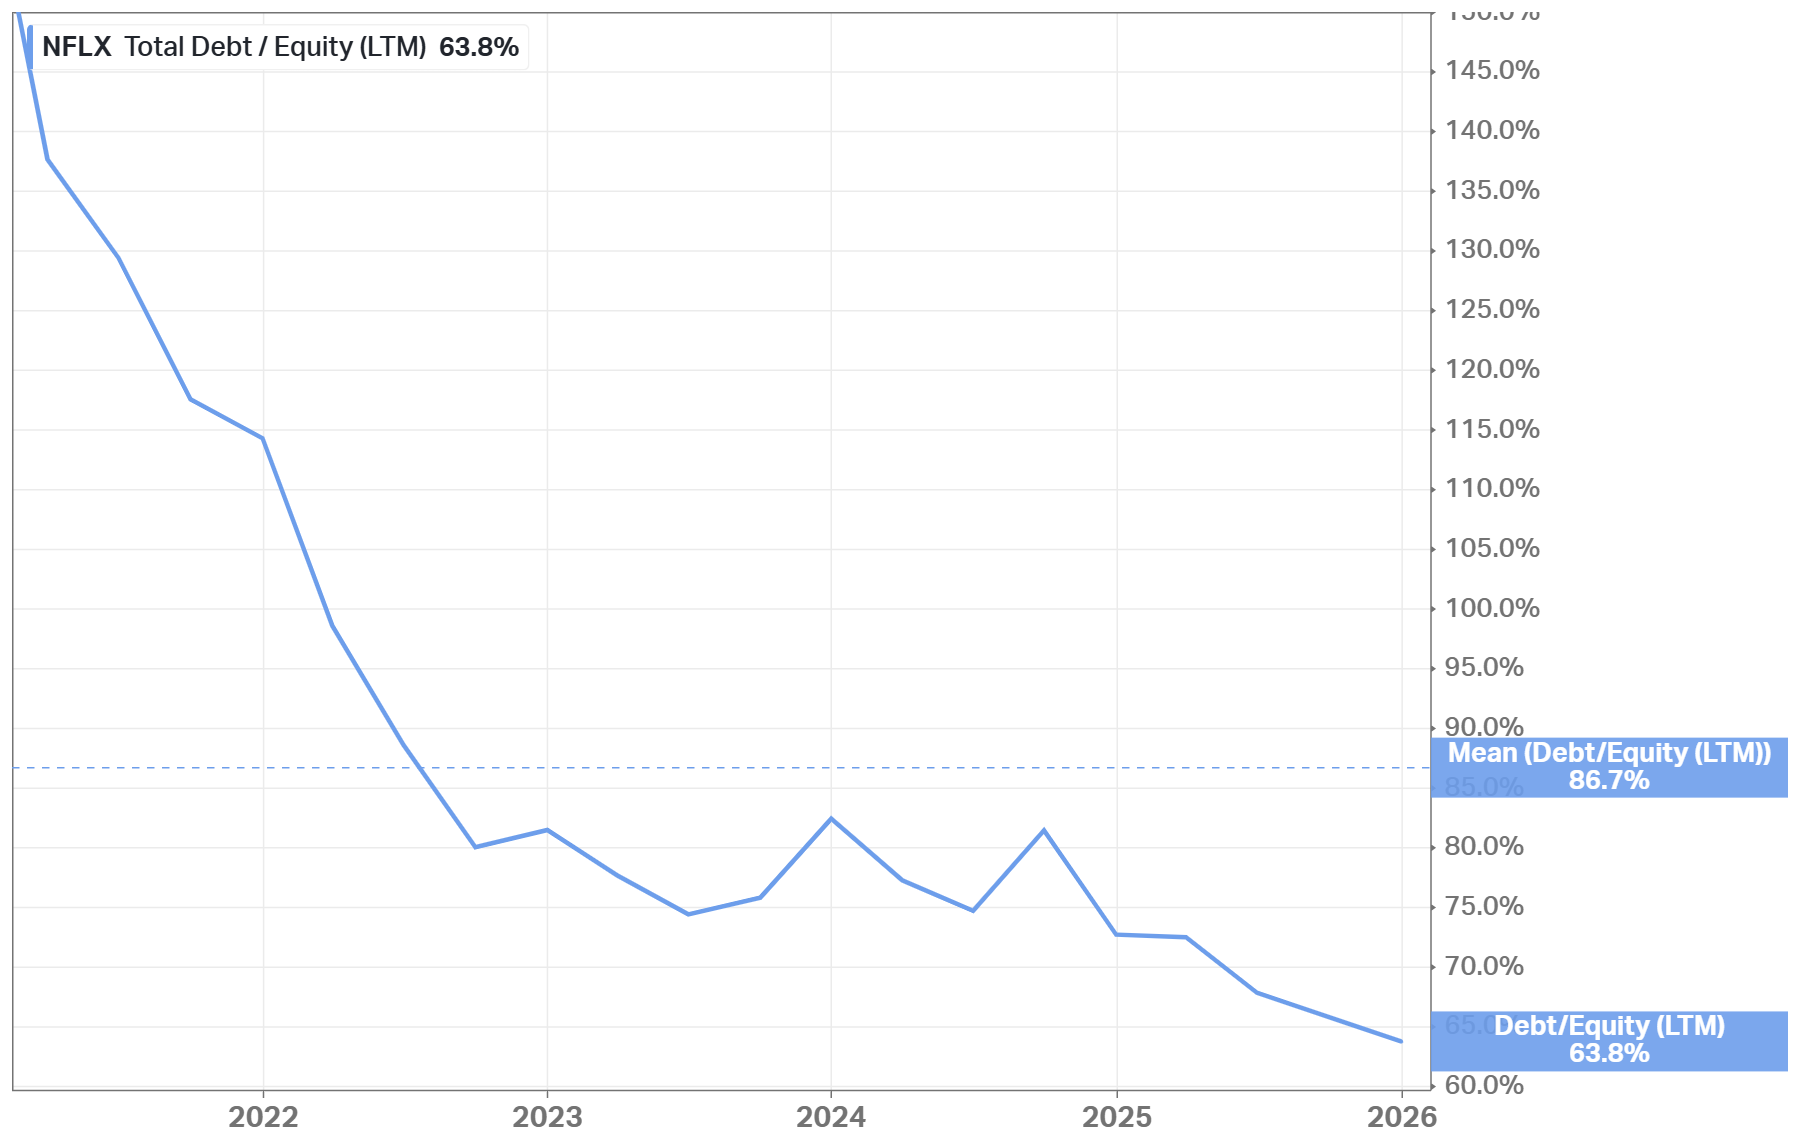
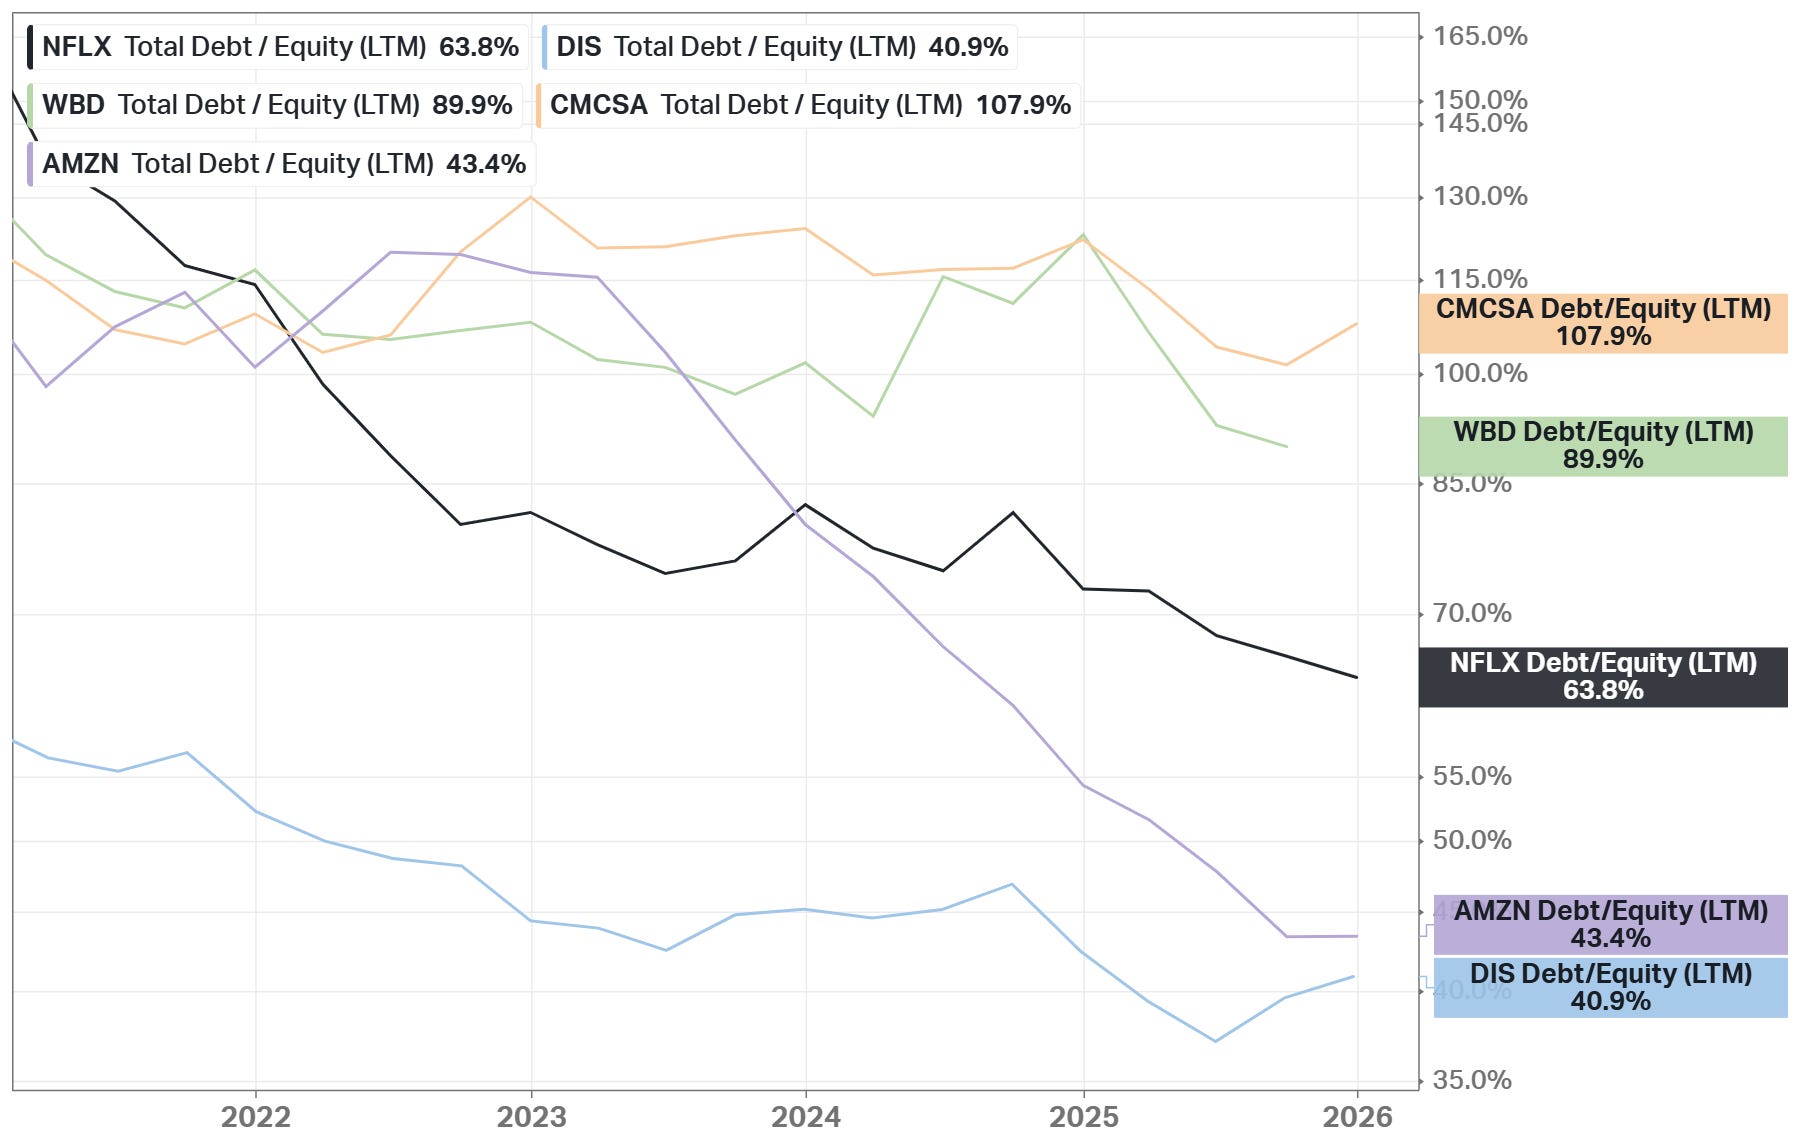
✅ Debt-to-Equity: 0.64
✅ Piotroski F-Score: 7 of 9 (Not passed: CFROA > ROA, Higher Current Ratio YoY)
✅ Altman Z-Score: 9.45
The balance sheet is solid for a content-driven media company. Leverage is moderate, and bankruptcy risk appears minimal, showing the business has transitioned from financed growth toward self-funded operations.
Profitability (9 of 10):
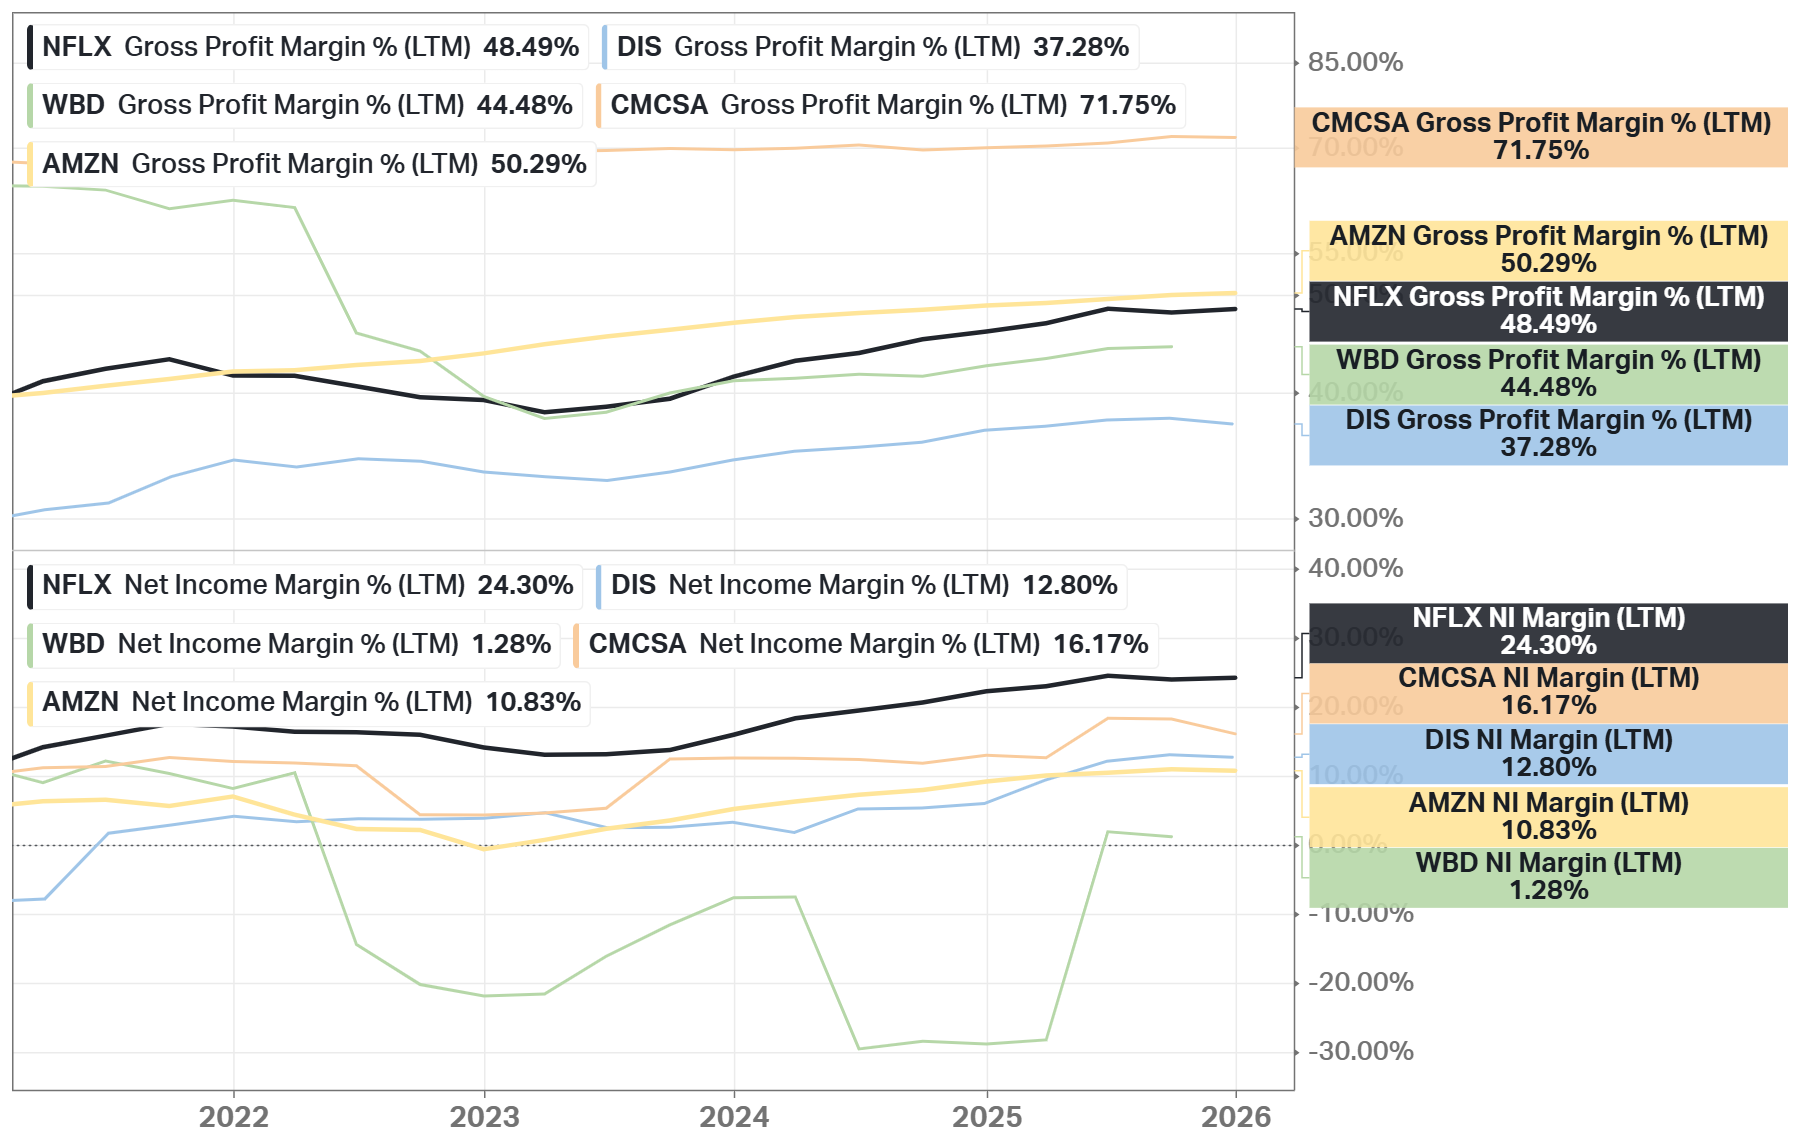
✅ Gross margin at least 40%: 48.50%
✅ Net margin at least 10%: 24.30%
✅ FCF margin at least 10%: 20.94%
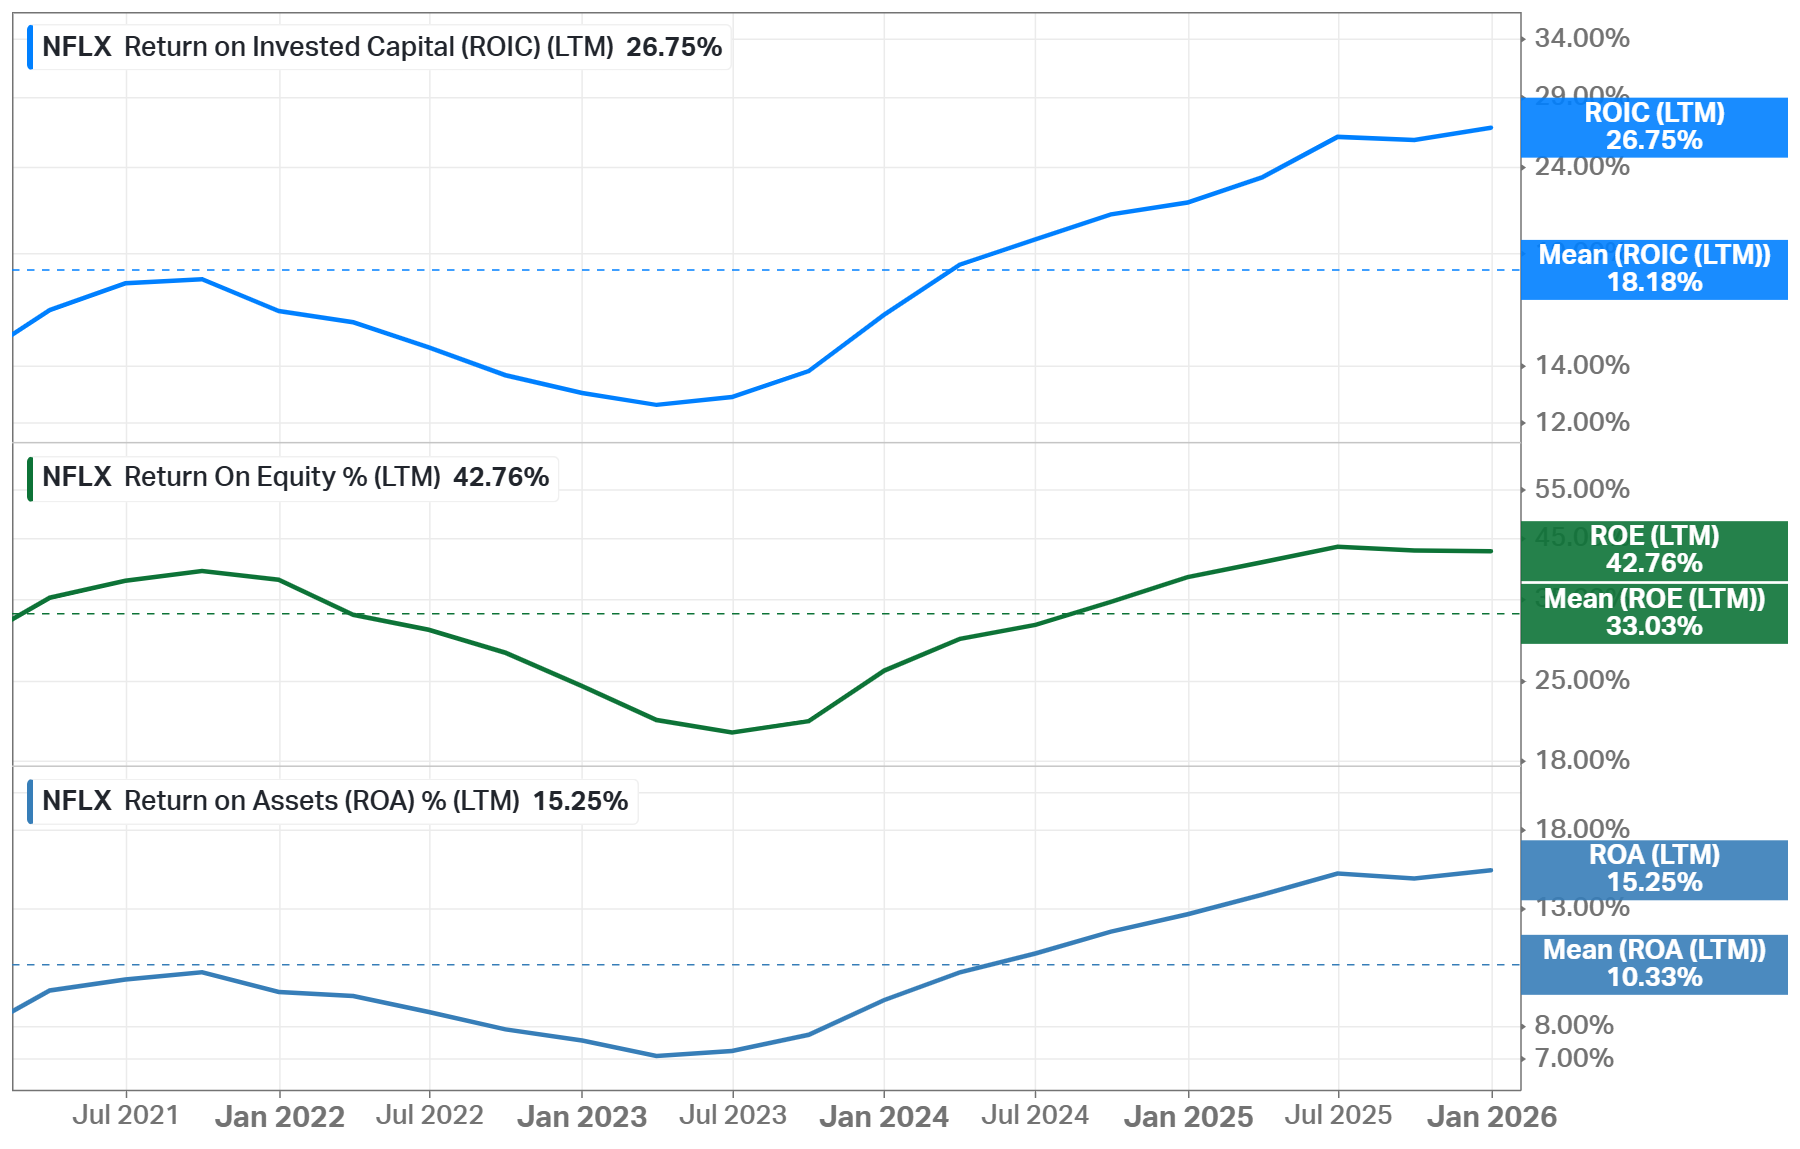
✅ Management (ROIC, ROE, ROA): All above 10%
❌ EPS surprises in the last 5 years: No (Missed: 2022, 2023, and 2025)
❌ EPS growth YoY 5 years in a row: No (Decline: 2022)
Margins are unusually strong for the media industry and confirm that scale now drives earnings rather than only subscriber growth. Temporary earnings volatility does not undermine the long-term profitability trend.
Advantage (8 of 10):
✅ Does it have a moat: Yes (narrow)
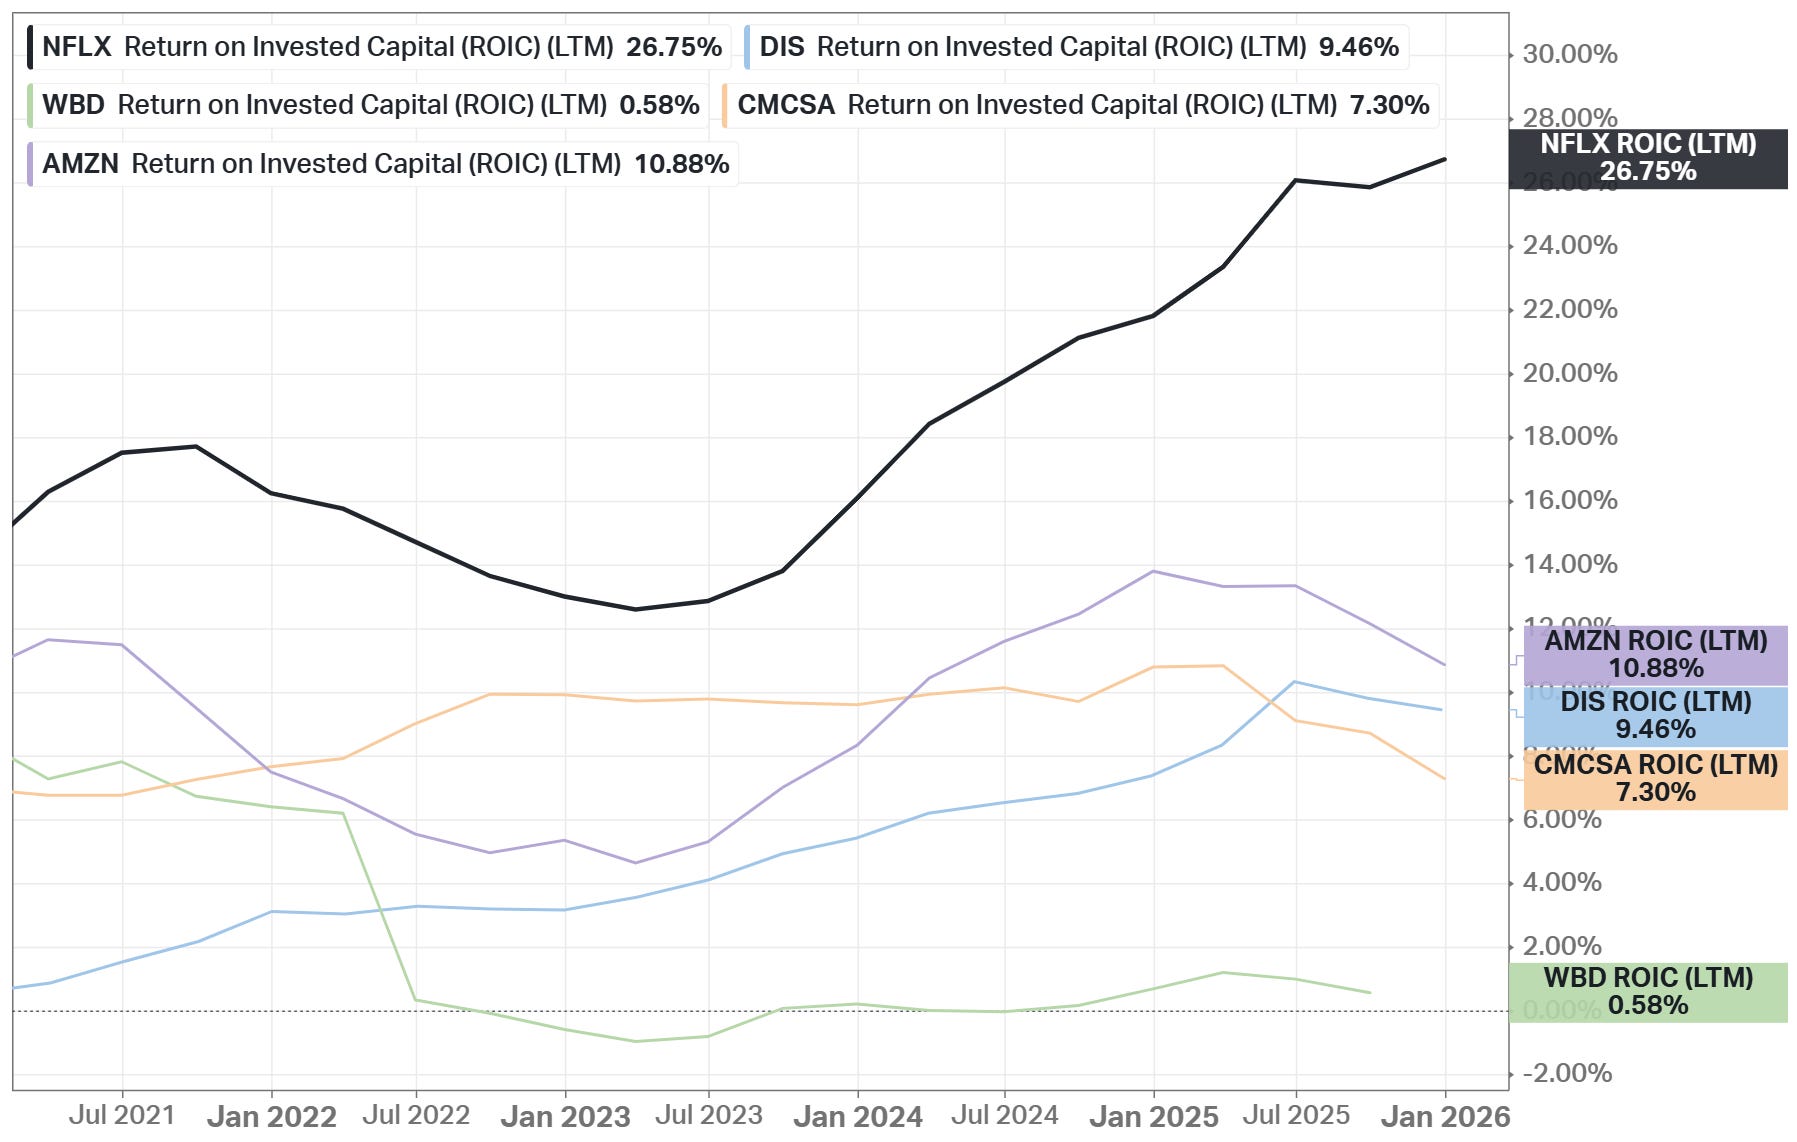
✅ Highest ROIC in streaming competitors, global scale advantage, engagement lock-in, and improving monetization engine (ads)
🟨 Outperformed the S&P 500 CAGR: Partially (10-Year CAGR: 15.29% VOO vs 23.54% NFLX, 5-Year CAGR: 14.50% vs 7.55% NFLX)
The company maintains a durable competitive position supported by global scale, engagement, and monetization capabilities. Performance vs the market reflects valuation compression rather than weakening fundamentals.
Shares & Ownership (8 of 10):
❌ Insider ownership at least 5%: Yes (0.62%)
✅ Less shares outstanding YoY: Yes
❌ Insider buys last six months: No
✅ Short interest no more than 5%: Yes (1.80%)
Share repurchases indicate management confidence and support per share value creation. Insider ownership is low but typical for a mature large-cap platform business.
Expectations (8 of 10):
✅ 1-year stock price forecast is above 10%: +46%
✅ Next 5-year EPS growth estimates (CAGR) is above 10%: Yes (21.70%)
✅ Long-Term Pick Fair Price is above at least 10%: Yes
Forward growth forecasts remain attractive for a company of this size. The outlook depends more on monetization expansion than on rapid subscriber additions, making execution quality the key driver.
Investment Thesis
Netflix now trades below its 5-year average valuation despite continuing double-digit revenue growth and expanding profitability. The company still benefits from a massive global membership base that spreads content costs across hundreds of millions of households and stabilizes engagement.
The business is evolving beyond subscriptions. Advertising is becoming a second revenue engine, while expansion into live events, games, and video podcasts increases platform usage and strengthens retention. At the same time, returns on invested capital have risen over the past five years and remain the highest among major competitors, supported by disciplined investment and ongoing share repurchases.
Risks remain. Core markets are mature, competition is intense, and content spending stays structurally high. The balance sheet also carries elevated debt, although leverage has declined over the last five years as cash flow improved. Despite these negatives, Netflix maintains the strongest net income margin and forward earnings growth outlook among competitors.
The stock currently suits a watchlist-to-accumulate approach. The business remains strong and profitable, but industry maturity and competition can create periodic valuation pullbacks. Long-term investors may consider gradually building a position during market weakness rather than chasing short-term momentum, while existing shareholders can reasonably continue holding as long as profitability trends and capital efficiency remain intact.
This is not a financial or investing recommendation. It is solely for educational purposes.
Koyfin was used for charts in this analysis. Use this URL to receive a special pricing offer of 20% off all Koyfin plans.
great stuff!