

TL;DR: Visa (V) operates the largest card payment network in the world and earns a small fee on almost every purchase that goes through it, without lending money or taking credit risk. The Q4 FY2026 report closed a record year, but Visa guides for slower growth in FY2027; its payments to banks and merchants for using Visa (client incentives) grow faster than revenue. After a 15% gain in October, V trades at 27.5x forward earnings, above its 5Y mean. As I see it, the business is as strong as ever, but the price leaves room for only one disappointment: slower growth or a lower multiple, not both. V is just above my accumulation zone ($285-407), so for me it is a stock to hold, not to add to.
Analyst’s note:
Visa is the first company I bought for my portfolio. I bought the first 3 shares on Dec 06, 2021, at $199.10, and since then I have only added to the position, never sold. I am very happy with it.
Investment Thesis
The FY2026 report did not change much in the Visa story. The growth was strong, the margin was stable, and Visa returned more cash than it generated. The change is in the stock. In March, V traded at ~22-23x forward earnings, at the low end of its 5Y range. Today, it is at 27.5x, above its mean. In my view, the business still delivers what the consensus expects, and the question is how much of the next 5 years the price already includes.
FY2026 growth was the strongest in over 15 years, and the guidance says it slows. Net revenue increased 15% (14% in constant dollars, without currency effects), the fastest in more than 15 years without the post-pandemic recovery and acquisitions. In Q4, it was +13%, with payments volume +9%, cross-border volume +14%, and processed transactions +10%. Value-added services, Visa’s second business, grew 30% to $14B. For FY2027, Visa expects low-double-digit growth for net revenue and “low double digits to low teens” for EPS.
Consensus is at the upper end of the guidance, and V trades at a full multiple for it. Consensus EPS for FY2027 is $15.03, +13% against $13.27, and the 5Y EPS growth estimate is 14.01%. V trades at 27.5x forward earnings, so the PEG ratio is 1.96, above its 1.87 mean and above the 1.5 ceiling of my rules.
The economics are still the best I know. The non-GAAP operating margin is 67.5%, ROIC is 44.10% against a 32.77% 5Y mean, and ROE is 63.51%. FCF was $22.06B, only +2% YoY, but Visa paid ~$3.8B in litigation in FY2026 (my estimate) against $1.28B in FY2025. Before these payments, FCF grew ~13%. Visa returned $25.6B in buybacks and dividends, 116% of its FCF.
V is above its 5Y mean on every multiple. The forward P/E is 27.5x against a 26.6x mean and a 24.6x -1 standard deviation band. P/FCF and P/B are above their means too. If the multiple stays at 27.5x, my 12% required return needs ~11% EPS growth per year, the low end of the FY2027 guidance. If V returns to ~24x (its -1 standard deviation band, rounded down), the company needs ~14%, the full consensus.
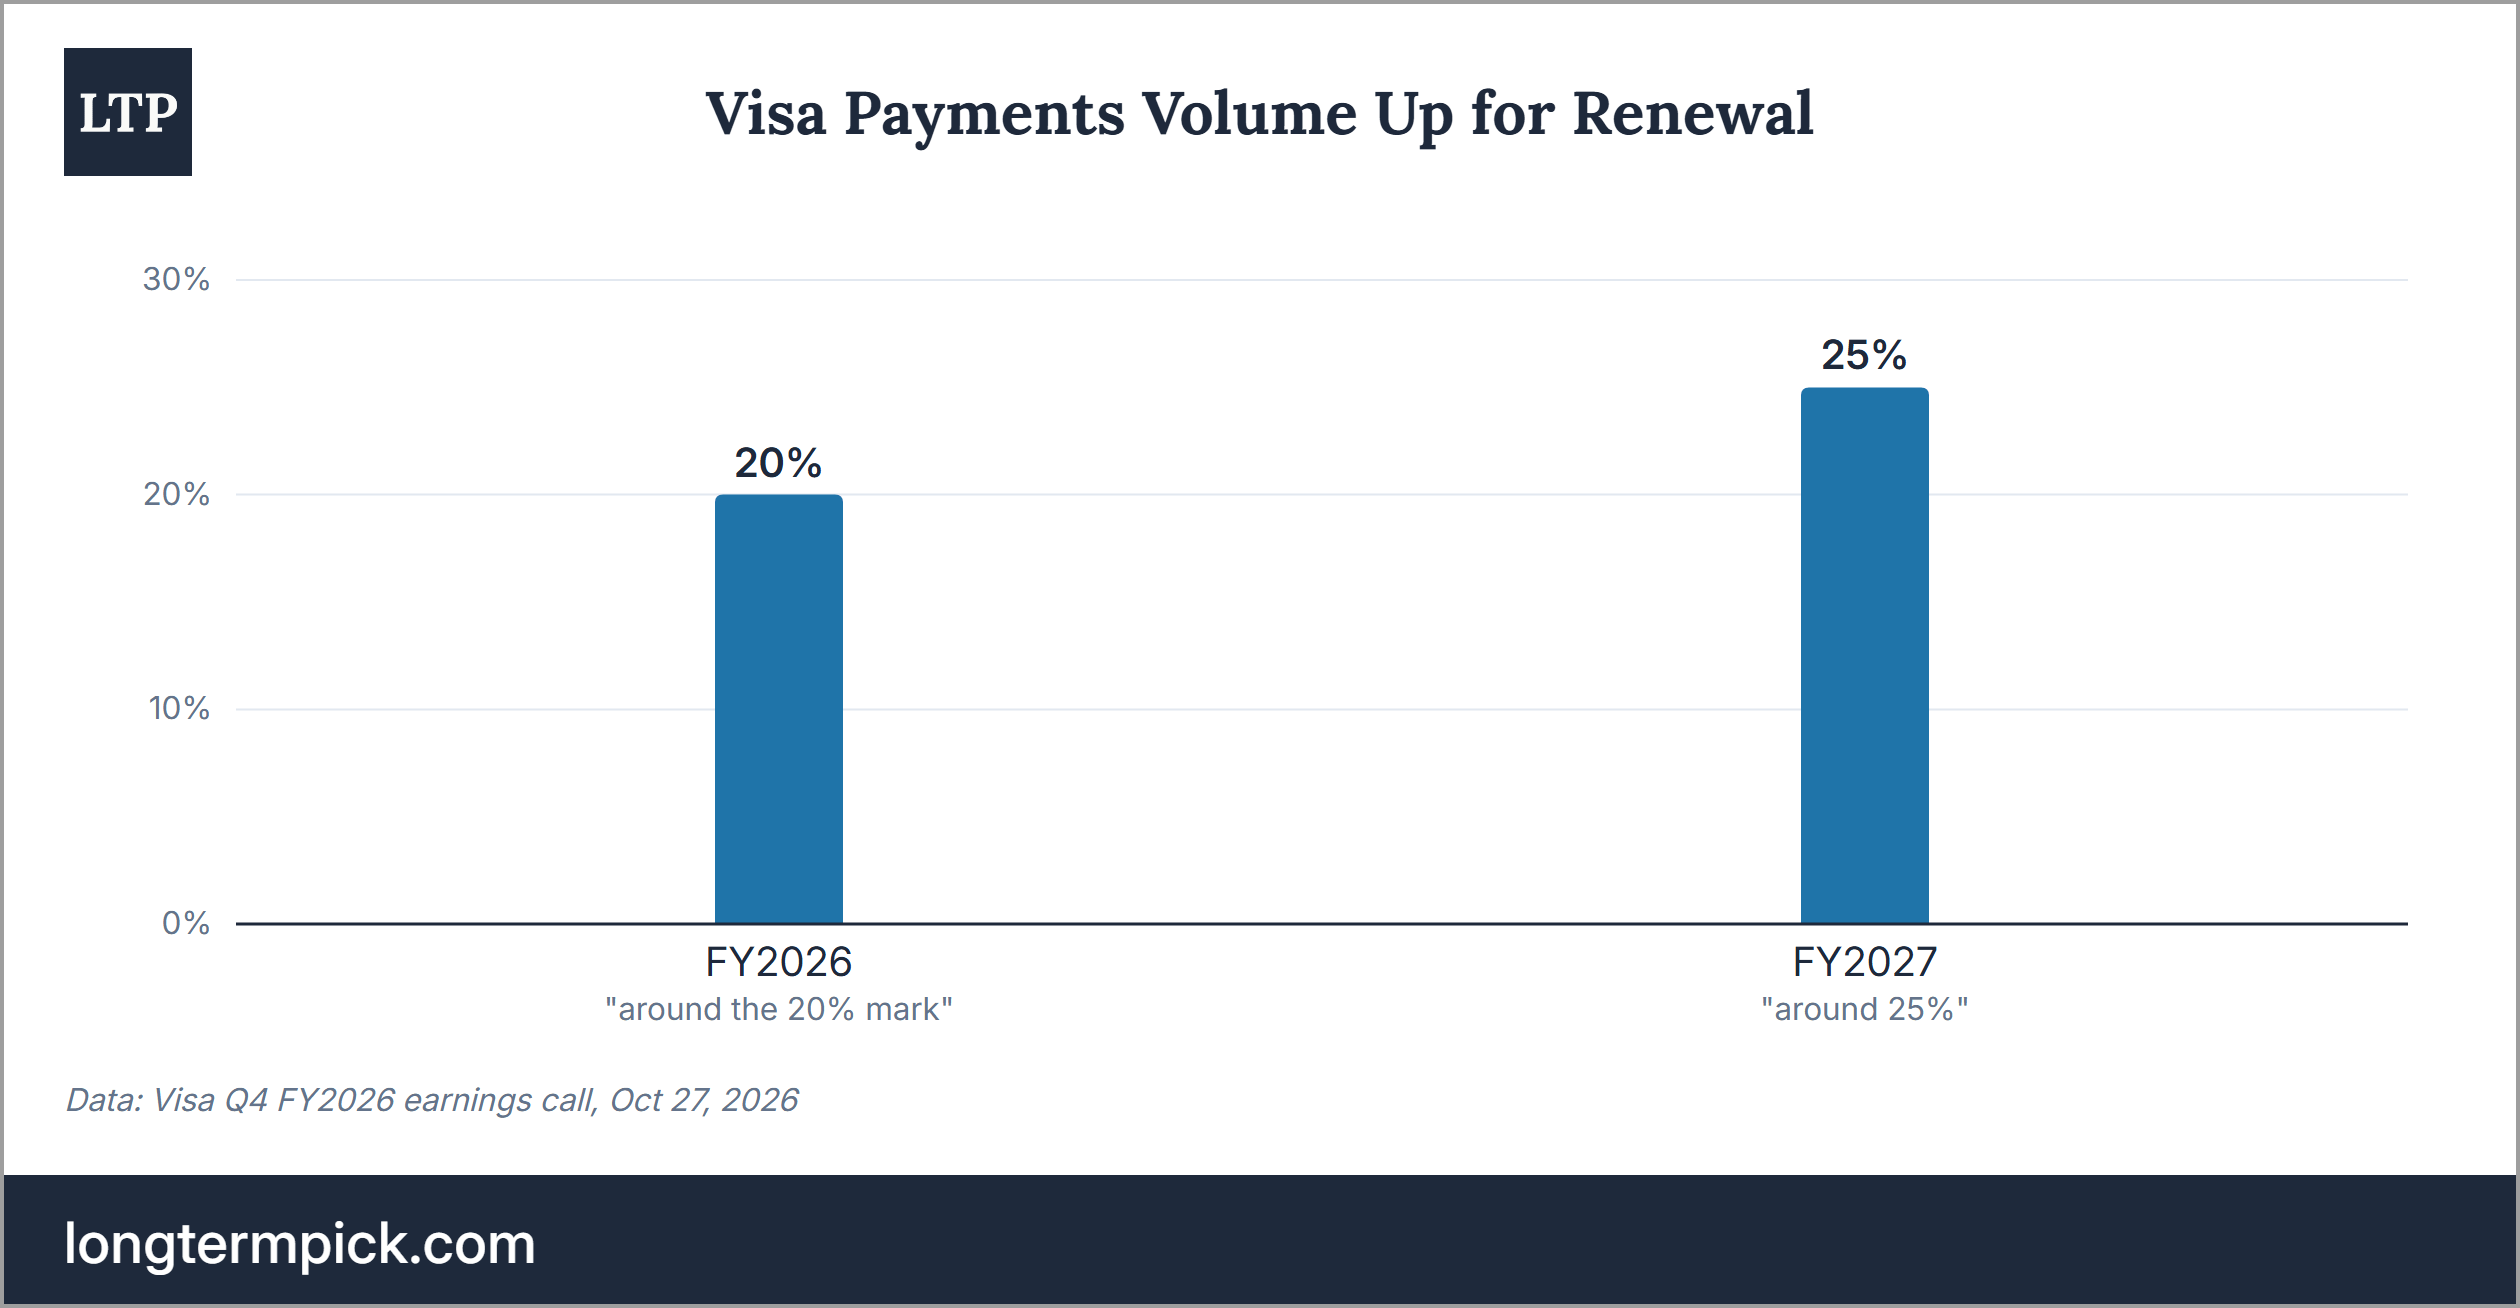
The bear case is a costly renewal year plus a lower multiple. In FY2027, ~25% of Visa’s payments volume comes up for contract renewal, against 20% in FY2026, so incentives will grow faster. Regulation is a constant pressure (merchant settlement, the US Justice Department lawsuit); international transaction revenue grew only 8% in FY2026, while cross-border volume grew 14% in Q4. My model takes the lower multiple into account by using the -1 standard deviation band (24x) as the Bear Case exit multiple, but it keeps the consensus growth. V is 1.5% above my Bear Case fair price of $407, so it is just above the accumulation zone. If EPS grows only ~11% per year, the Bear Case fair price is $357.
Analyst’s note:
Visa’s fiscal year ends on Sep 30, so FY2026 is October 2025 to September 2026, and FY2027 is the current year. Unless I say otherwise, EPS means non-GAAP diluted class A EPS. It excludes litigation provisions, severance and other special items, and it is the basis of Visa’s guidance and of the Koyfin consensus. GAAP EPS was $12.32 in FY2026. The price anchor is the Oct 30 close of $413.59.
Company Overview
Next Earnings Date: Jan 26, 2027 (estimated)
Market Cap: $769.07B
Sector: Financials | Industry: Financial Services
Type: Large Blend
Short Interest: 1.10%
Visa connects the banks that issue cards to the merchants that accept them. In FY2025, Visa's network handled $17 trillion of total payments and cash volume in more than 200 countries and territories, according to the FY2025 10-K. In FY2026, there were 5.2 billion Visa credentials (cards and their digital versions), +6% YoY, accepted at well over 200 million seller locations, and Visa processed 281.3 billion transactions, +9%. As the 10-K says, "Visa is not a financial institution": it does not issue cards, does not lend, and does not set the rates that cardholders pay. So it does not take credit risk. Ryan McInerney has been the CEO since February 2023, and Chris Suh is the CFO. Visa had ~34,100 employees at the end of FY2025.
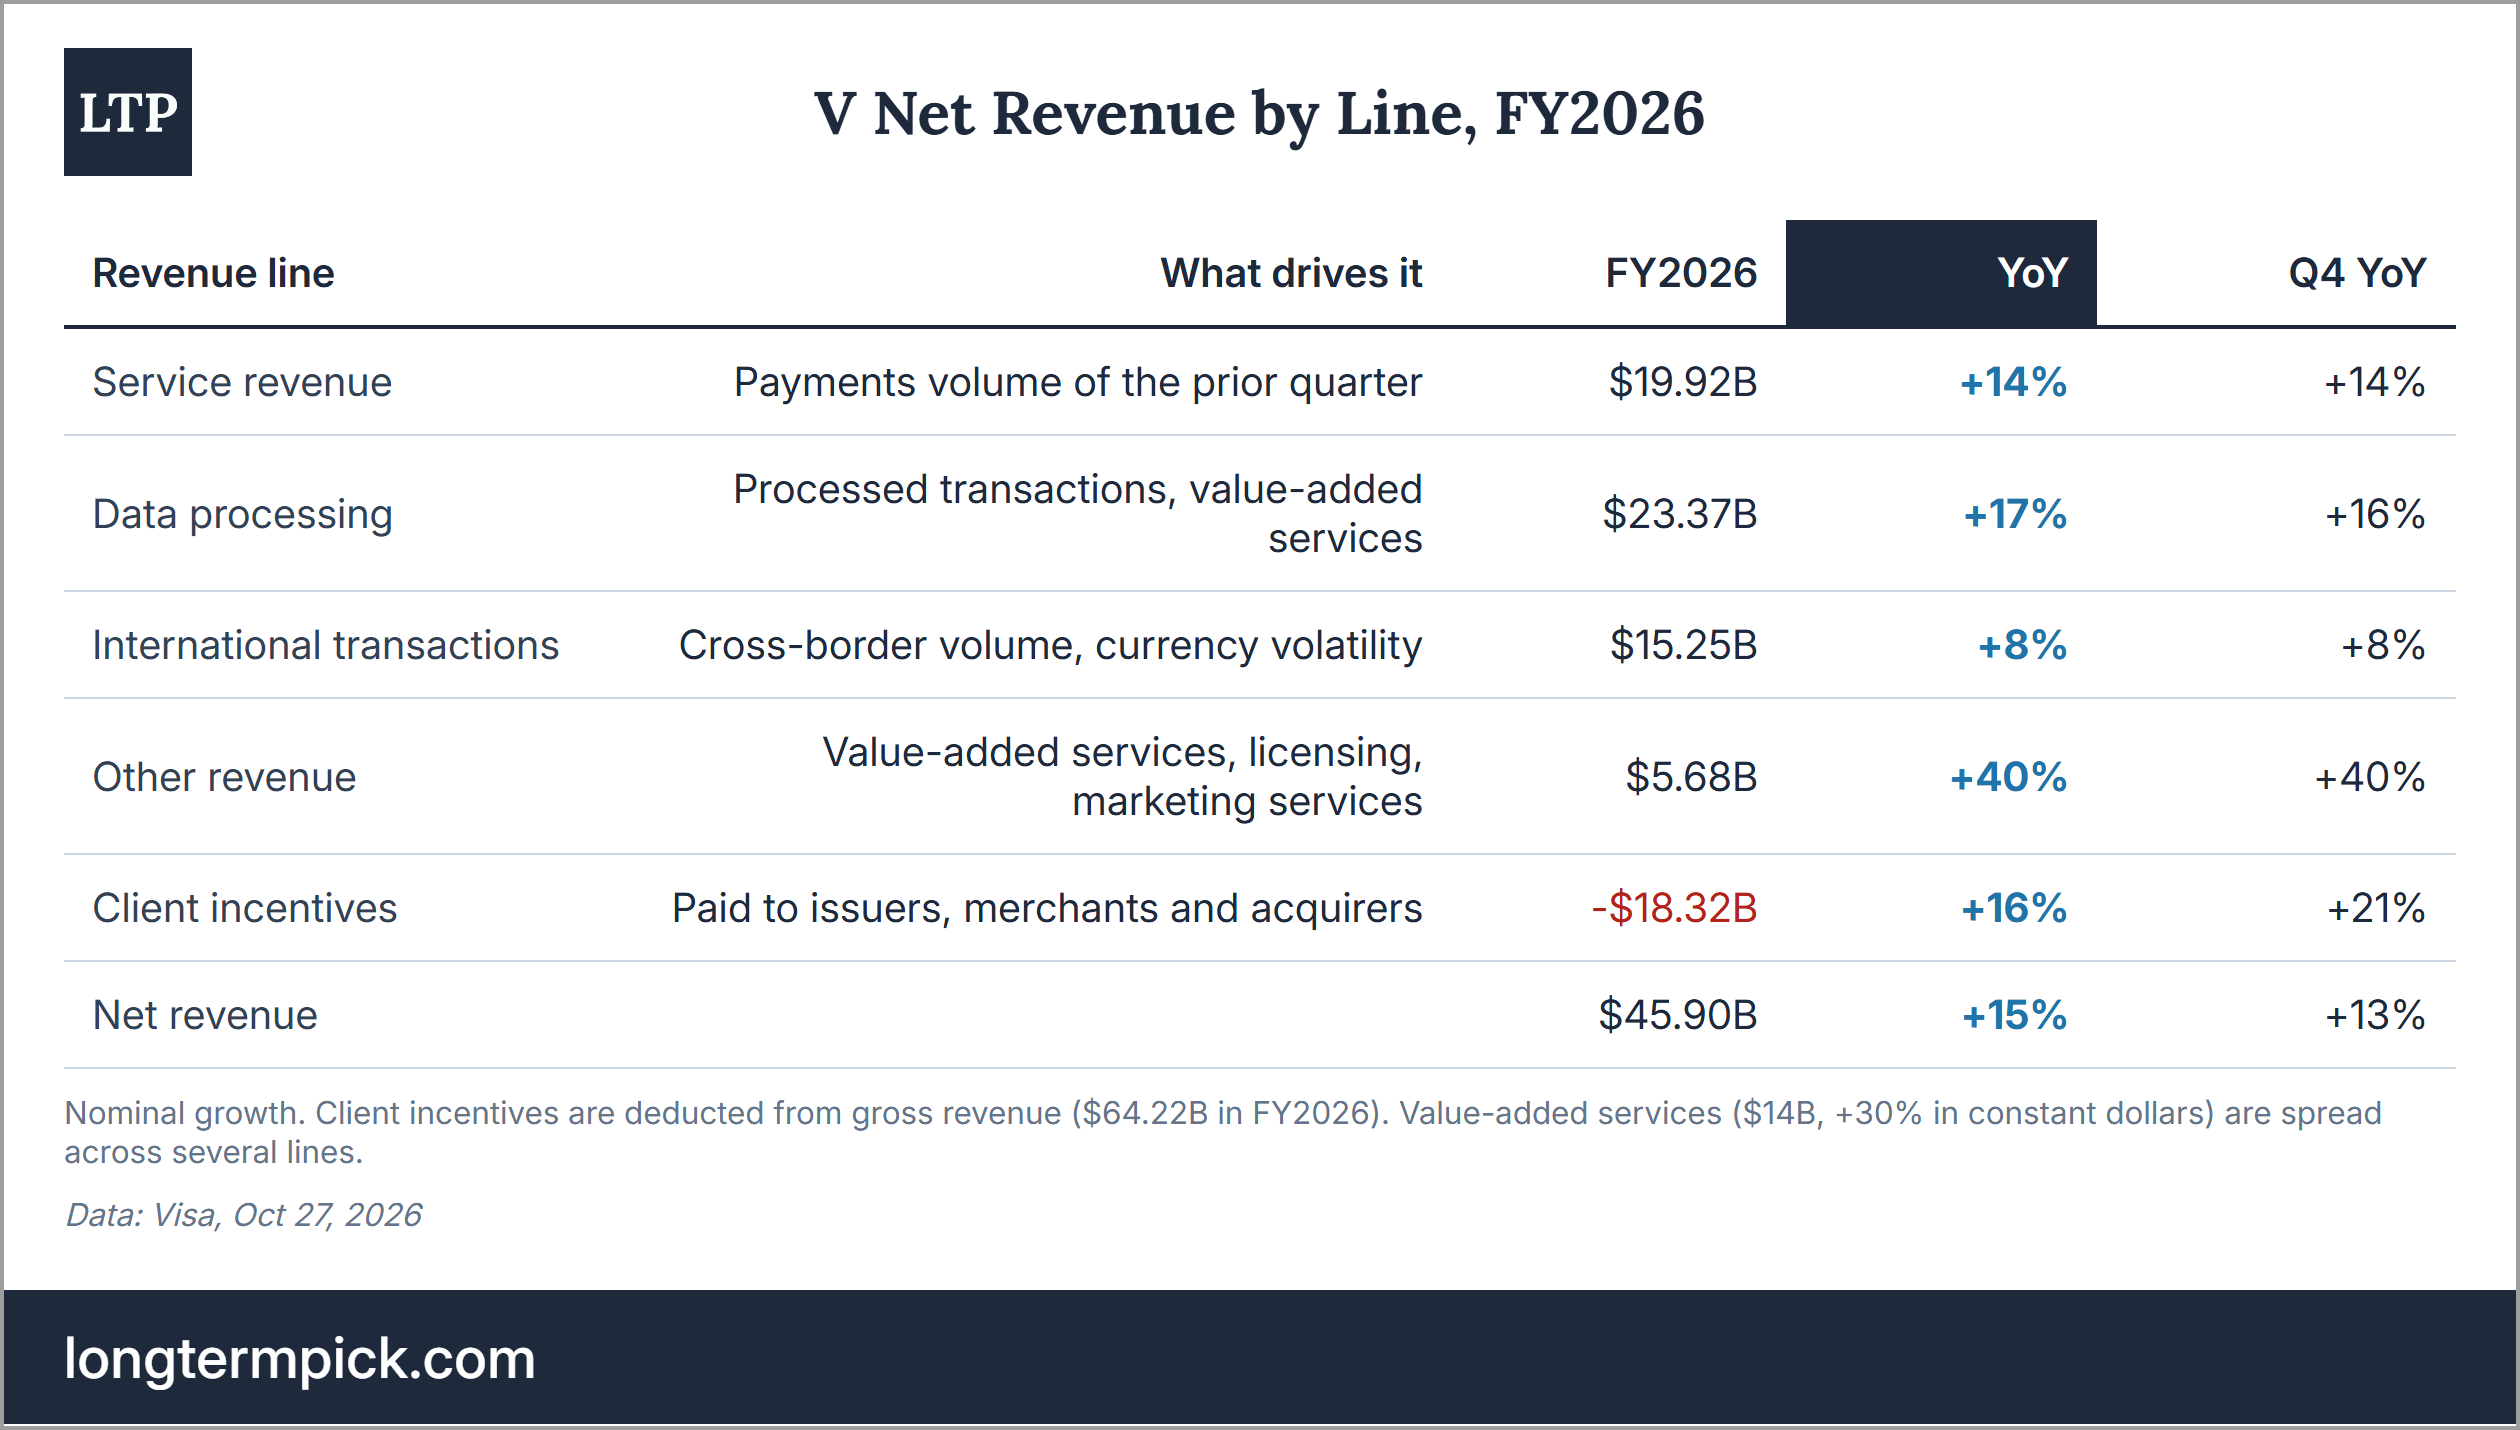
The business model is a fee on every step of a payment. Visa earns service revenue on payments volume (with a 1-quarter delay), data processing revenue on every authorization, clearing and settlement, international transaction revenue on cross-border payments and currency conversion, and other revenue from value-added services, licensing and marketing services. From this gross revenue, Visa deducts client incentives, the payments to banks, merchants and acquirers for using Visa. In FY2026, gross revenue was $64.22B, incentives were $18.32B (28.5% of it), and net revenue was $45.90B.
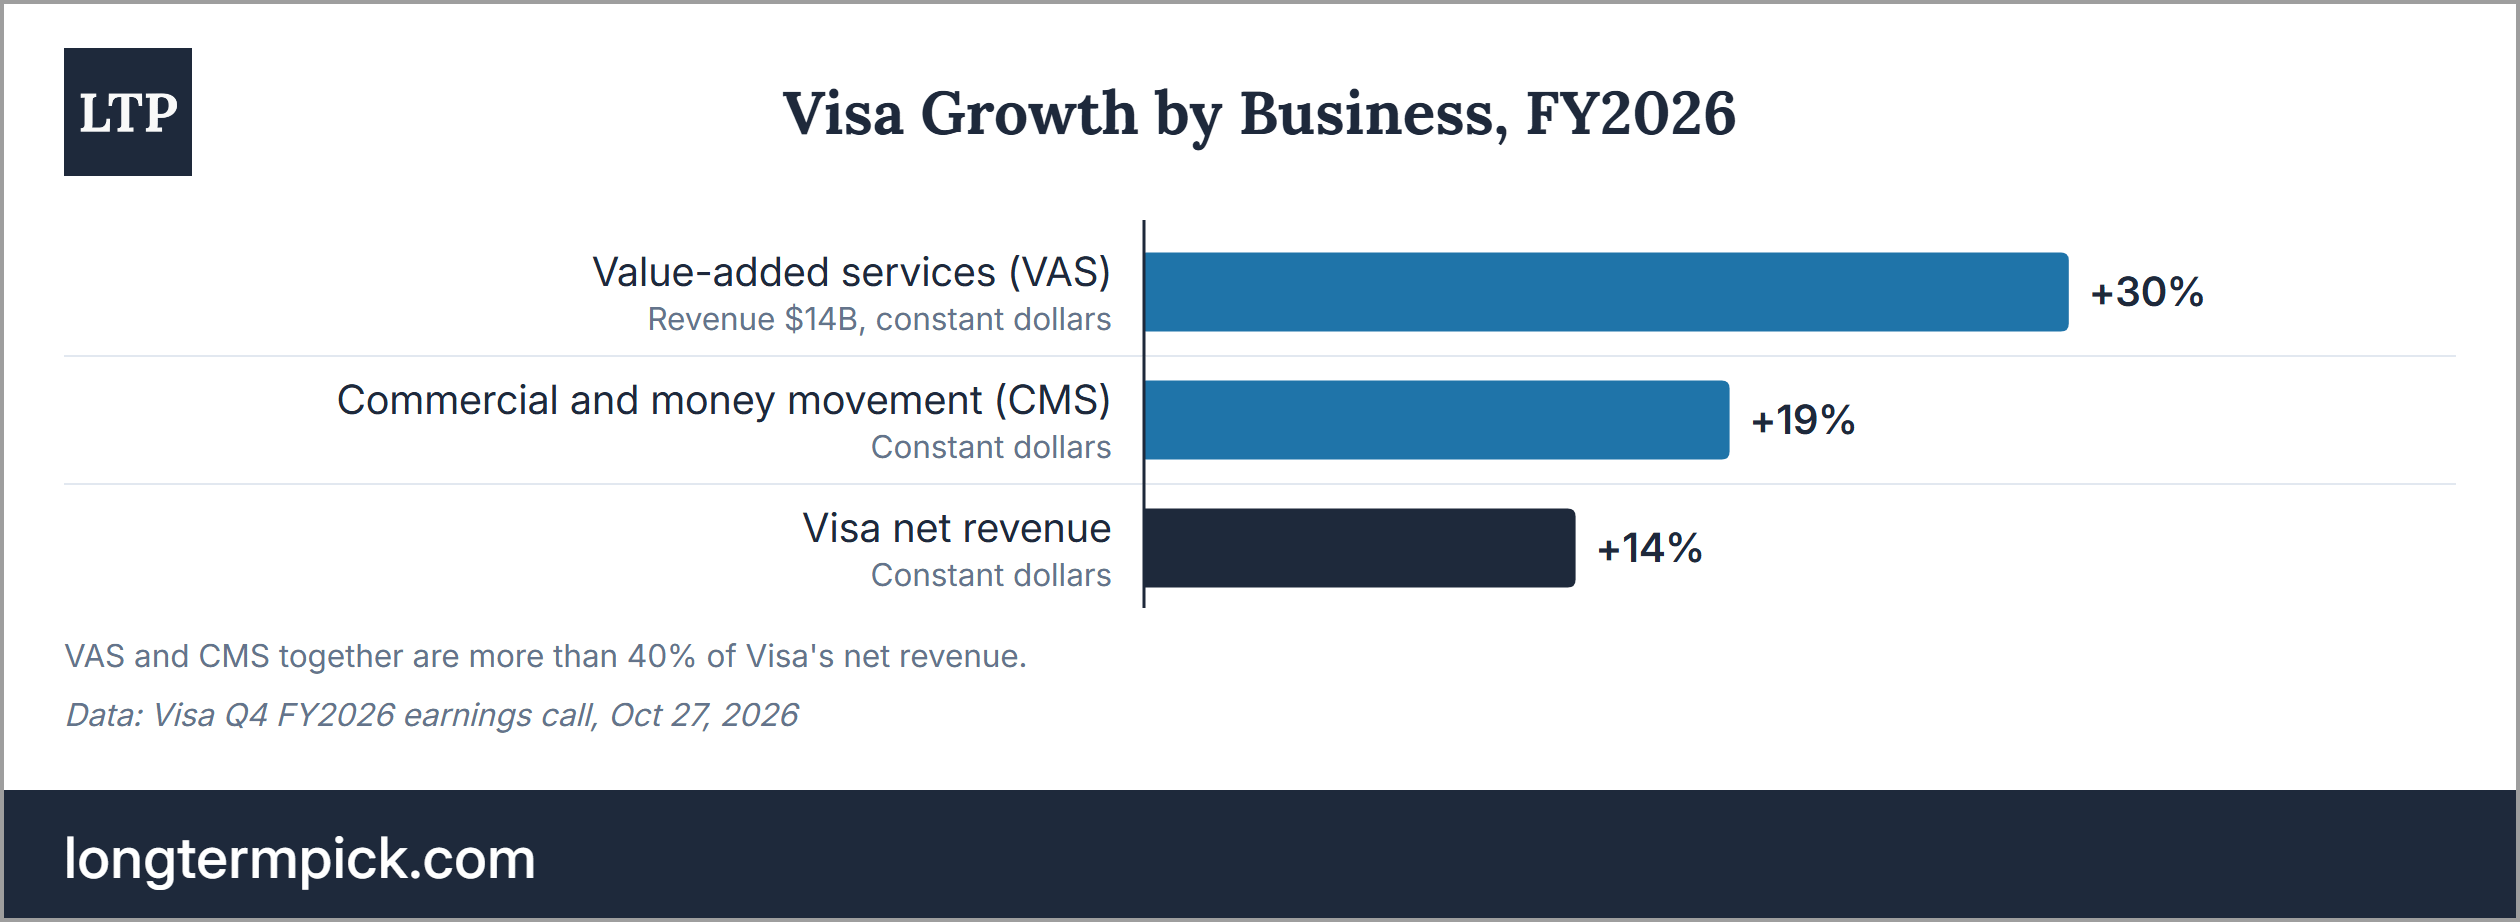
The growth now comes from more than card payments. Visa calls its two newer businesses value-added services (VAS: fraud and risk tools, issuer processing, data, consulting, marketing services) and commercial and money movement solutions (CMS: business payments and Visa Direct, its system for sending money to cards and accounts). In FY2026, VAS revenue grew 30% in constant dollars to $14B, and CMS revenue grew 19%. Together, they are "more than 40% of our total net revenue," as Visa said on the earnings call. This matters for the thesis, since these businesses grow faster than the card network itself.
Market Overview
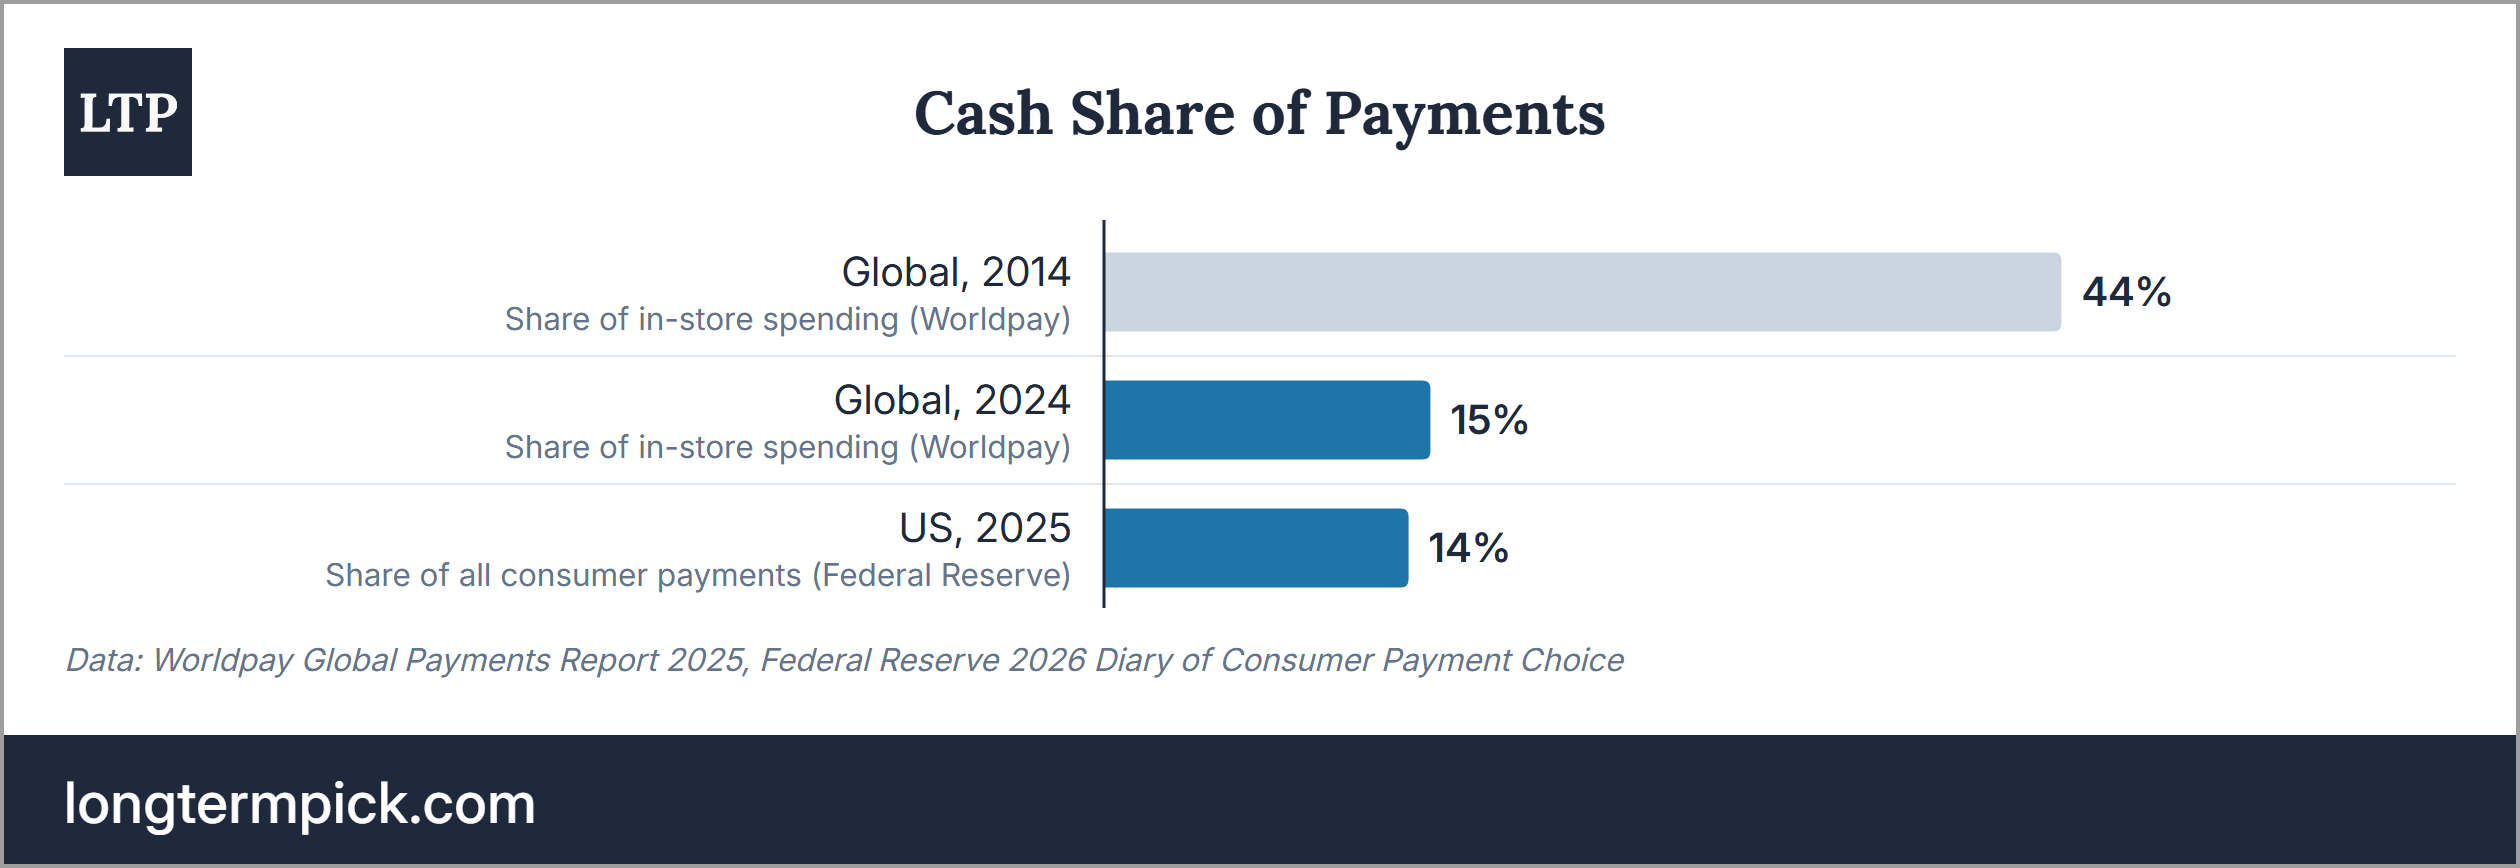
Cards keep taking share from cash. In the US, cash was 14% of consumer payments in 2025, against about a third in 2016, according to the Federal Reserve’s 2026 Diary of Consumer Payment Choice. Credit and debit cards were ~2/3 of all payments, and the Fed describes cash use as stable after the pandemic drop. Globally, cash was 15% of in-store spending in 2024, against 44% in 2014, according to Worldpay. Visa itself estimates more than $20 trillion of consumer spending a year that still goes through cash, checks and bank transfers. So there is room to grow, but the conversion from cash is now slower in the developed markets.
The payments pool grows slower than the card networks. McKinsey’s 2026 Global Payments Report puts global payments revenue (banks, networks and processors together) at $2.6 trillion in 2025, up only ~3%, and expects ~4% a year to 2030 (Payments Dive’s summary). At the same time, Visa and Mastercard purchase volume grew 8.9% in the first 9 months of 2025, to $17.1 trillion, according to the Nilson Report, and Visa’s net revenue grew 15% in FY2026. In my view, this is the core of both the investment case and the risk. The networks take a growing share of a slowly growing pool, and this is exactly why merchants, regulators and banks push back.
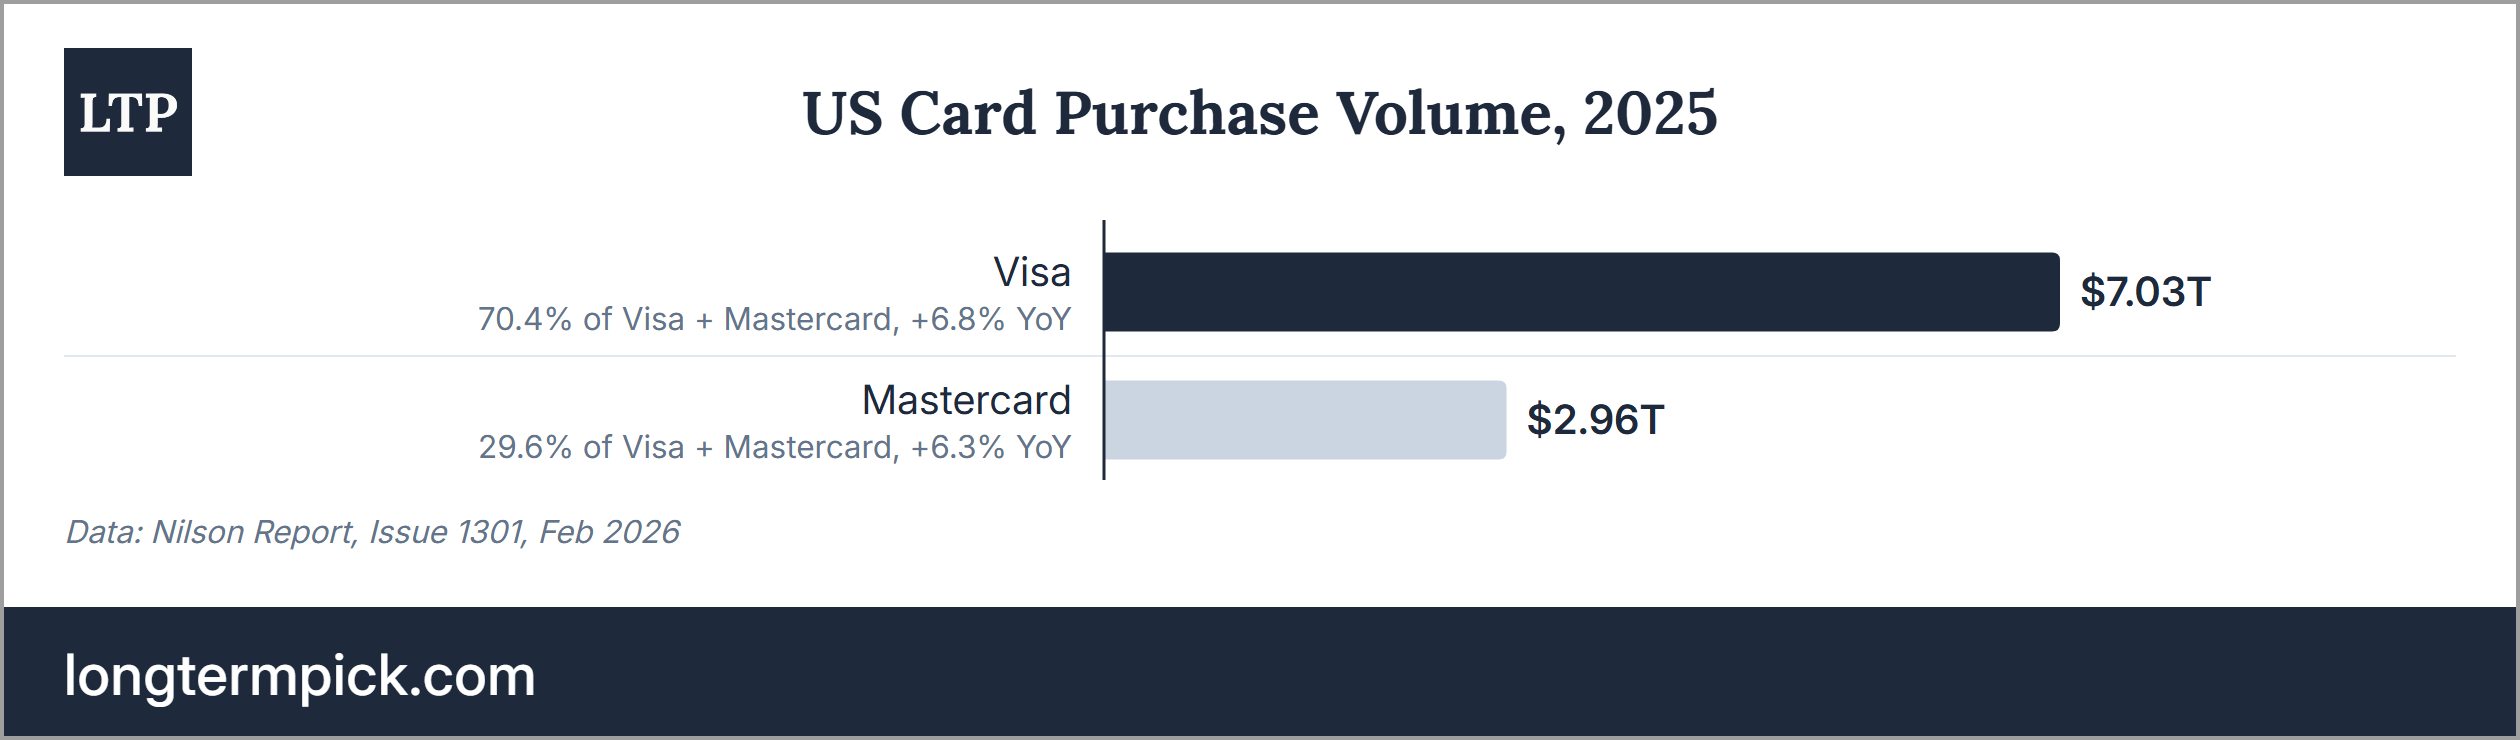
Visa is the largest network in the world, and in the US, the dominant one. In 2025, the six global card brands handled 828.1 billion purchase transactions (+7.1%), and Visa had 40.76% of them (Nilson). In the US, Visa cards generated $7.03 trillion of purchase volume against $2.96 trillion for Mastercard, so Visa has 70.4% of the two together (Nilson). This scale is the moat, and it is also the reason for the US Justice Department lawsuit.
New payment rails grow fastest where governments push them. In Brazil, Pix (the instant payment system of the central bank) was 55.2% of all payments in the first half of 2026, and debit card transactions grew only 0.5% (The Rio Times, on central bank data). In India, UPI processed 24.07 billion transactions in September, +23% YoY. In the US, Zelle moved more than $1.2 trillion in 2025, +20% (Zelle). At the same time, Mastercard’s Latin America volume still grew 13.5% in its Q3 2026 report. As I see it, these rails mostly replace cash and debit in their home markets, and Visa answers them with Visa Direct and stablecoin settlement rather than competing for every domestic transfer.
Analyst’s note:
A payment rail is a payment platform or a payment network that moves money from a payer to a payee.
Regulation is the main market risk, and it moved again in October. On Oct 26, a US appeals court upheld the ruling that the Federal Reserve set the cap on debit interchange too high, so the Fed has to rewrite it. The interchange goes to the banks, not to Visa, but if banks earn less on debit, they can ask Visa for larger incentives. The Credit Card Competition Act, which would require large banks to add a second network to credit cards, was reintroduced in January with Trump’s support. Its sponsors wanted to attach it to a housing bill, but in March the Senate passed that bill without it. The merchant settlement that cuts US credit interchange by 10 basis points for 5 years and lets merchants decline some premium cards got preliminary approval in June and waits for final approval. And in the Justice Department’s debit lawsuit, filed in 2024, discovery was extended to Jan 29, 2027, with a trial likely in 2028. Separately, Capital One moved ~25M debit cards from Mastercard to its own Discover network, and it is now testing some credit cards there, which moves them off Visa.
Economic Moat
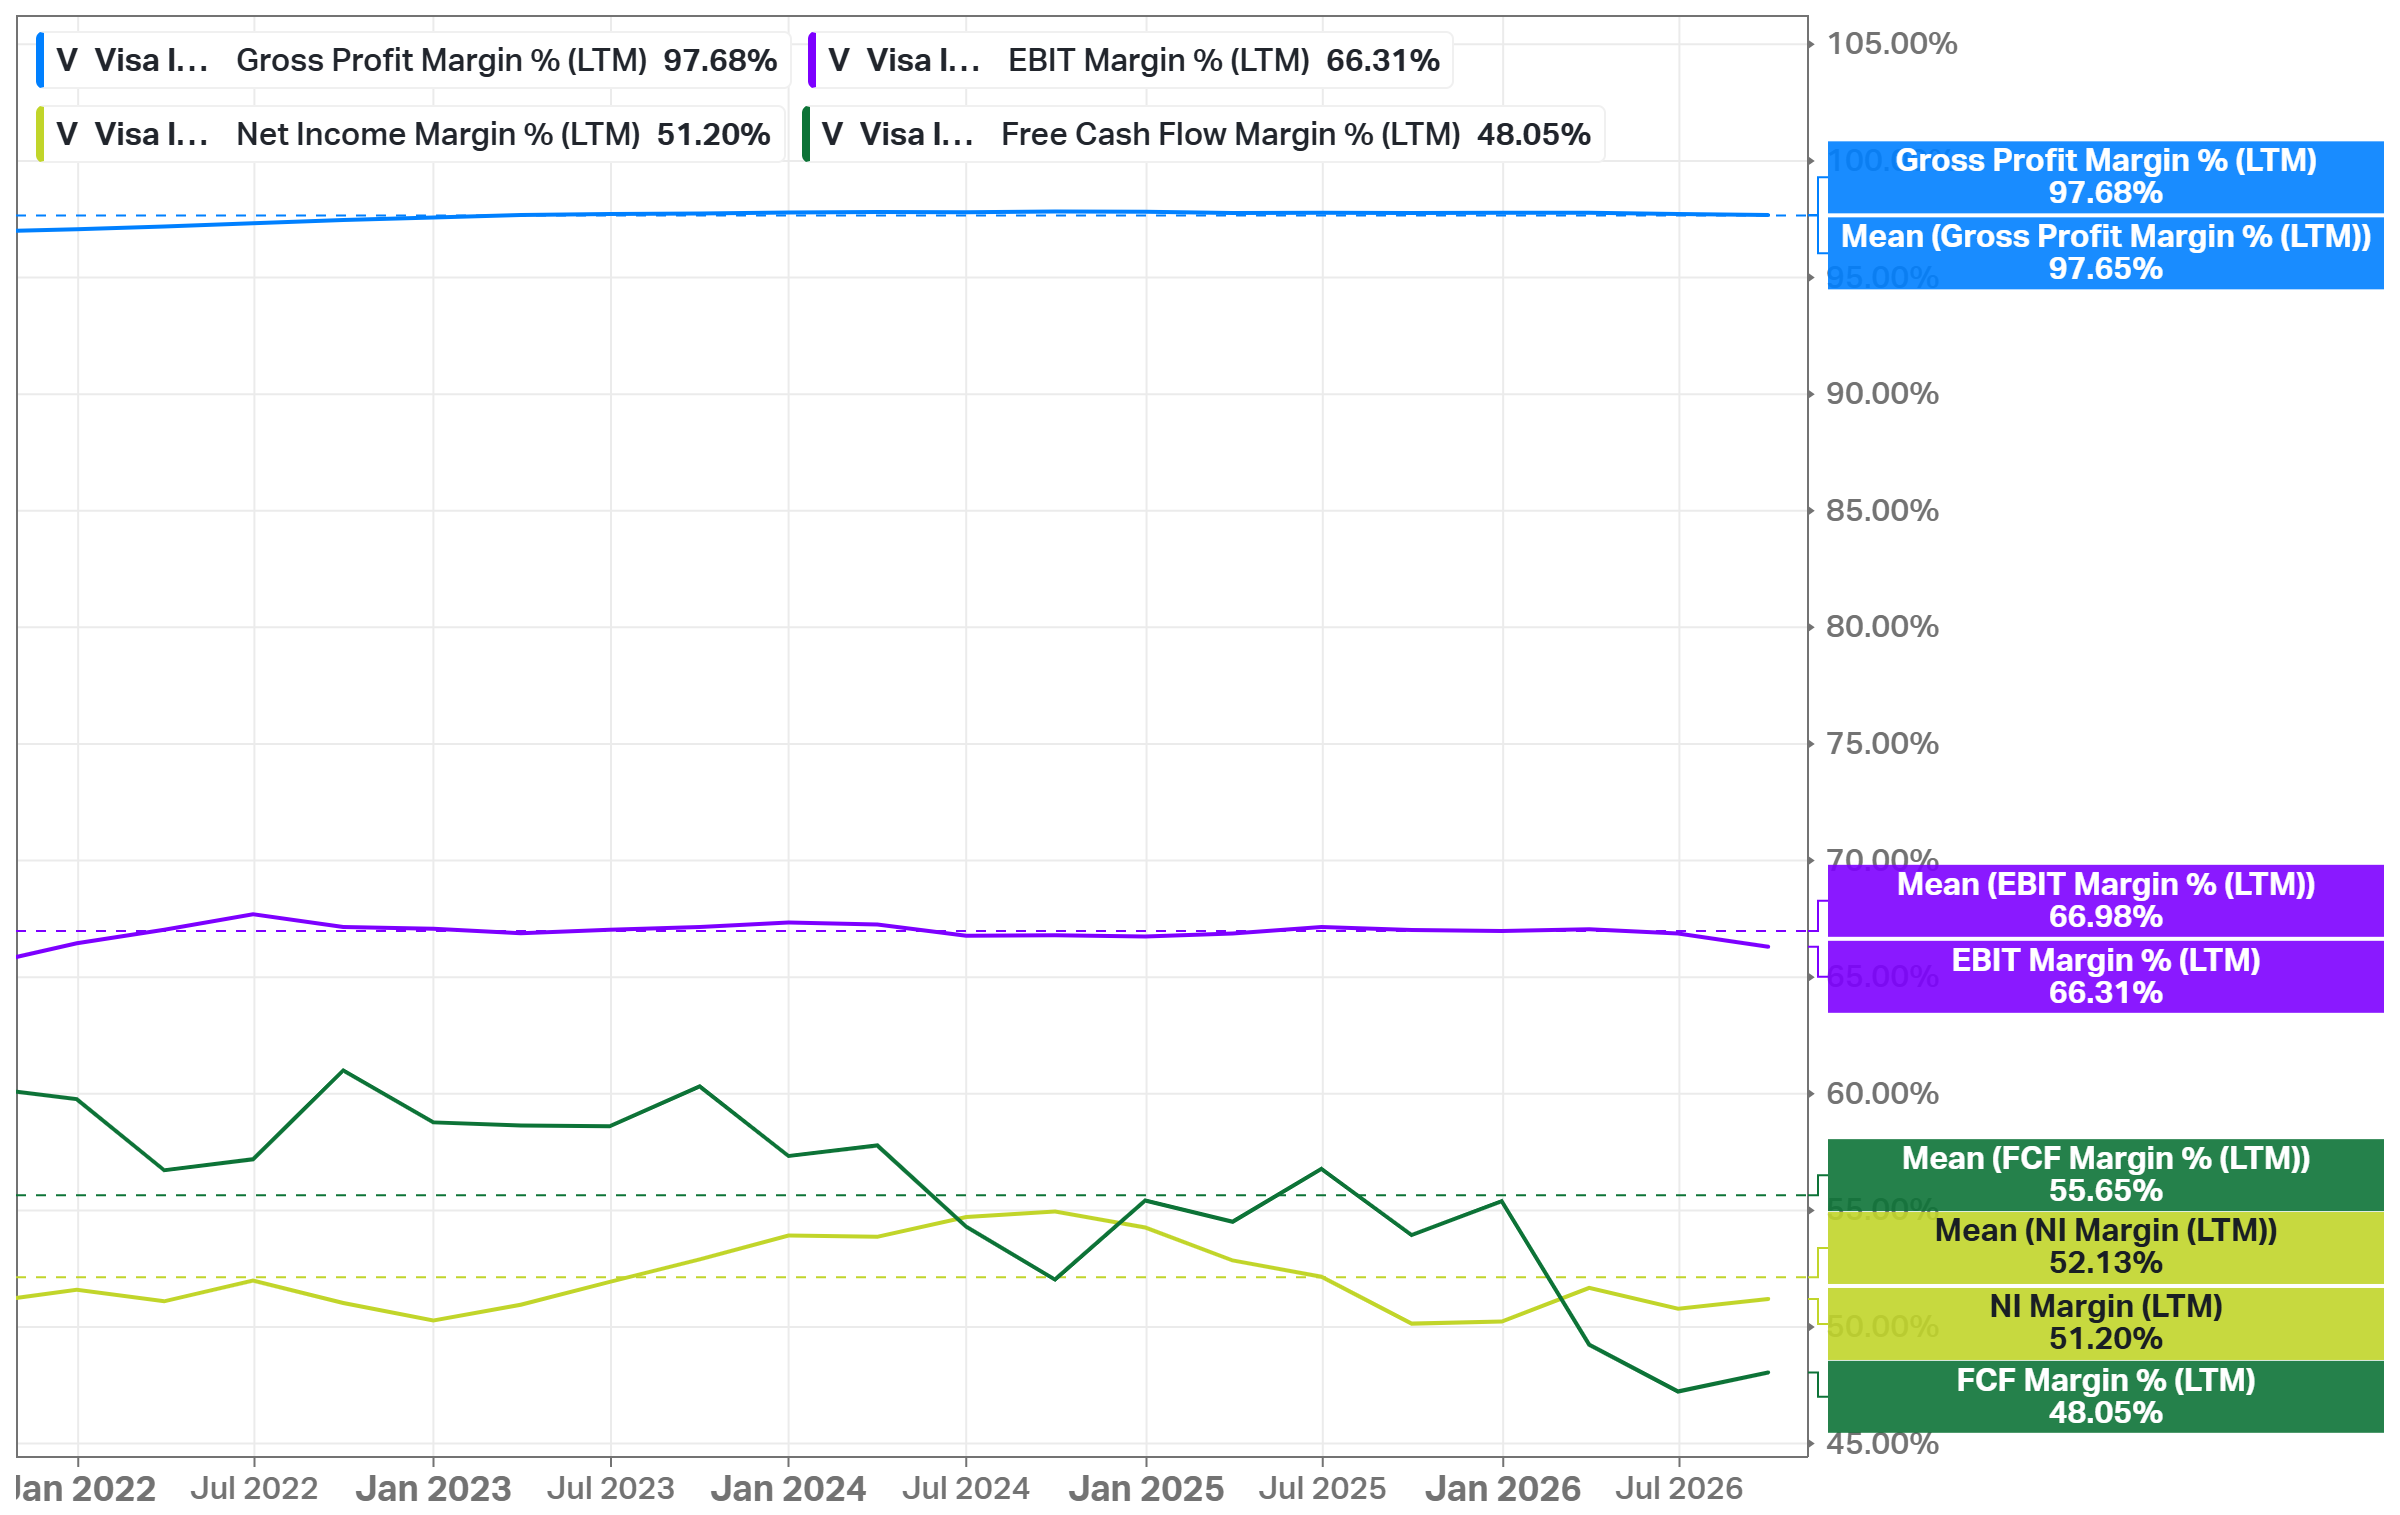
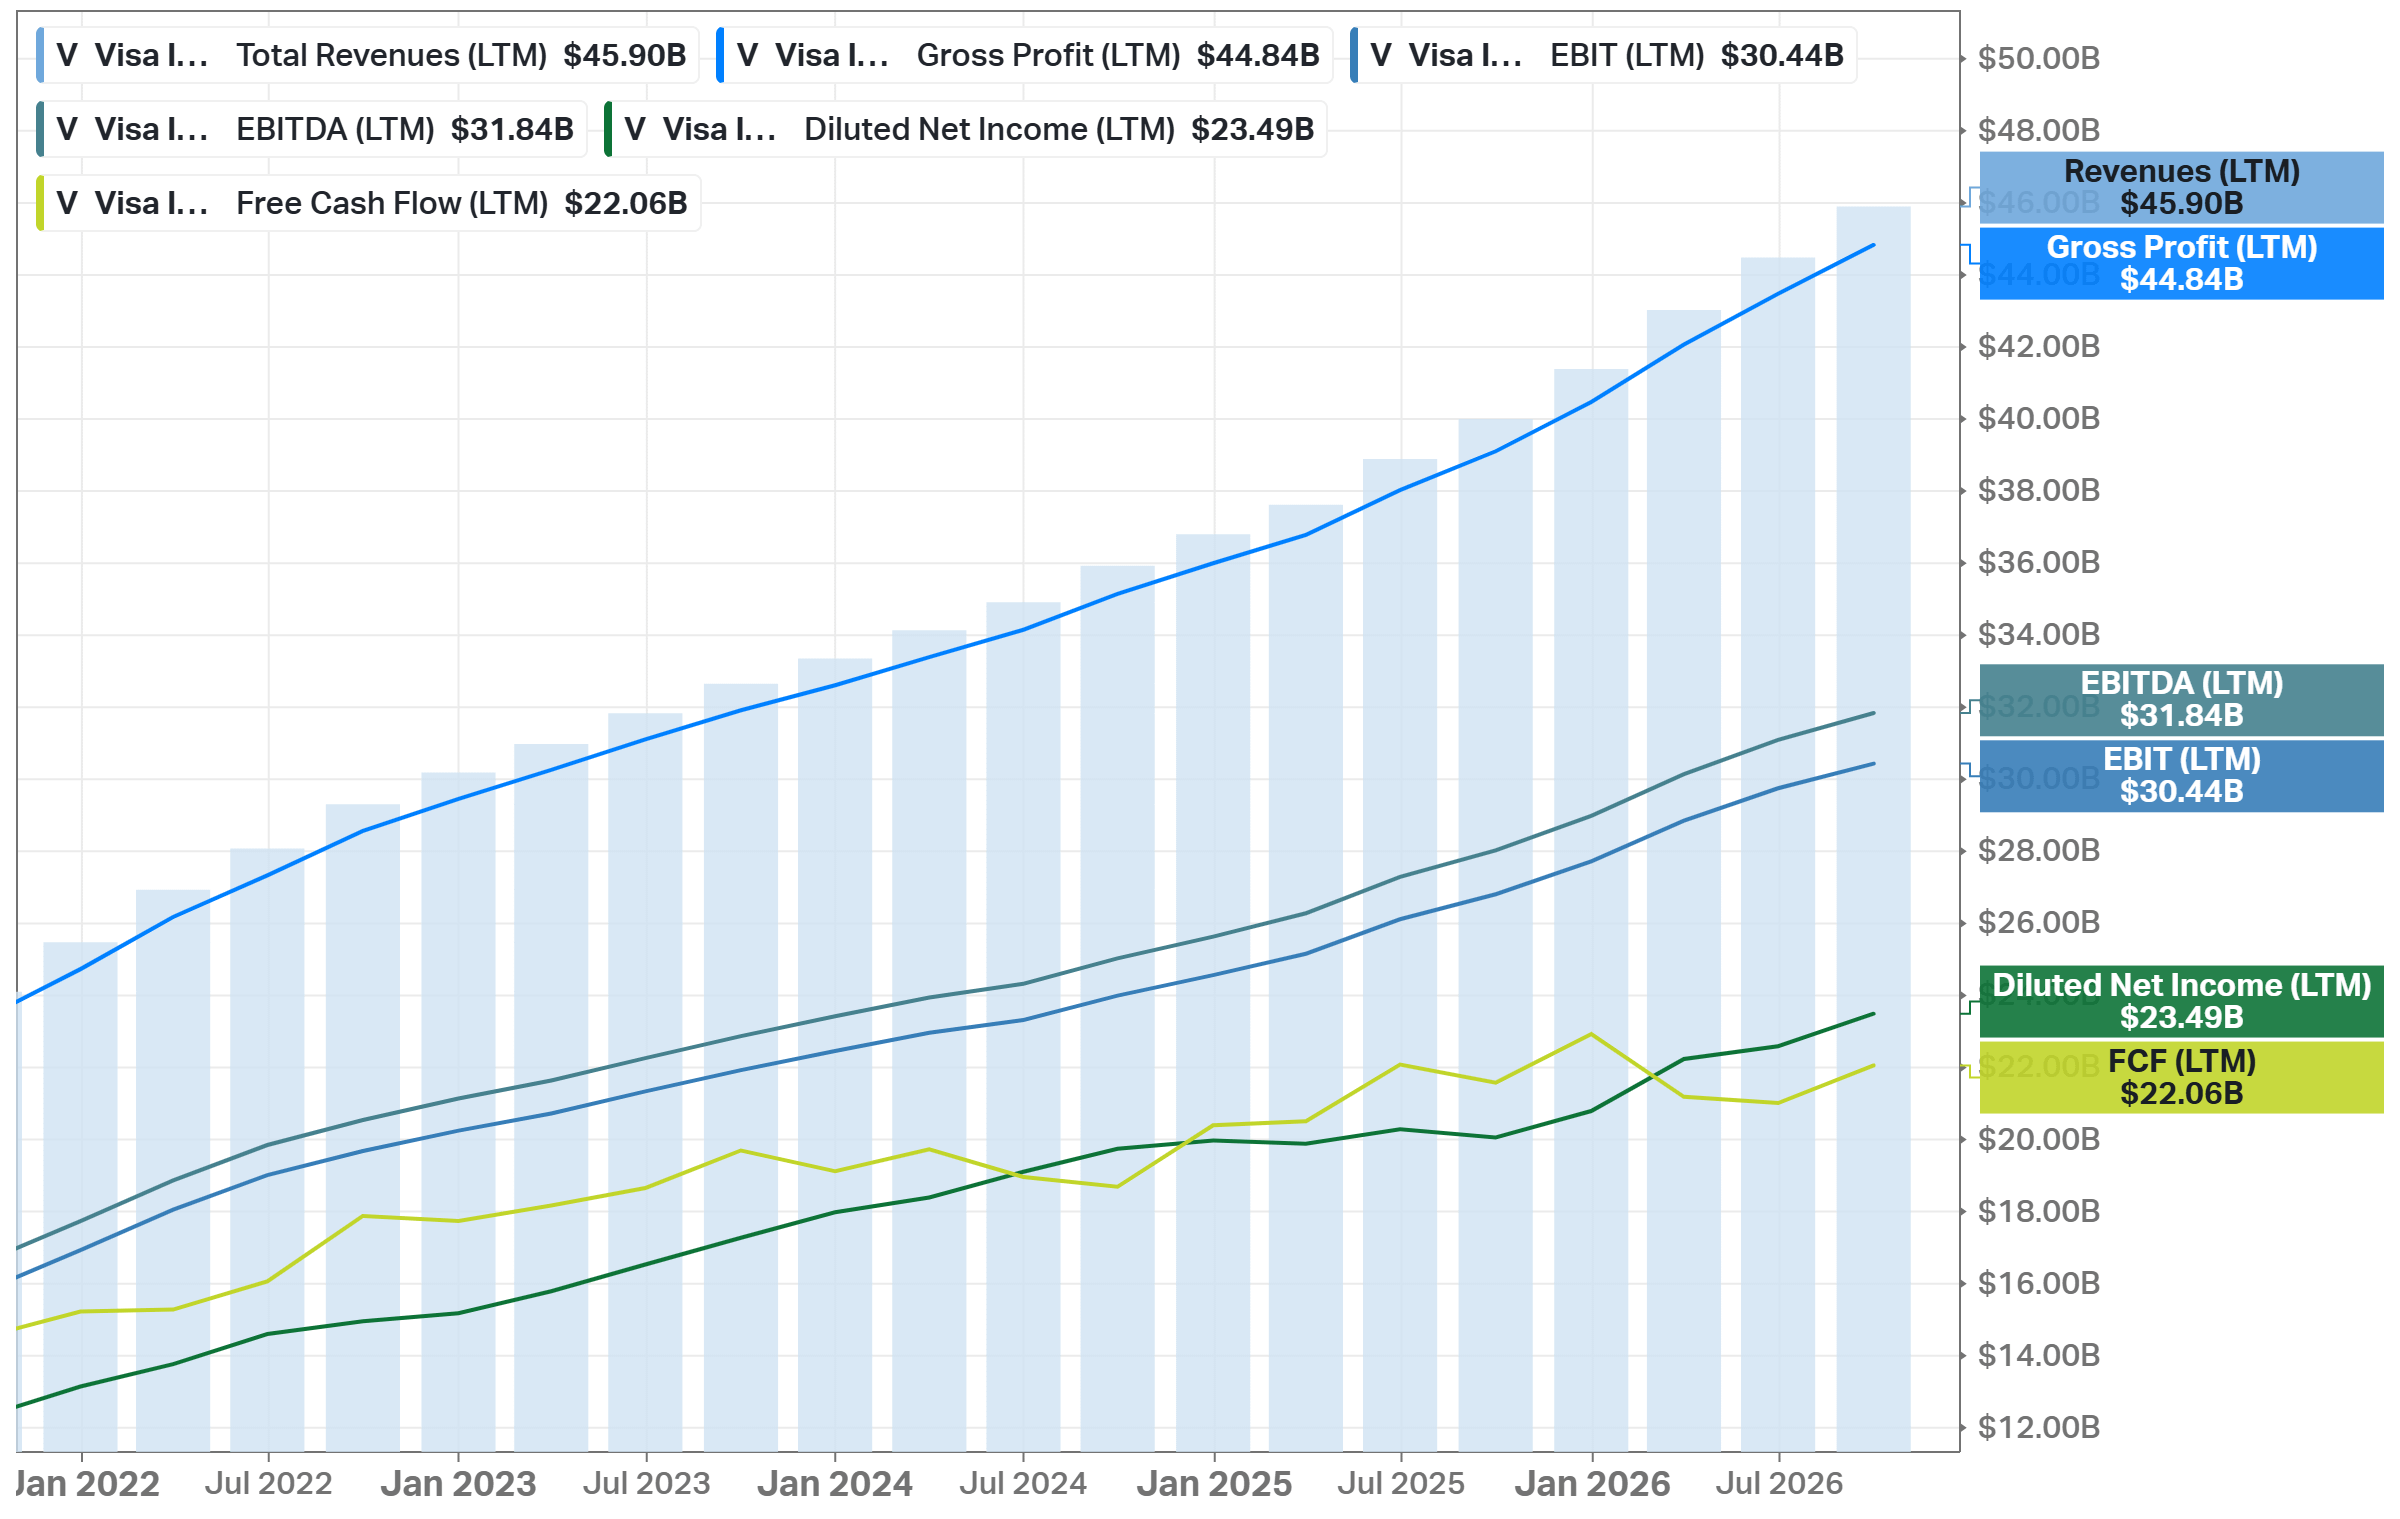
The margins are stable at a level few companies reach. The LTM net margin is 51.20% (5Y mean: 52.13%), and the EBIT margin is 66.31% (66.98%). Koyfin shows a 97.68% gross margin, but Visa does not report a cost of revenue, so this number says little. On a non-GAAP basis, the operating margin was 67.5% in FY2026, against 67.7% in FY2025. The net and EBIT margins are within ~1 point of their means. The real gap is FCF, 48.05% against 55.65%, and most of it is the litigation payments of FY2026.
The moat is a two-sided network. Banks issue Visa cards because more than 200 million seller locations accept them, and merchants accept Visa because billions of people have the cards. A new network has to build both sides at once, which is why global card payments are concentrated in a few networks. The cost of one more transaction on VisaNet is close to zero, so revenue growth can turn into profit with little extra cost. In FY2026, Visa spent the extra on marketing and people, so the margin stayed flat.
The best evidence is that revenue grows faster than volume. In Q4, service revenue grew 14%, “primarily due to pricing”, on 10% growth in Q3 payments volume, the base it is charged on. Processed transactions grew 10%, and data processing revenue 16%, because of pricing, a higher cross-border mix and value-added services. For FY2027, Visa expects new pricing “similar in magnitude and timing” to FY2026. For me, revenue growing faster than volume is the clearest proof that the moat is real.
The cost of the moat is client incentives. The pricing power works against merchants, but the banks that choose a network have their own power. Visa pays them to keep their cards on Visa, and in FY2026, incentives were 28.5% of gross revenue, against 28.3% in FY2025. In Q4, they increased 21% YoY to 29.7% of gross revenue. So Visa shares part of its moat with its largest clients, and this share is growing.
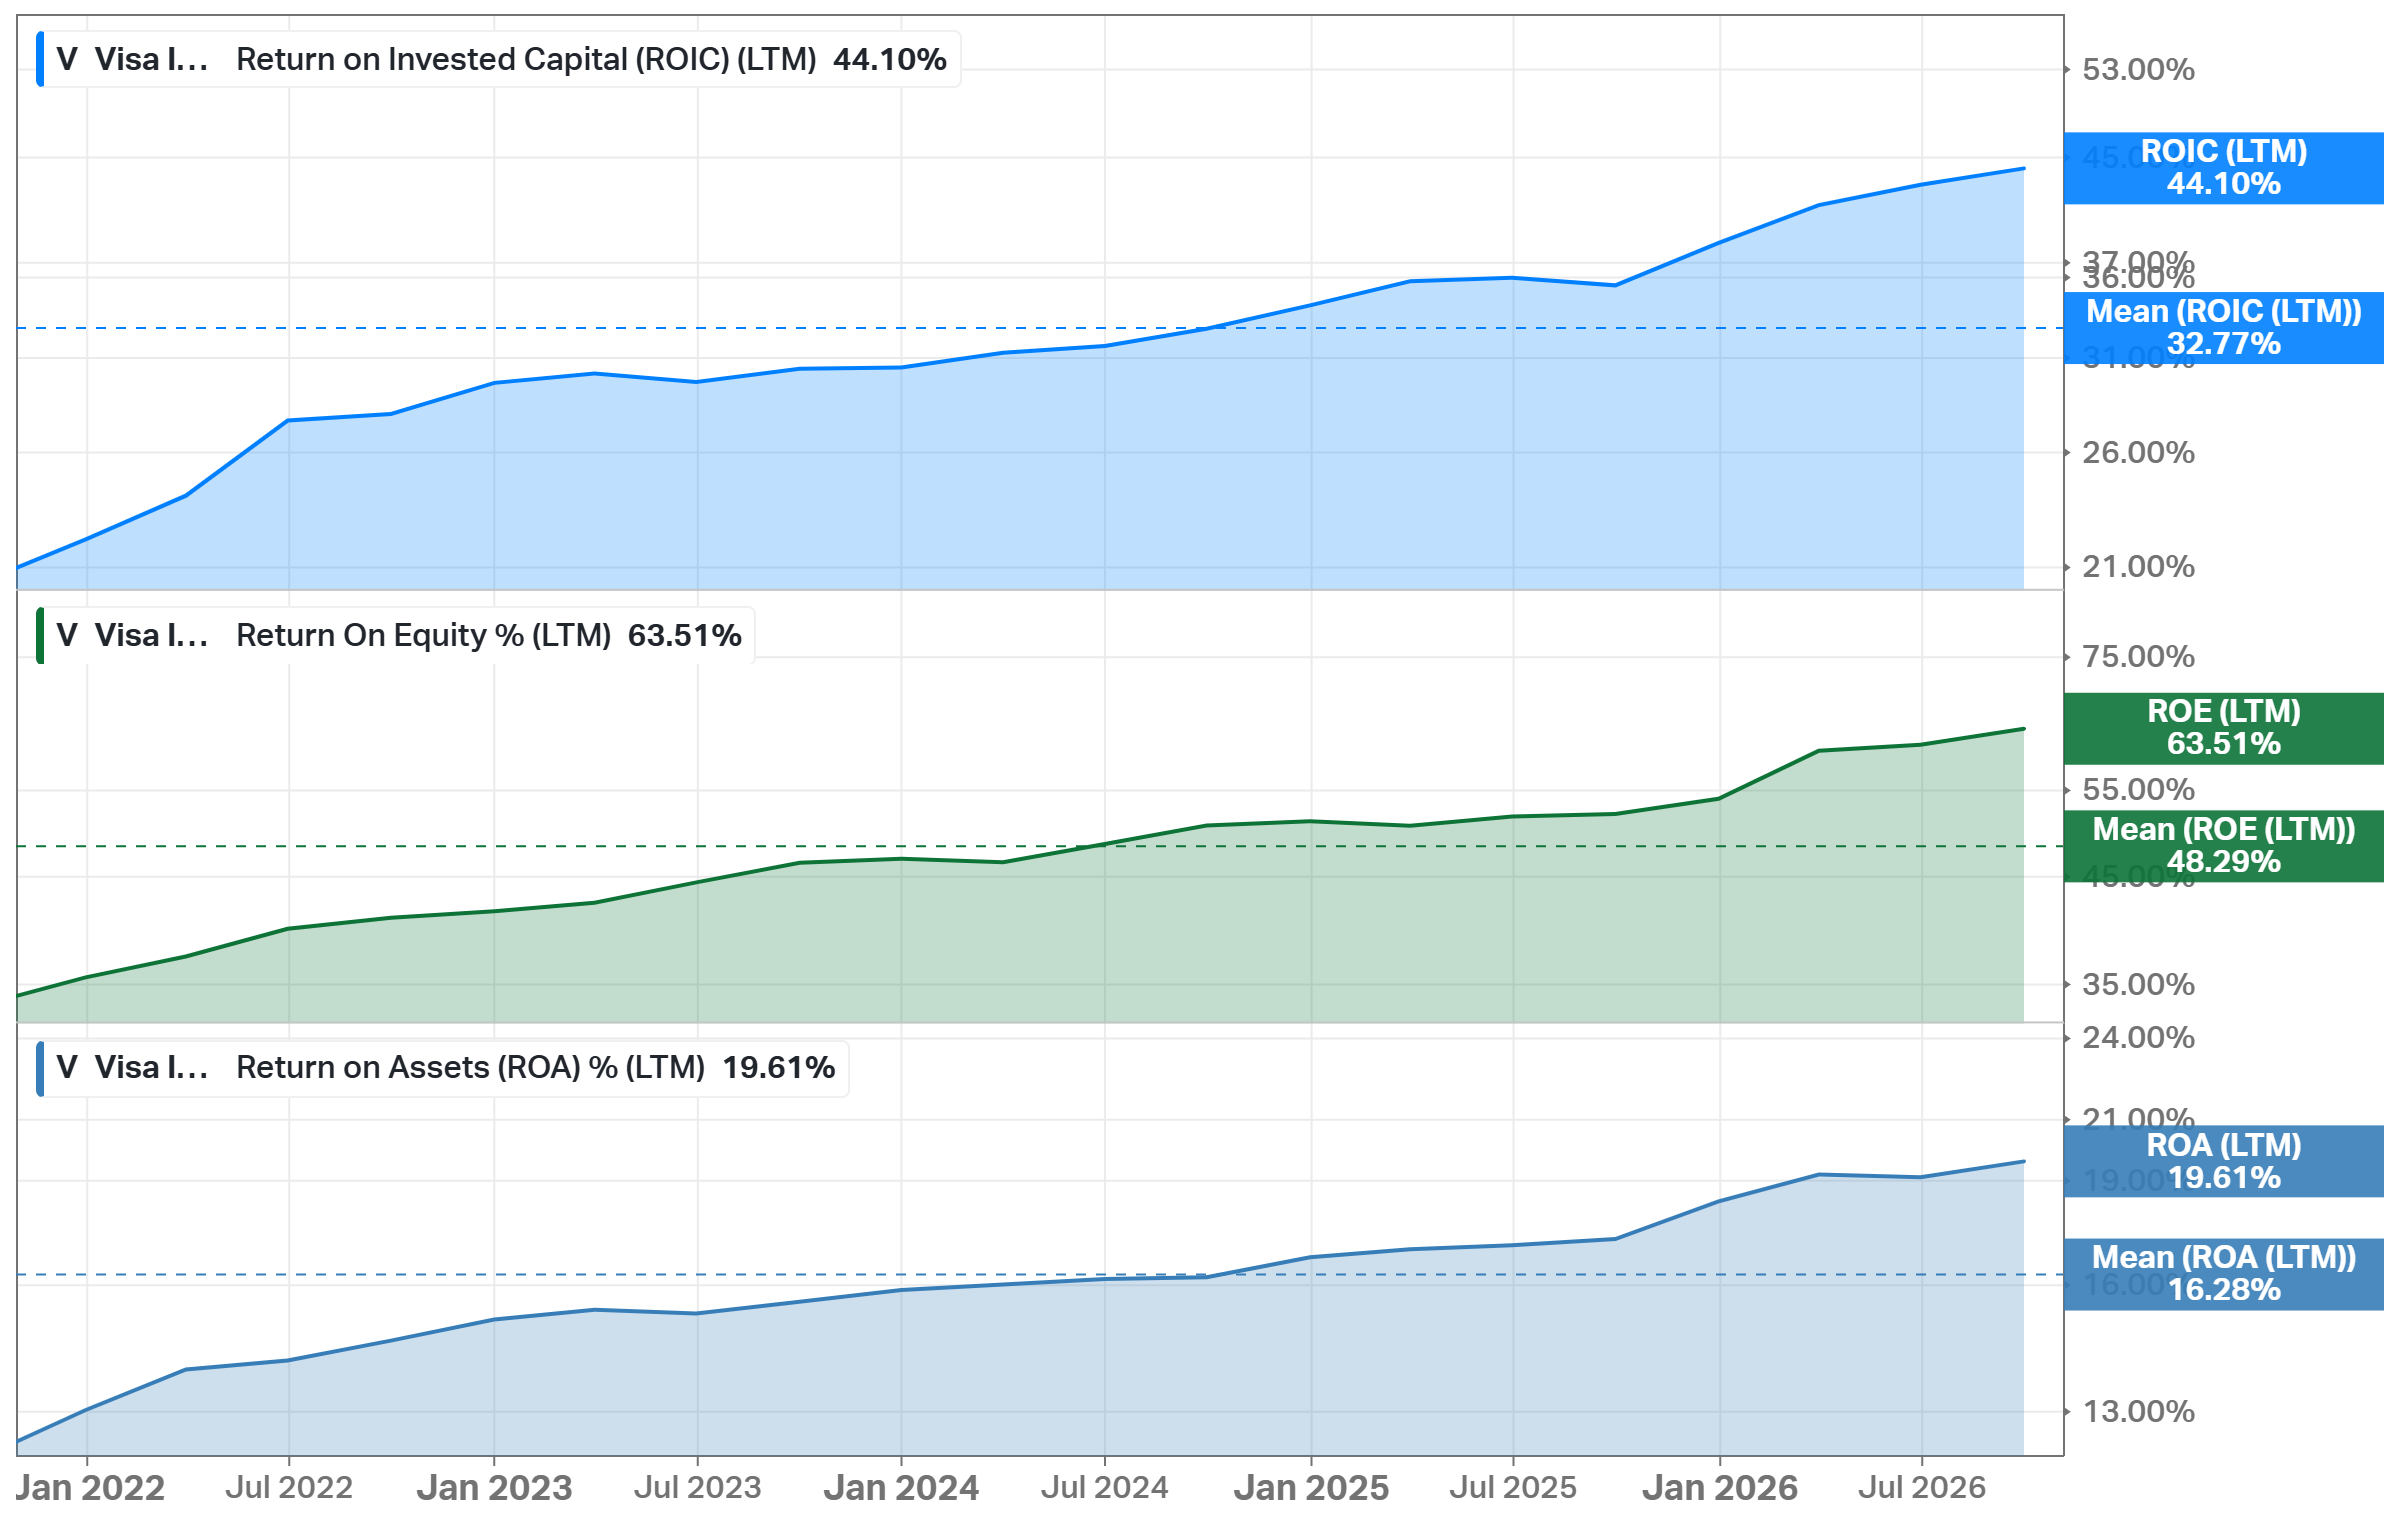
The returns show the same. ROIC is 44.10% (5Y mean: 32.77%), ROE 63.51% (48.29%), and ROA 19.61% (16.28%), and all three have increased every year since 2022. ROE is high partly because buybacks reduce equity (total equity decreased from $37.91B to $36.11B in FY2026). ROIC and ROA depend on it much less, and they increased too. In my view, Visa has a wide moat, and the question for the investment is not the moat but the price of the stock.
Business Strategy
Value-added services, the second business. VAS revenue reached $14B in FY2026, “essentially double our 2023 VAS revenue”. Its issuing, acceptance, and risk and security services grew more than 20% for the year. In Q4, the 31% growth came from three factors: the underlying business (including marketing services around the FIFA World Cup), pricing, and the Prisma acquisition. For FY2027, Visa expects VAS growth in the “low to mid-20s”. In August, it agreed to buy BioCatch, a fraud detection company that protects 1.8 billion devices for more than 100 large banks, for $2.4B in cash. The deal is expected to close by the end of March 2027. In my view, VAS is the main reason Visa grows faster than payments volume, and it makes Visa more useful to banks, not only to merchants.
Business payments and Visa Direct. Commercial payments volume grew 12% in FY2026, faster than consumer payments and the fastest in 8 years without the post-pandemic recovery. Visa Direct processed more than 15 billion transactions, about $1.5 trillion of volume, and its transactions grew 23% in Q4. This is the “new flows” part of the strategy: payments between businesses, from businesses to consumers, and between people, which are still mostly made by bank transfer or check.
The renewal year. In FY2027, contracts covering ~25% of Visa's payments volume come up for renewal, against 20% in FY2026, "including renewals with several large clients". This "implies a step-up" in the growth of incentives. Management says it manages "to net revenue growth", and the low-double-digit guidance already includes the renewals. As I see it, this is the key execution risk of FY2027. Long contracts are part of the moat, but this year many of them are repriced at the same time, and the large banks know their bargaining power.
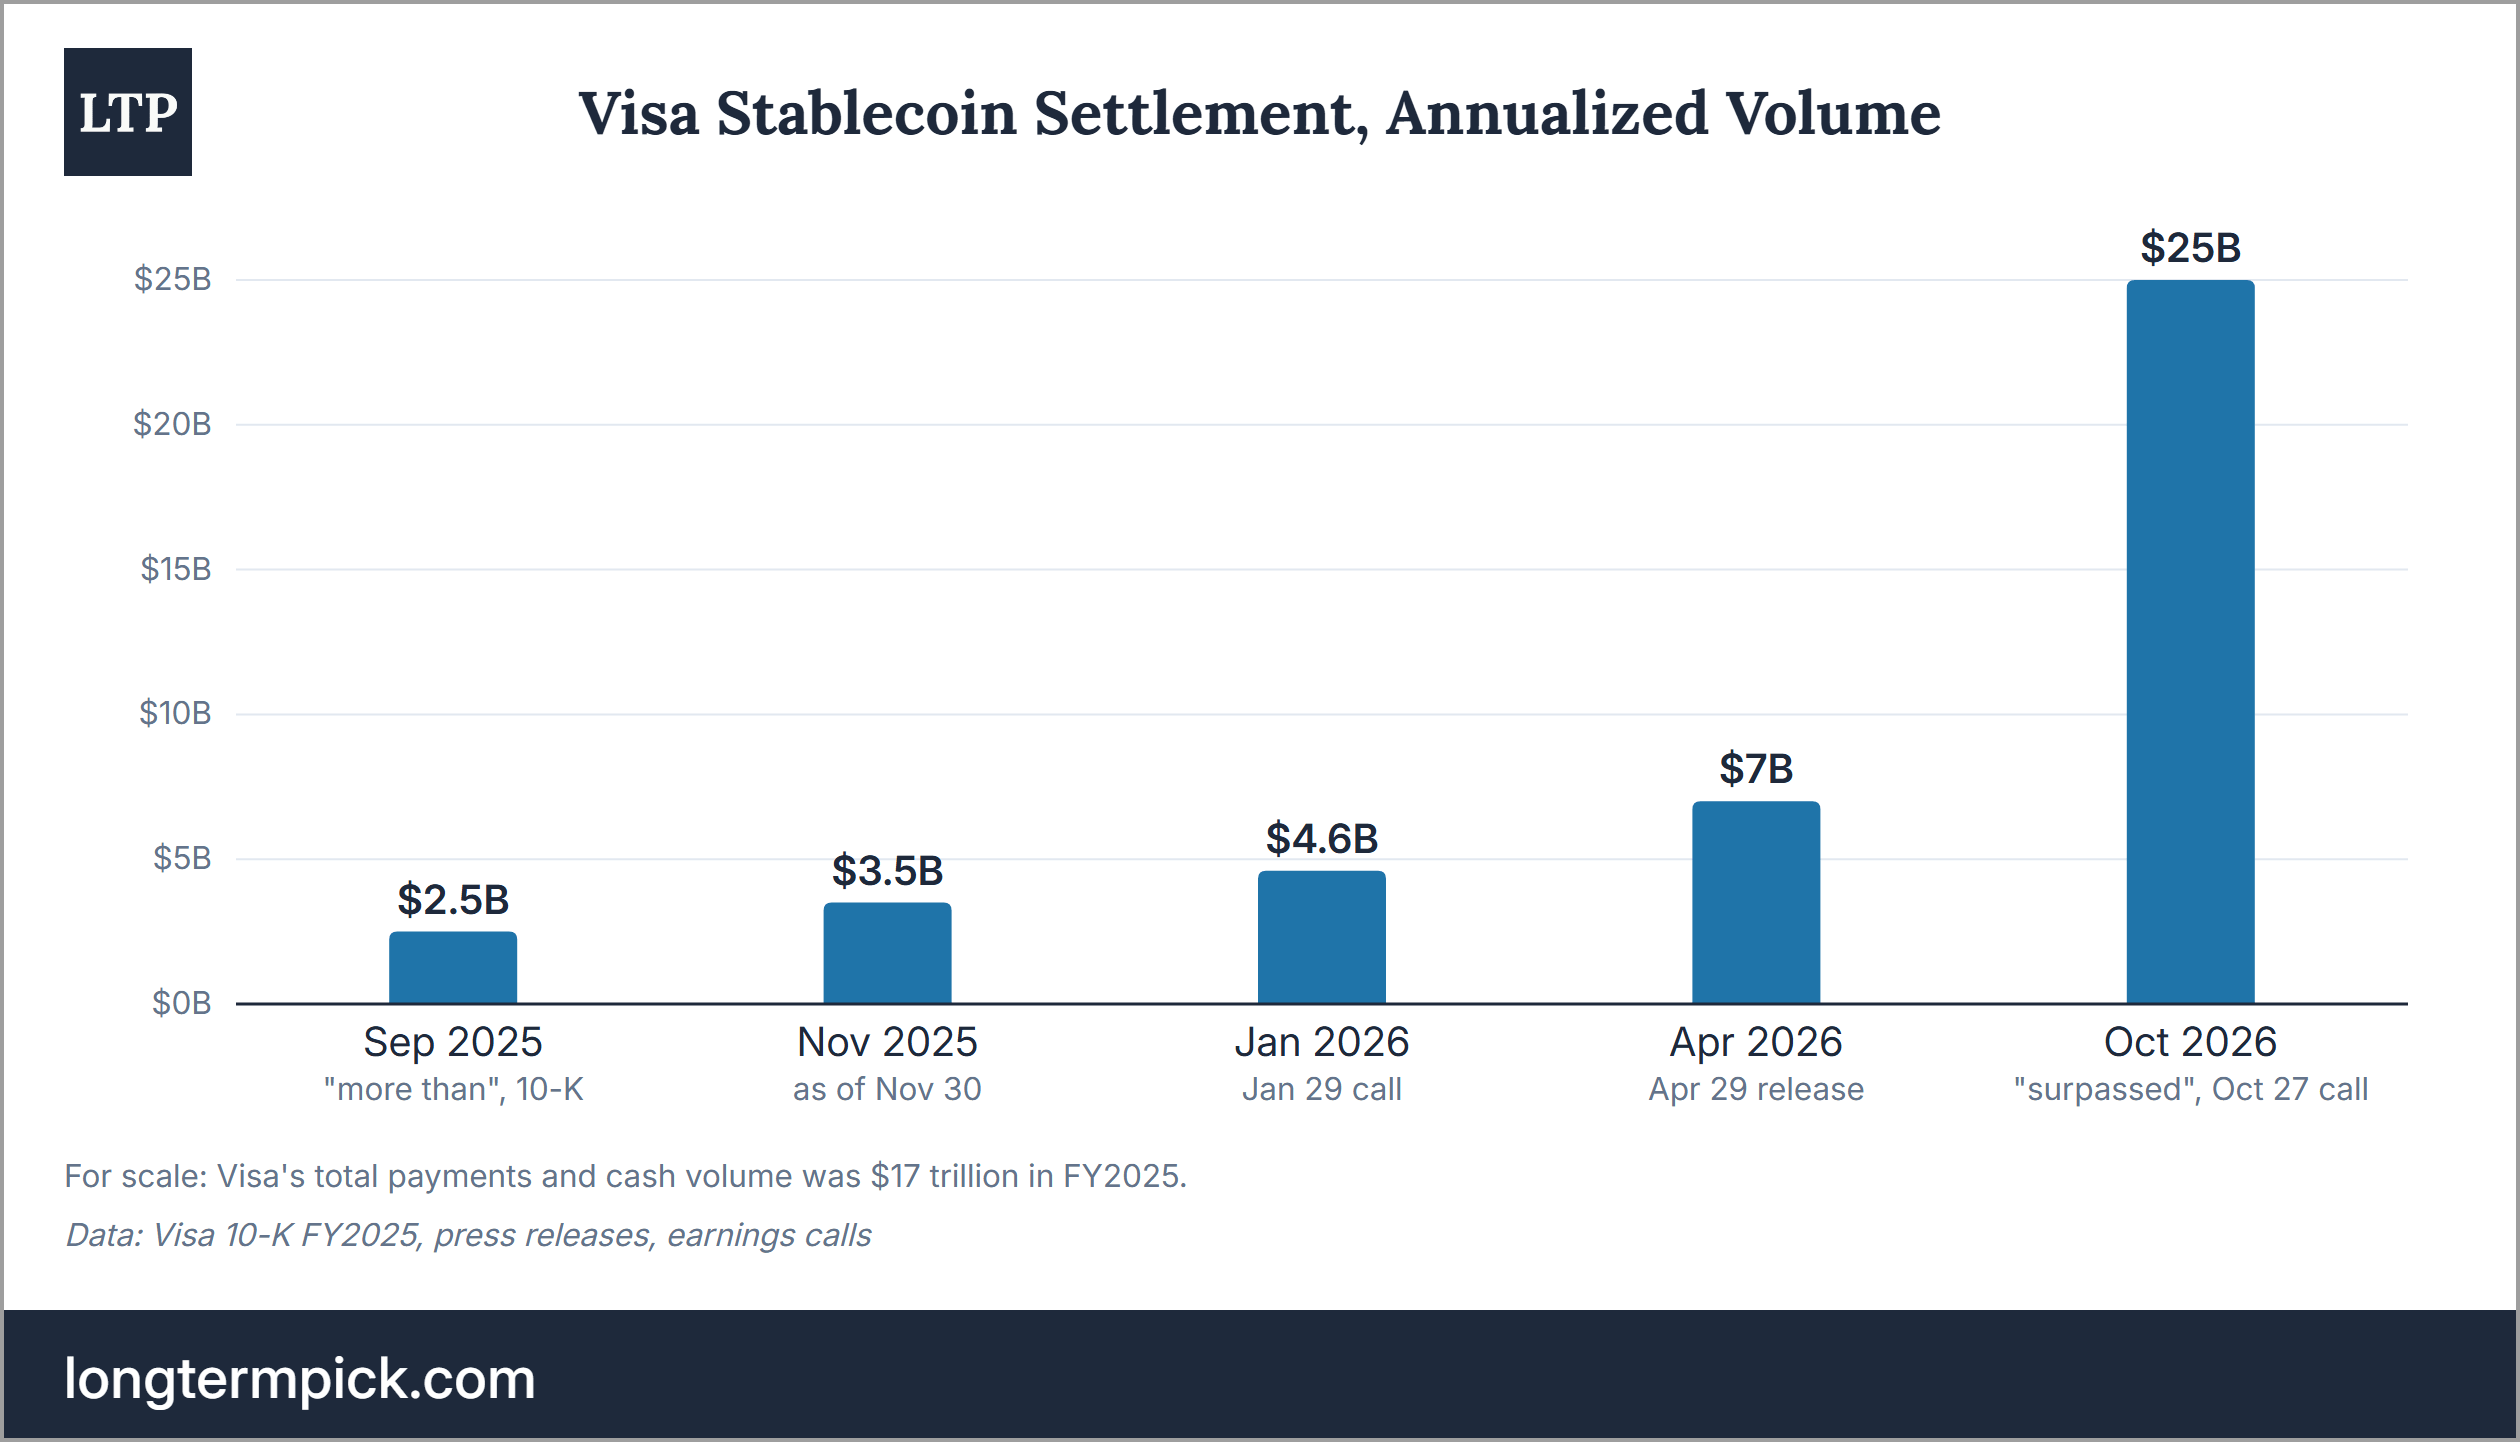
Stablecoins: join the new rail instead of fighting it. Visa's stablecoin settlement reached $25B of annualized volume, up 10x YoY, and there are more than 225 stablecoin-linked card programs. McInerney's answer to the stablecoin threat is that Visa is "stablecoin-agnostic" and "blockchain-agnostic". In my view, $25B is still tiny next to $17 trillion of volume, but it shows that Visa wants to be the network on top of new money, not only cards.
Agentic commerce: a long option, not a 2027 driver. Visa has nearly 50 AI partners live, with Shopify's Shop Pay among the recent ones, and expects the number to double. At the same time, in FY2027 it "all remains very small in the big scheme of the enormous size of our business". I agree, so I do not include anything for it in my model.
Capital Allocation
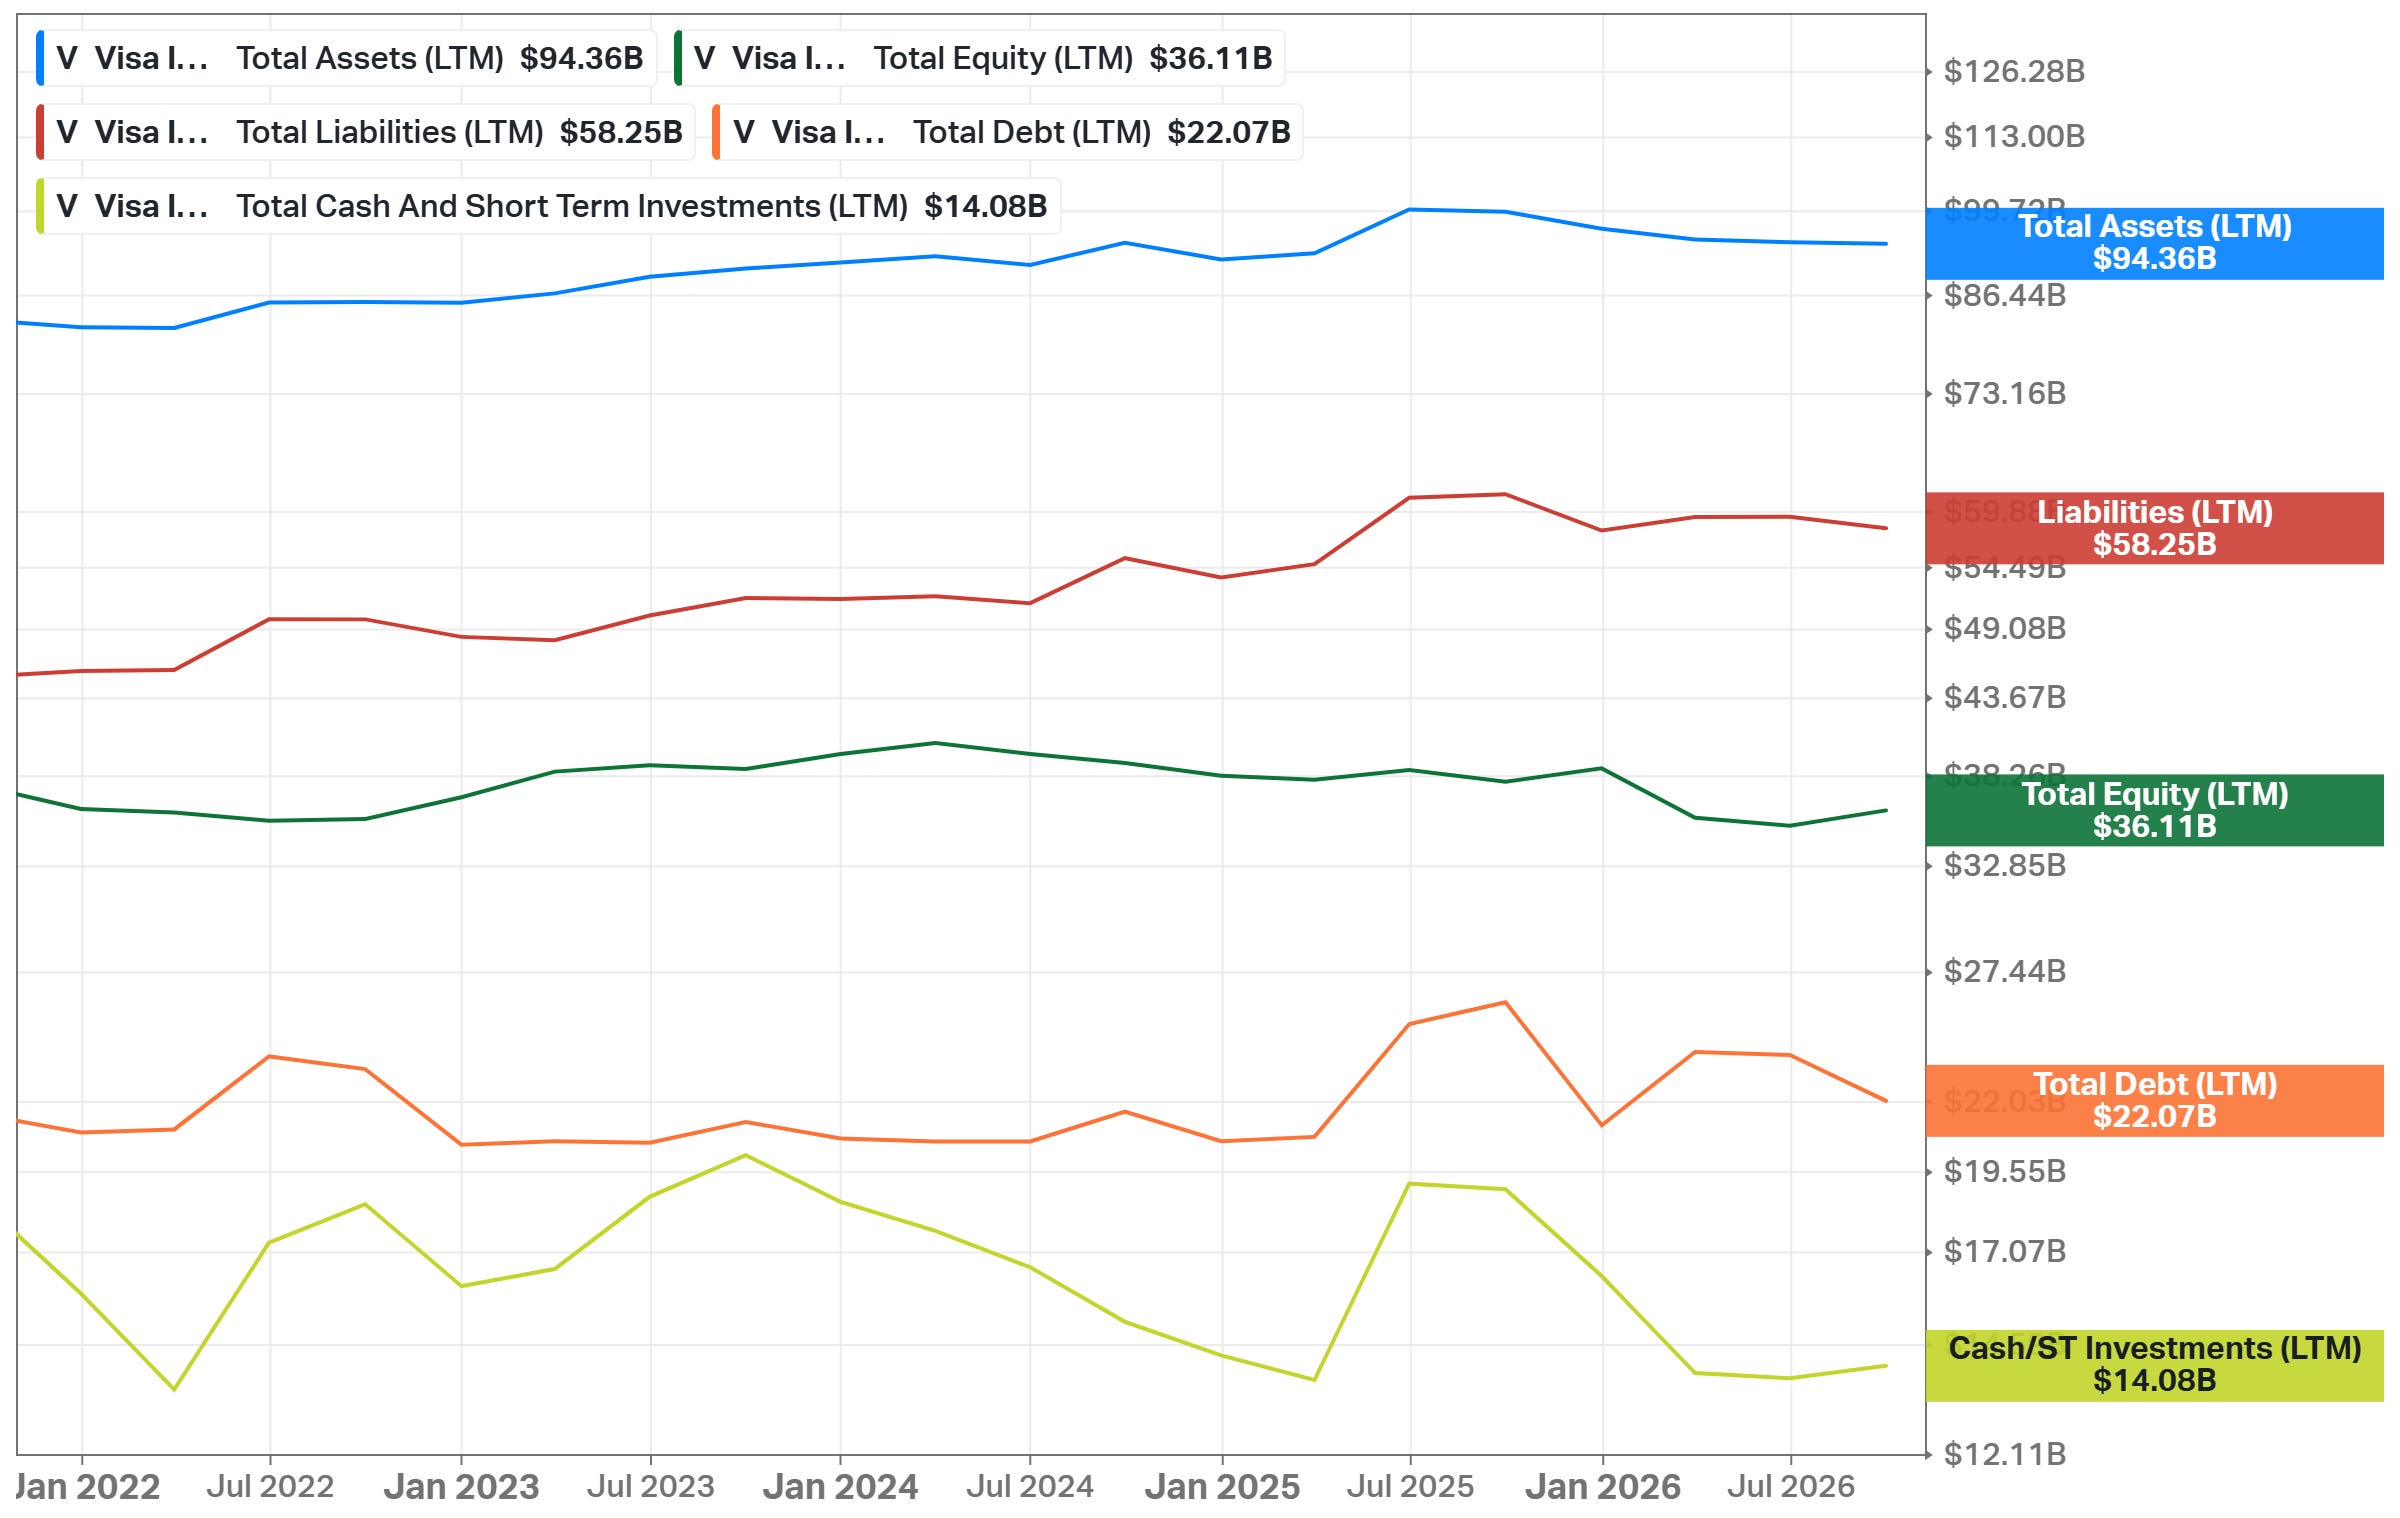
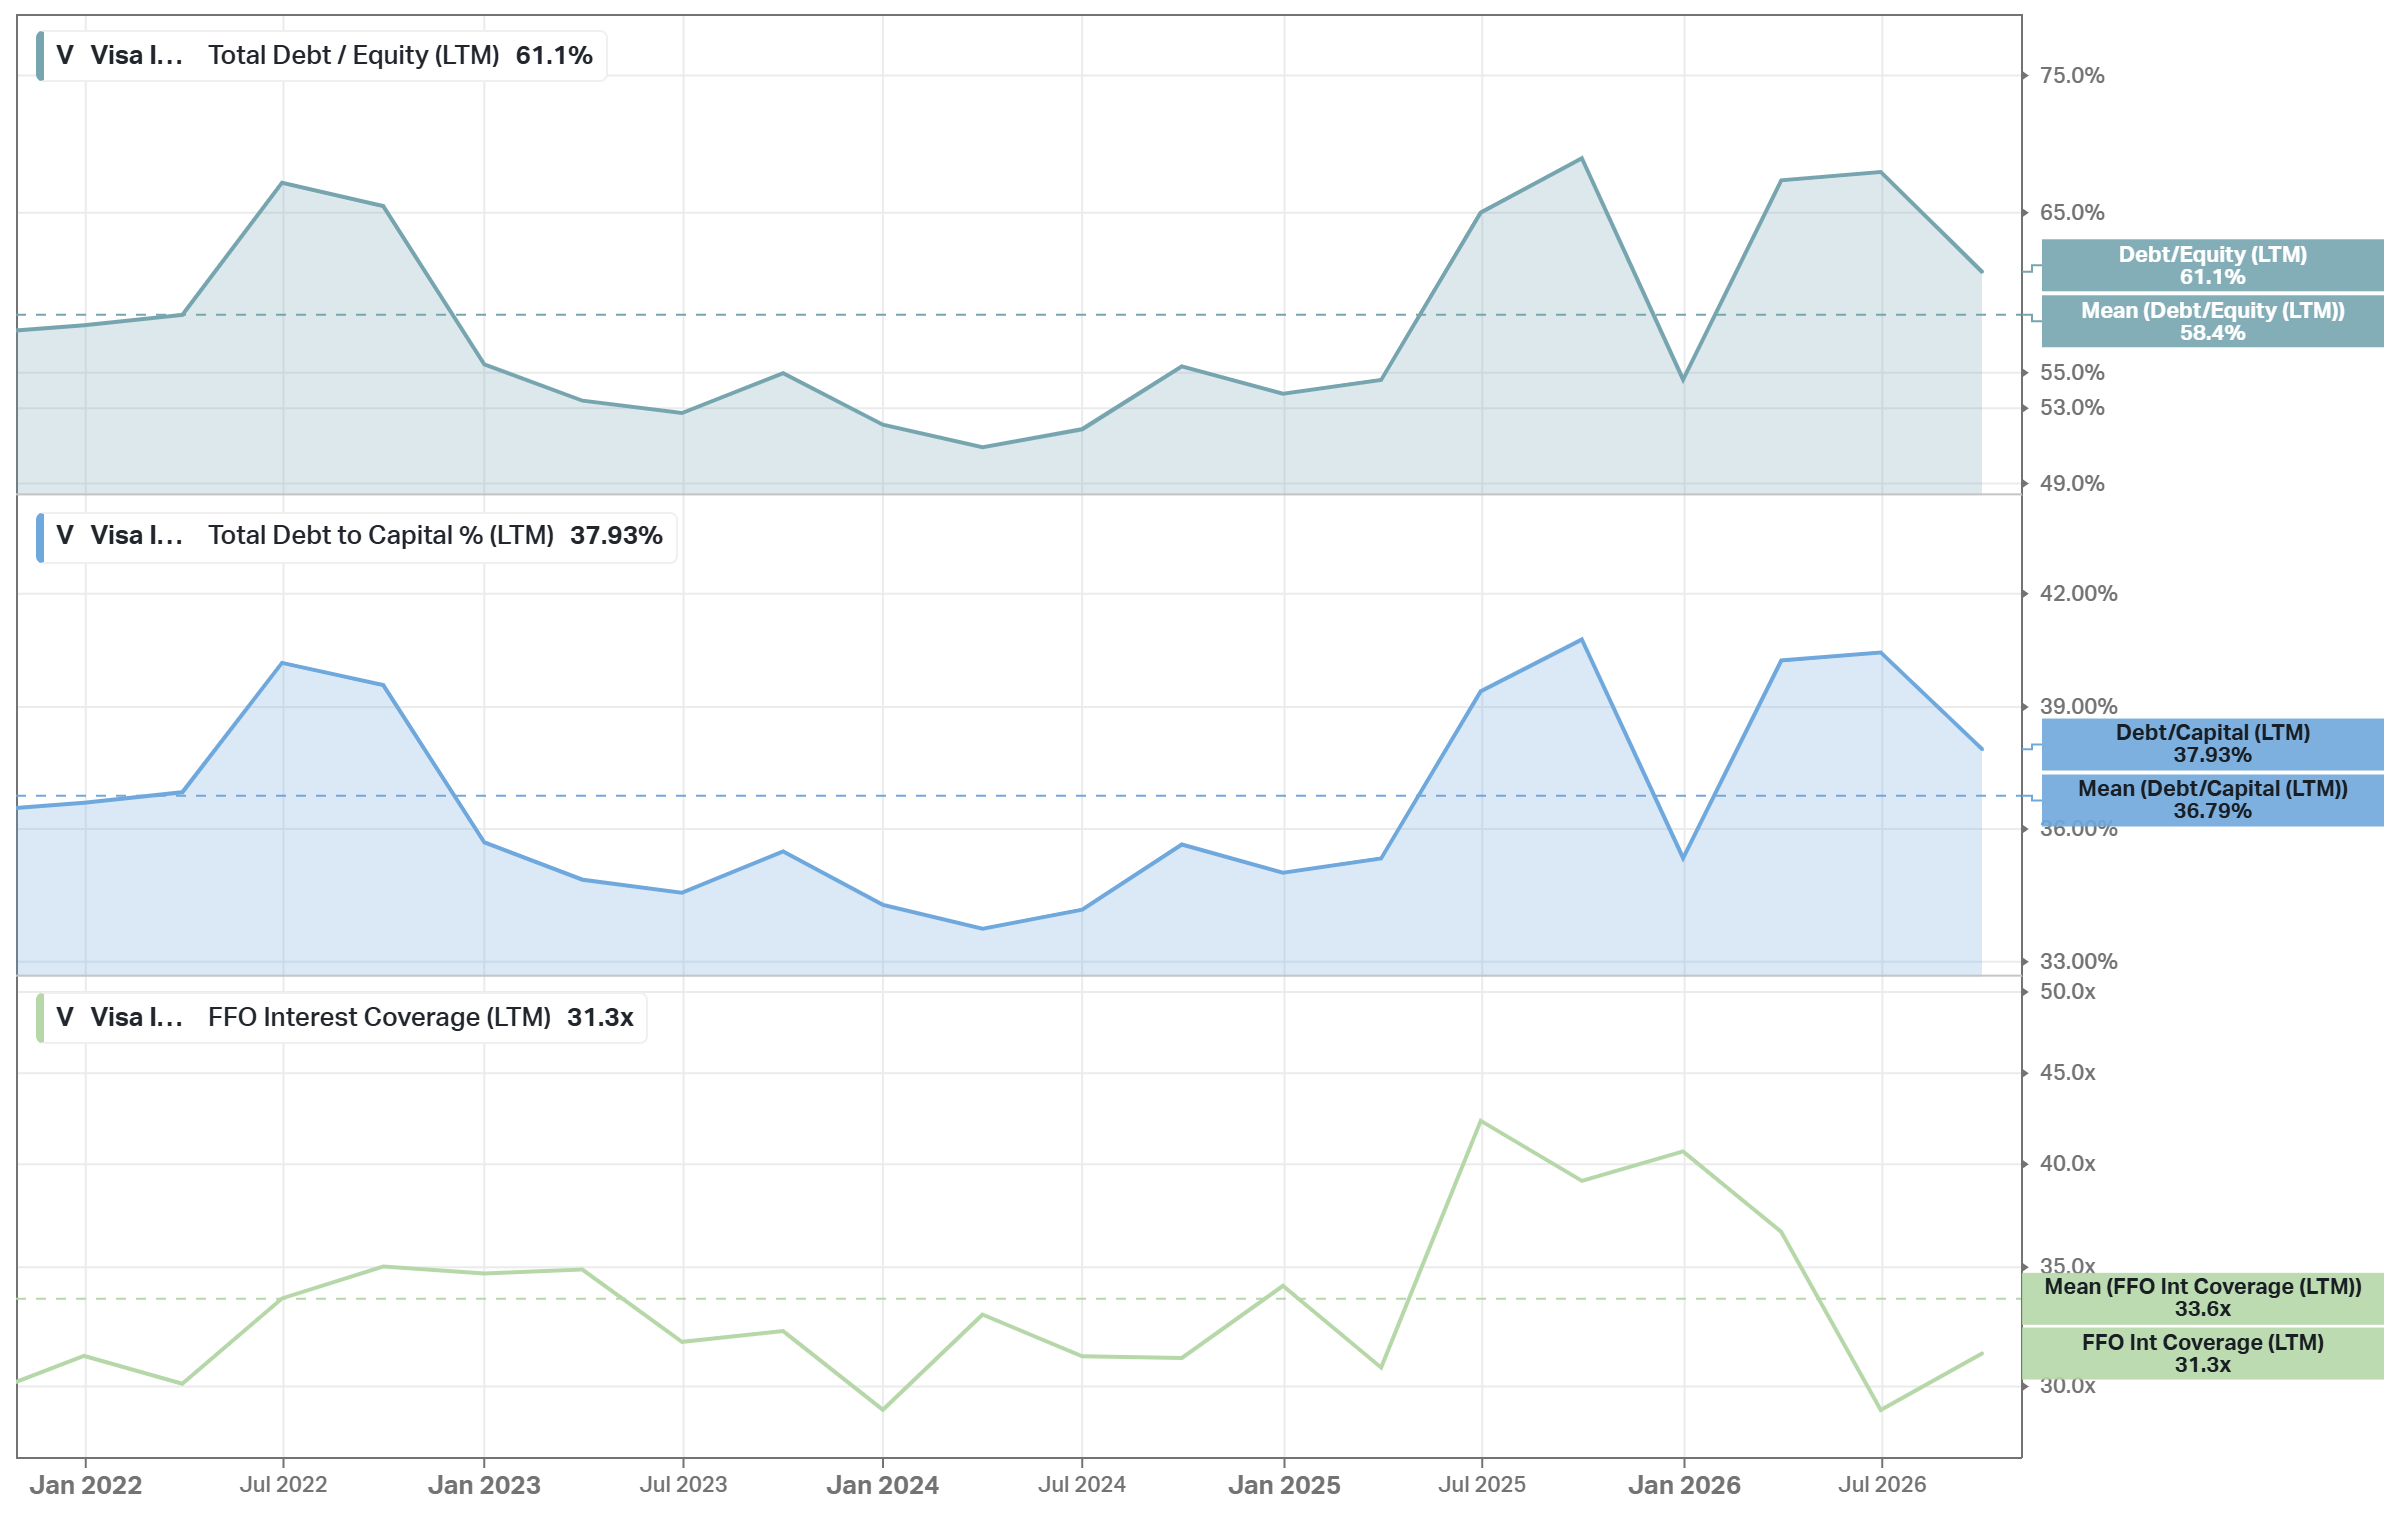
The balance sheet is conservative - net debt is 1% of the market cap. At the end of FY2026, Visa had $14.18B of cash and investment securities and $22.07B of debt, so net debt was $7.89B, ~0.4x of annual FCF. In FY2026, Visa repaid $5.57B of notes and issued $3.0B, a net repayment of $2.57B, and total debt decreased from $25.17B to $22.07B. Debt/Equity is 61.1% (5Y mean: 58.4%), Debt/Capital is 37.93% (36.79%), and funds from operations (FFO) cover interest expense 31.3x (33.6x). Both debt ratios are slightly above their means because equity decreases with the buybacks, not because Visa borrows more.
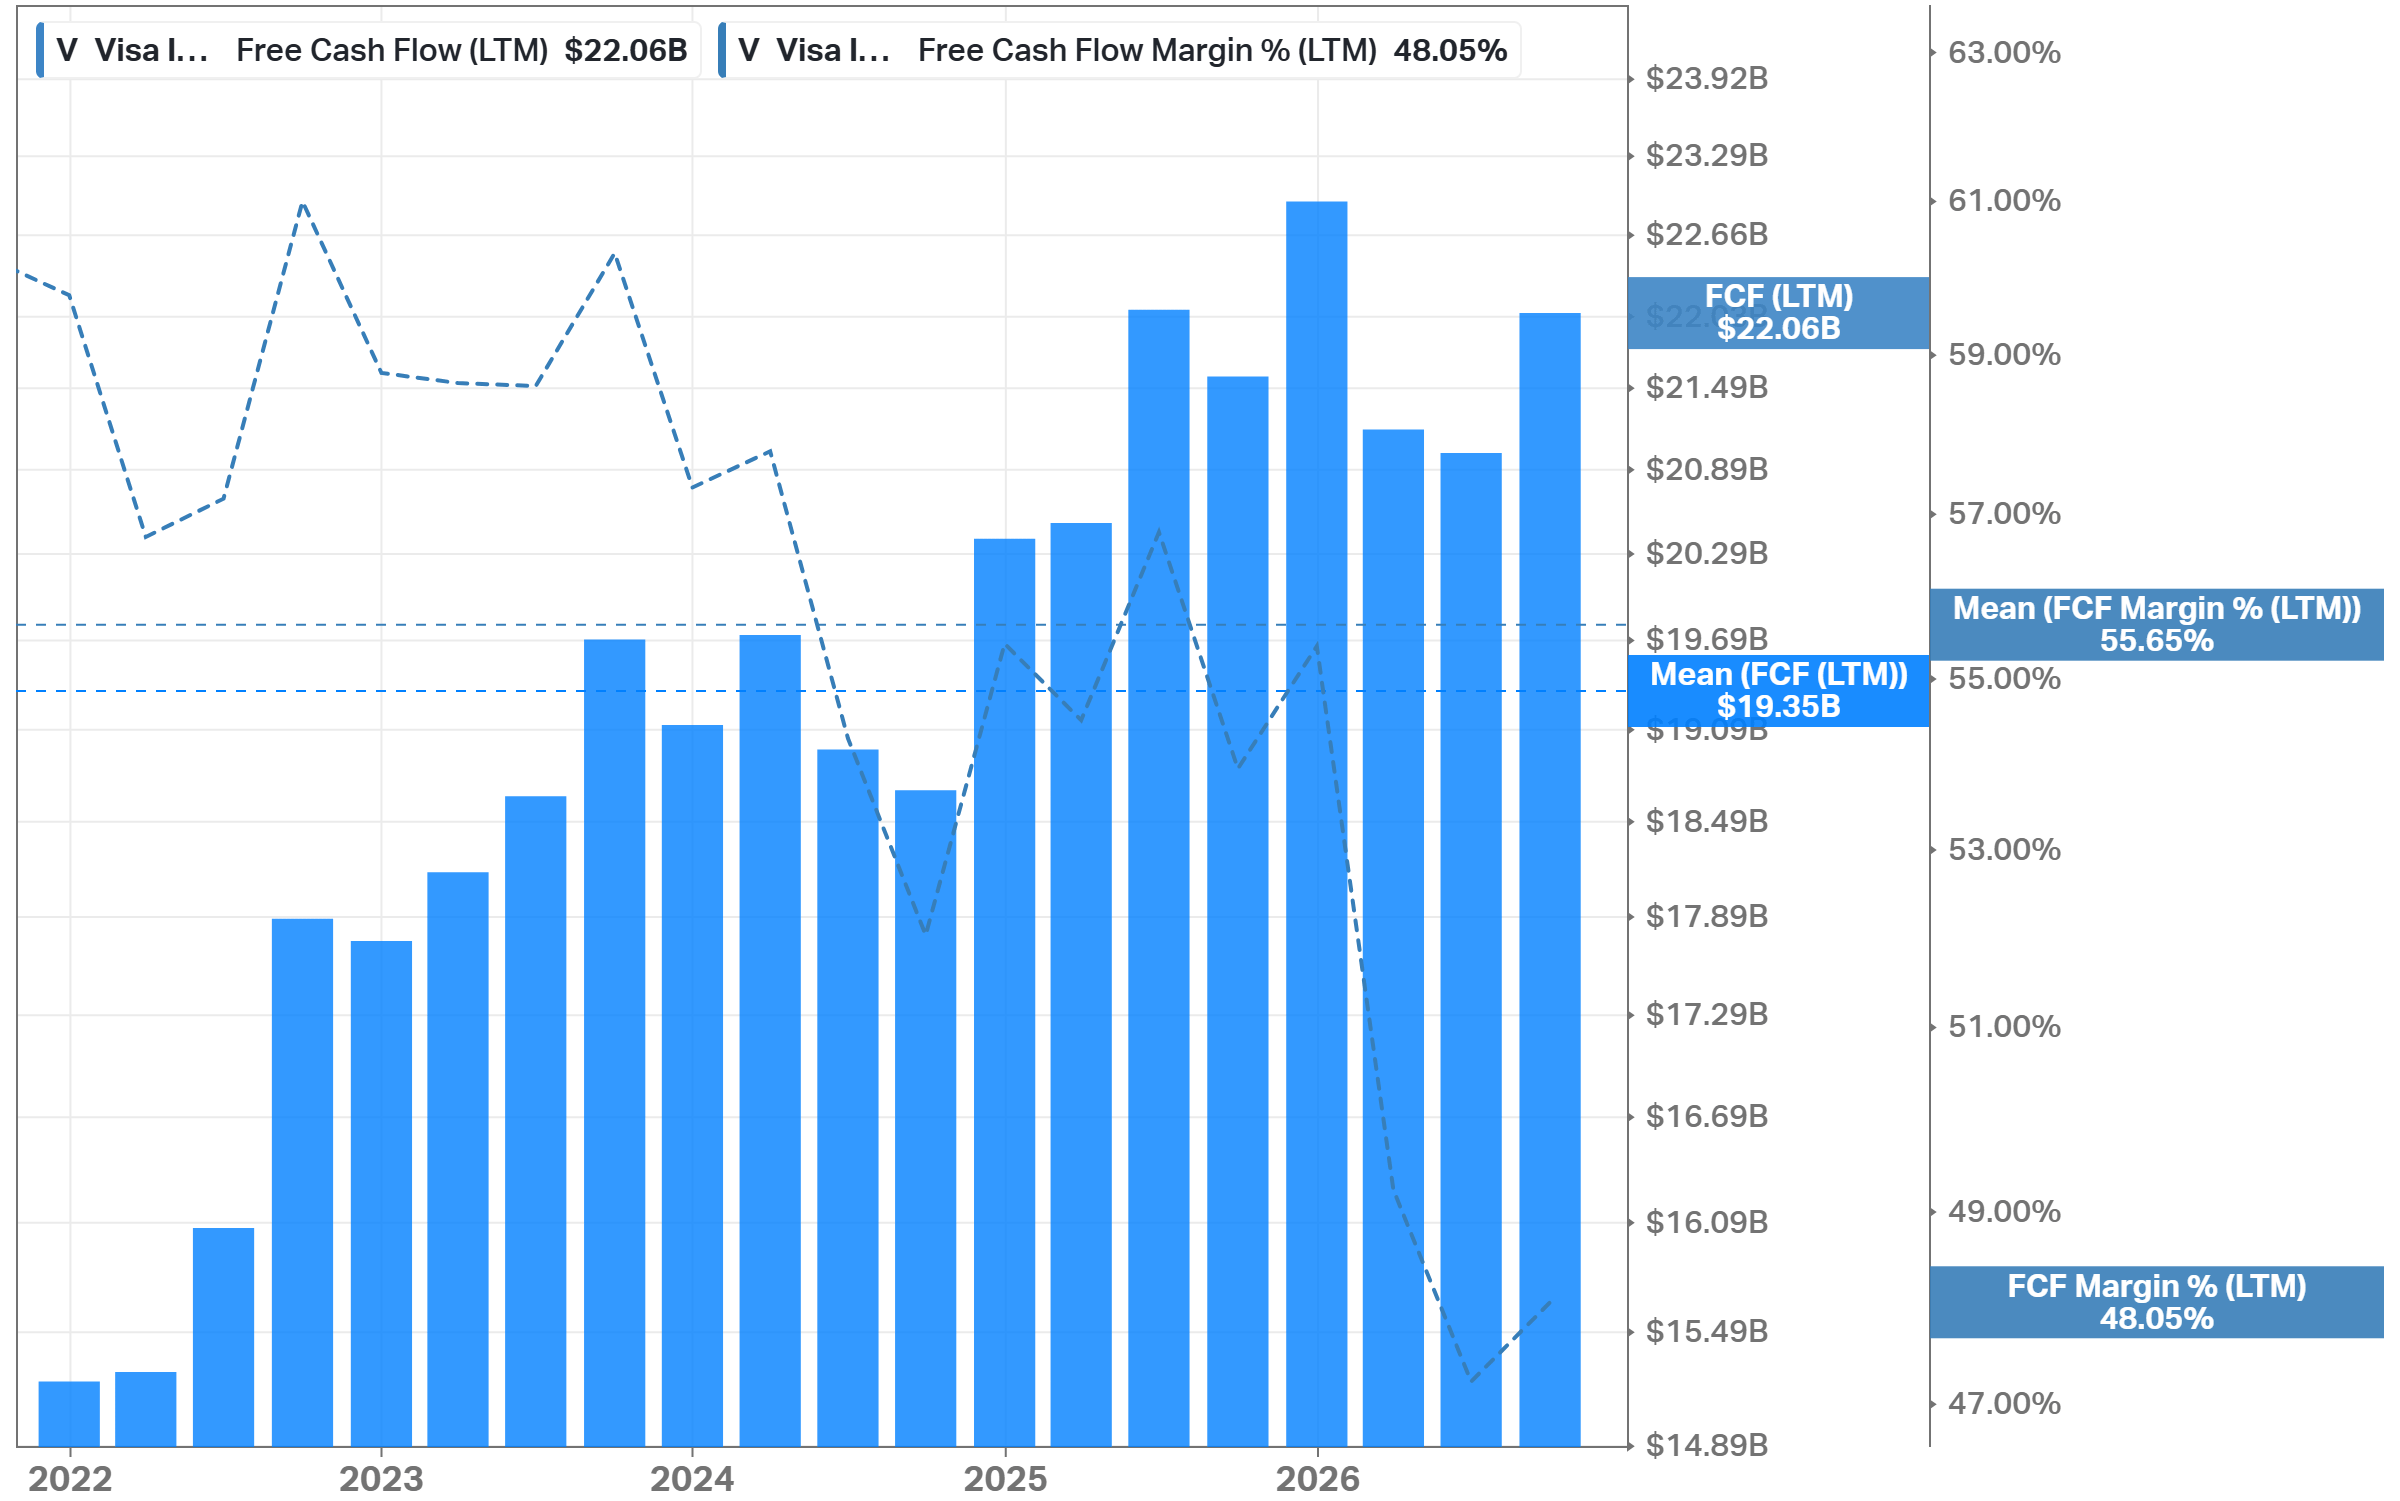
FCF grew only 2%, and the main reason is litigation, not the business. FCF was $22.06B in FY2026, against $21.58B in FY2025, and the FCF margin decreased to 48.05% against a 55.65% 5Y mean. Most of the difference is the US interchange litigation. These payments go through operating cash flow. By my estimate (litigation provision minus the change in accrued litigation), Visa paid ~$3.8B in FY2026, ~$3.6B of it from the litigation escrow account to the merchants that settled. In FY2025, it paid $1.28B, according to the 10-K, and the same method gives $1.26B. Before these payments, FCF grew ~13%, close to the growth of non-GAAP net income (+12%). Litigation is not a one-off, though - Visa also paid $594M in FY2024.
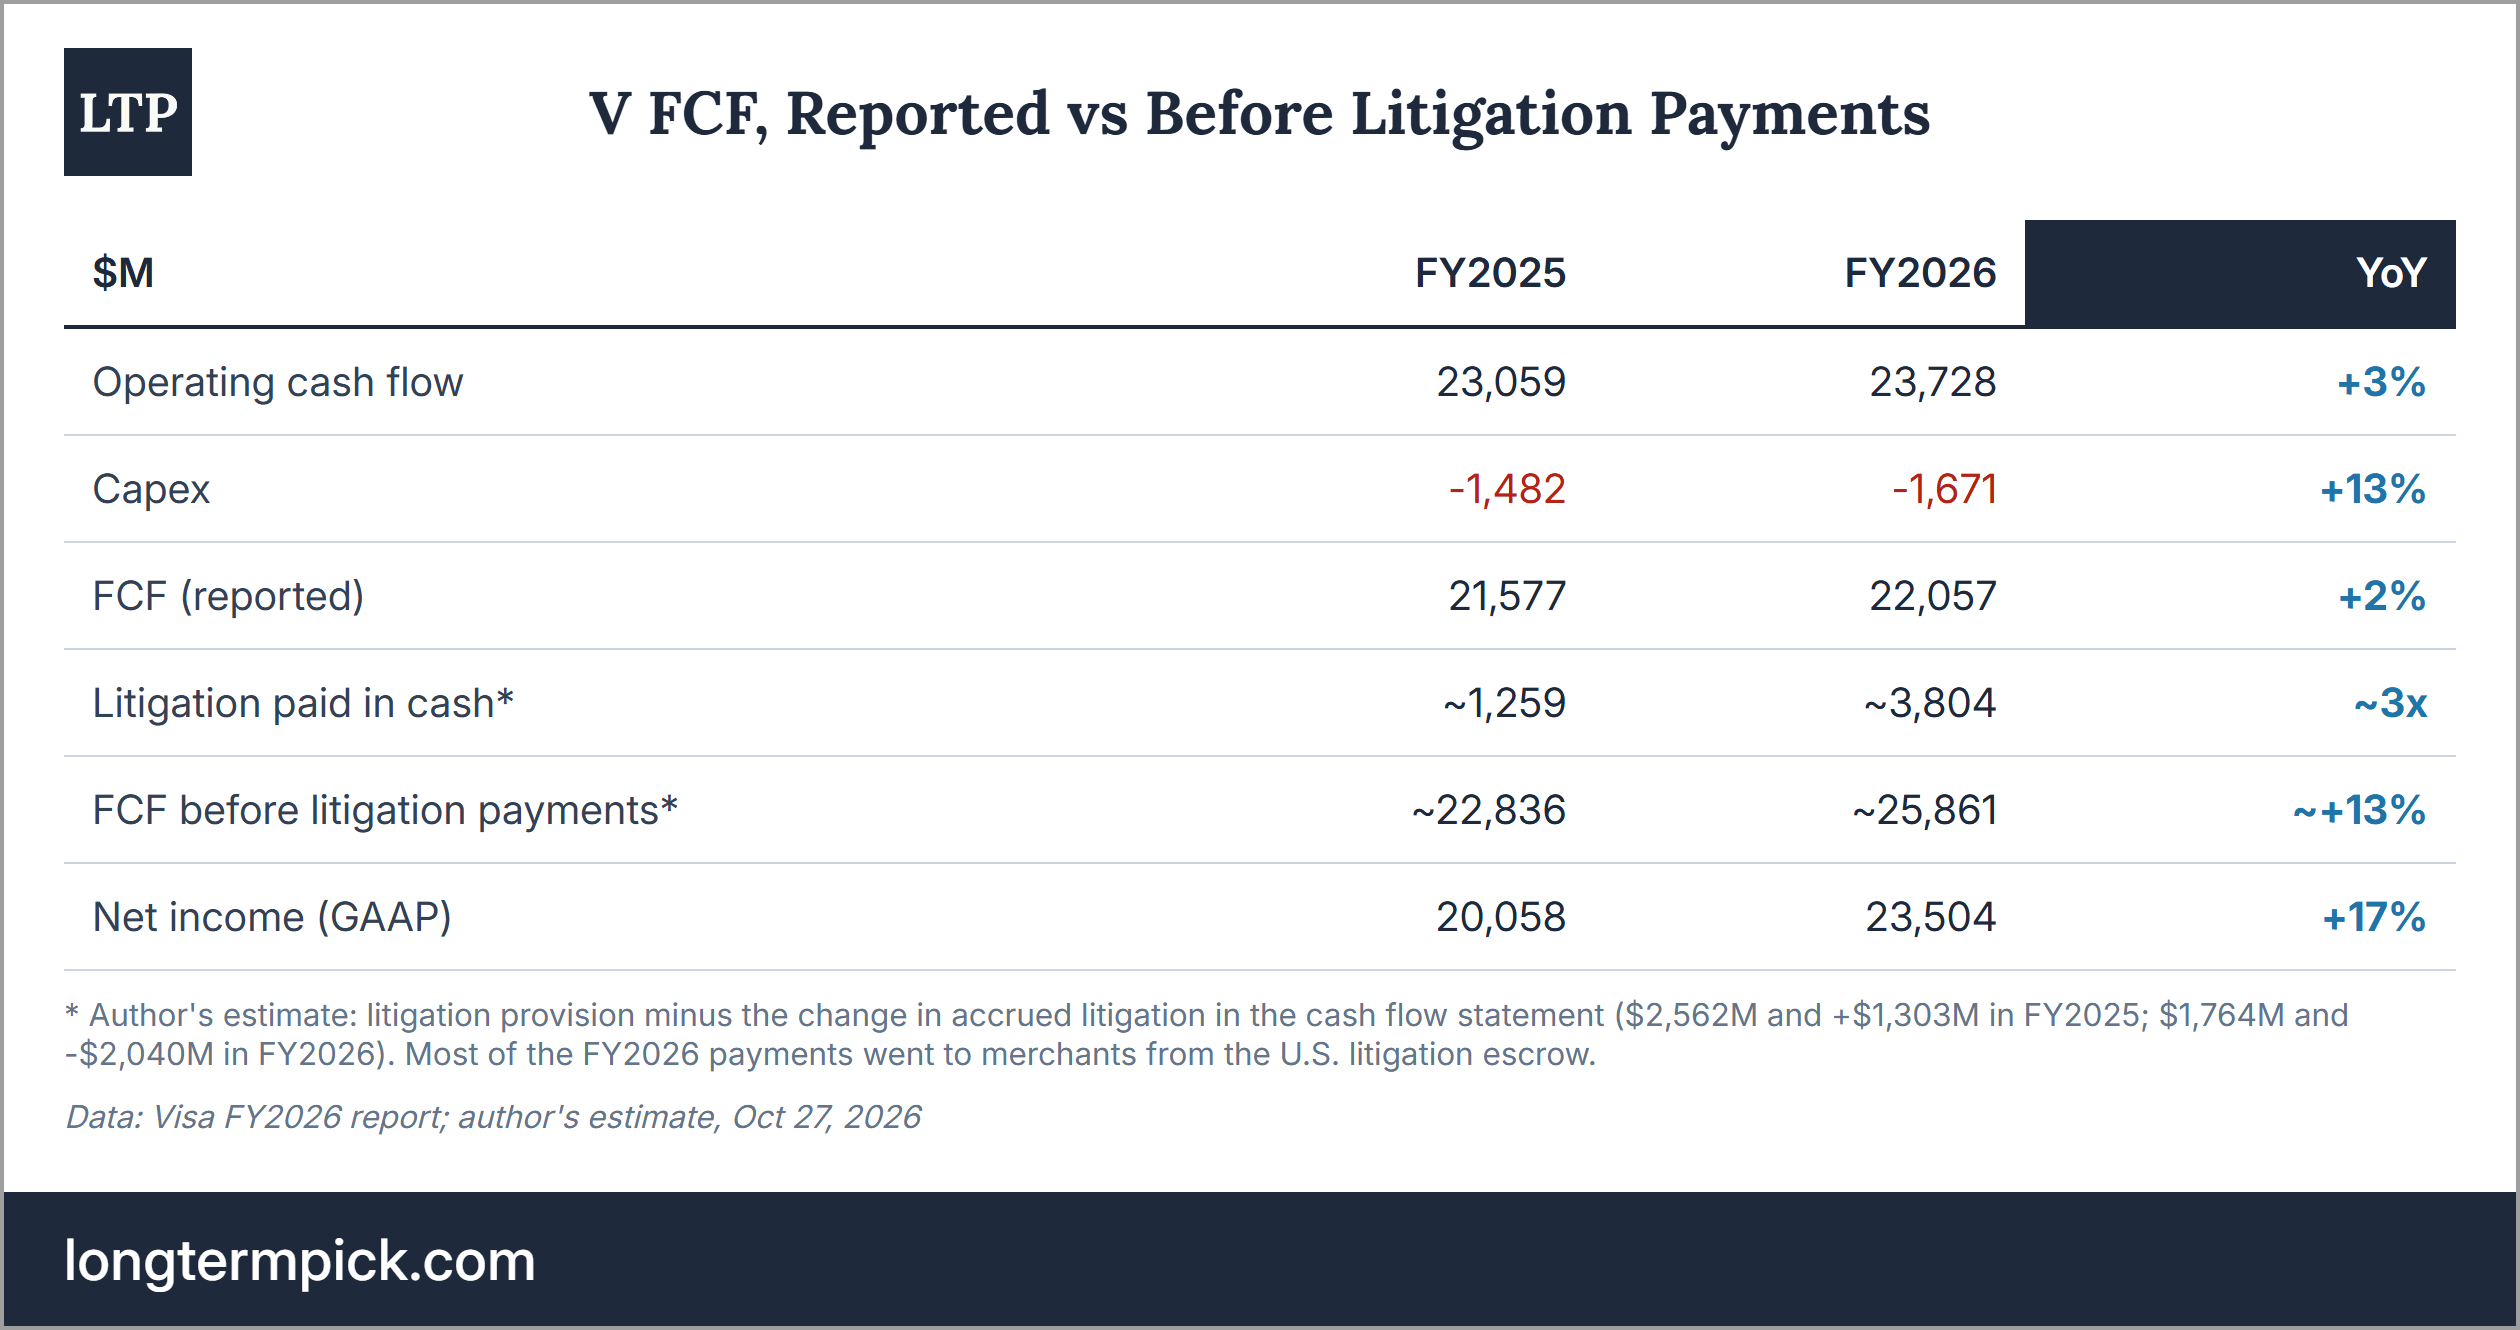
Worth noting that class A shareholders do not pay most of this cost. The old US interchange case is paid from a litigation escrow account. Visa funds this account with its own cash, but each deposit reduces the number of class A shares that the class B shares (owned by Visa member banks and similar holders, as the 10-K defines them) will convert into. For class A shareholders, it is the same as a buyback: the cash leaves Visa, and their share count decreases. In FY2026, Visa deposited $1.28B, the last $405M on September 18, and the ~$3.6B paid to merchants came from this account. In May, Visa exchanged most of the old class B shares for new class B-3 and class C shares, so the class B shares that take this cost are now the B-3. This covers only the old interchange case, including the merchants that opted out of its settlement. The Justice Department's debit lawsuit and the US debit class actions are not covered, so any cost there falls on class A shareholders.
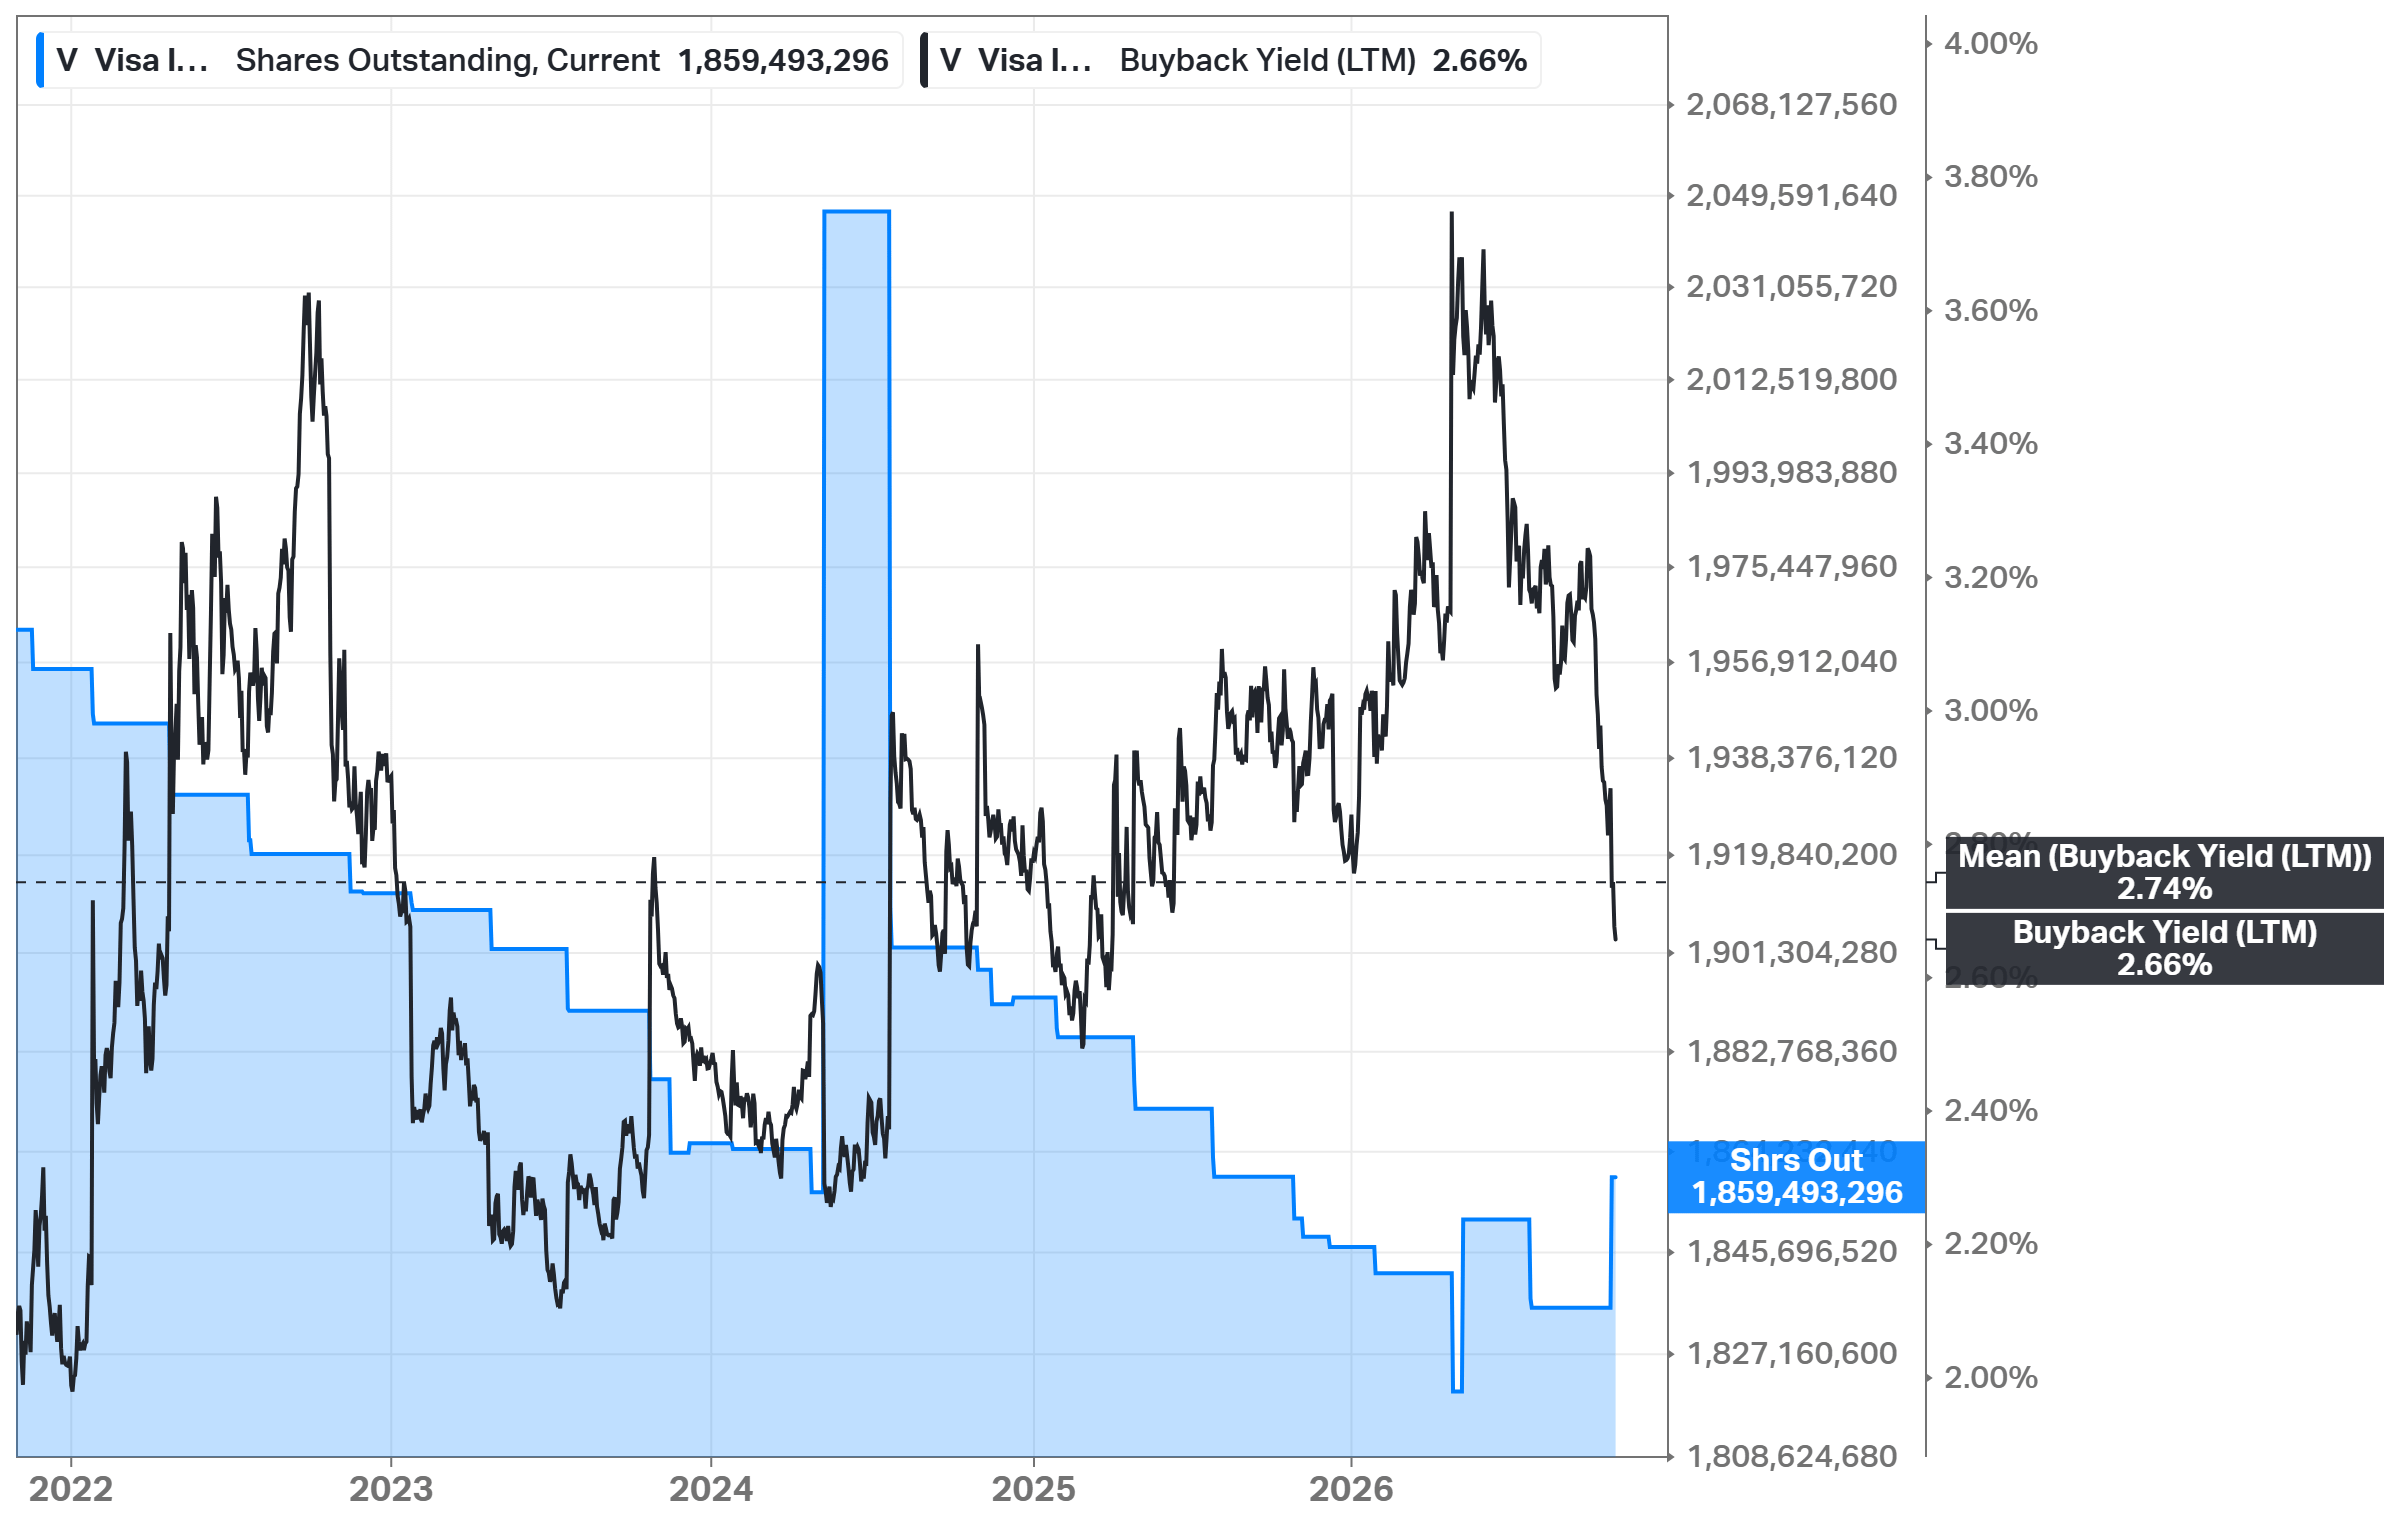
Buybacks are the main use of cash. In FY2026, Visa bought 61M shares for $20.5B at an average of $335, 19% below today's price, and the remaining authorization is $24.4B, or 3.2% of the market cap. The diluted class A share count decreased 3.0% in FY2026 (3.2% in Q4) and 12.8% in 5 years. The LTM buyback yield is 2.66% (5Y mean: 2.74%). Koyfin's share count went up at the end of the chart, but these are Class C shares from the May exchange that convert into Class A when they are sold, not new shares. The diluted count, which includes all classes, decreased.
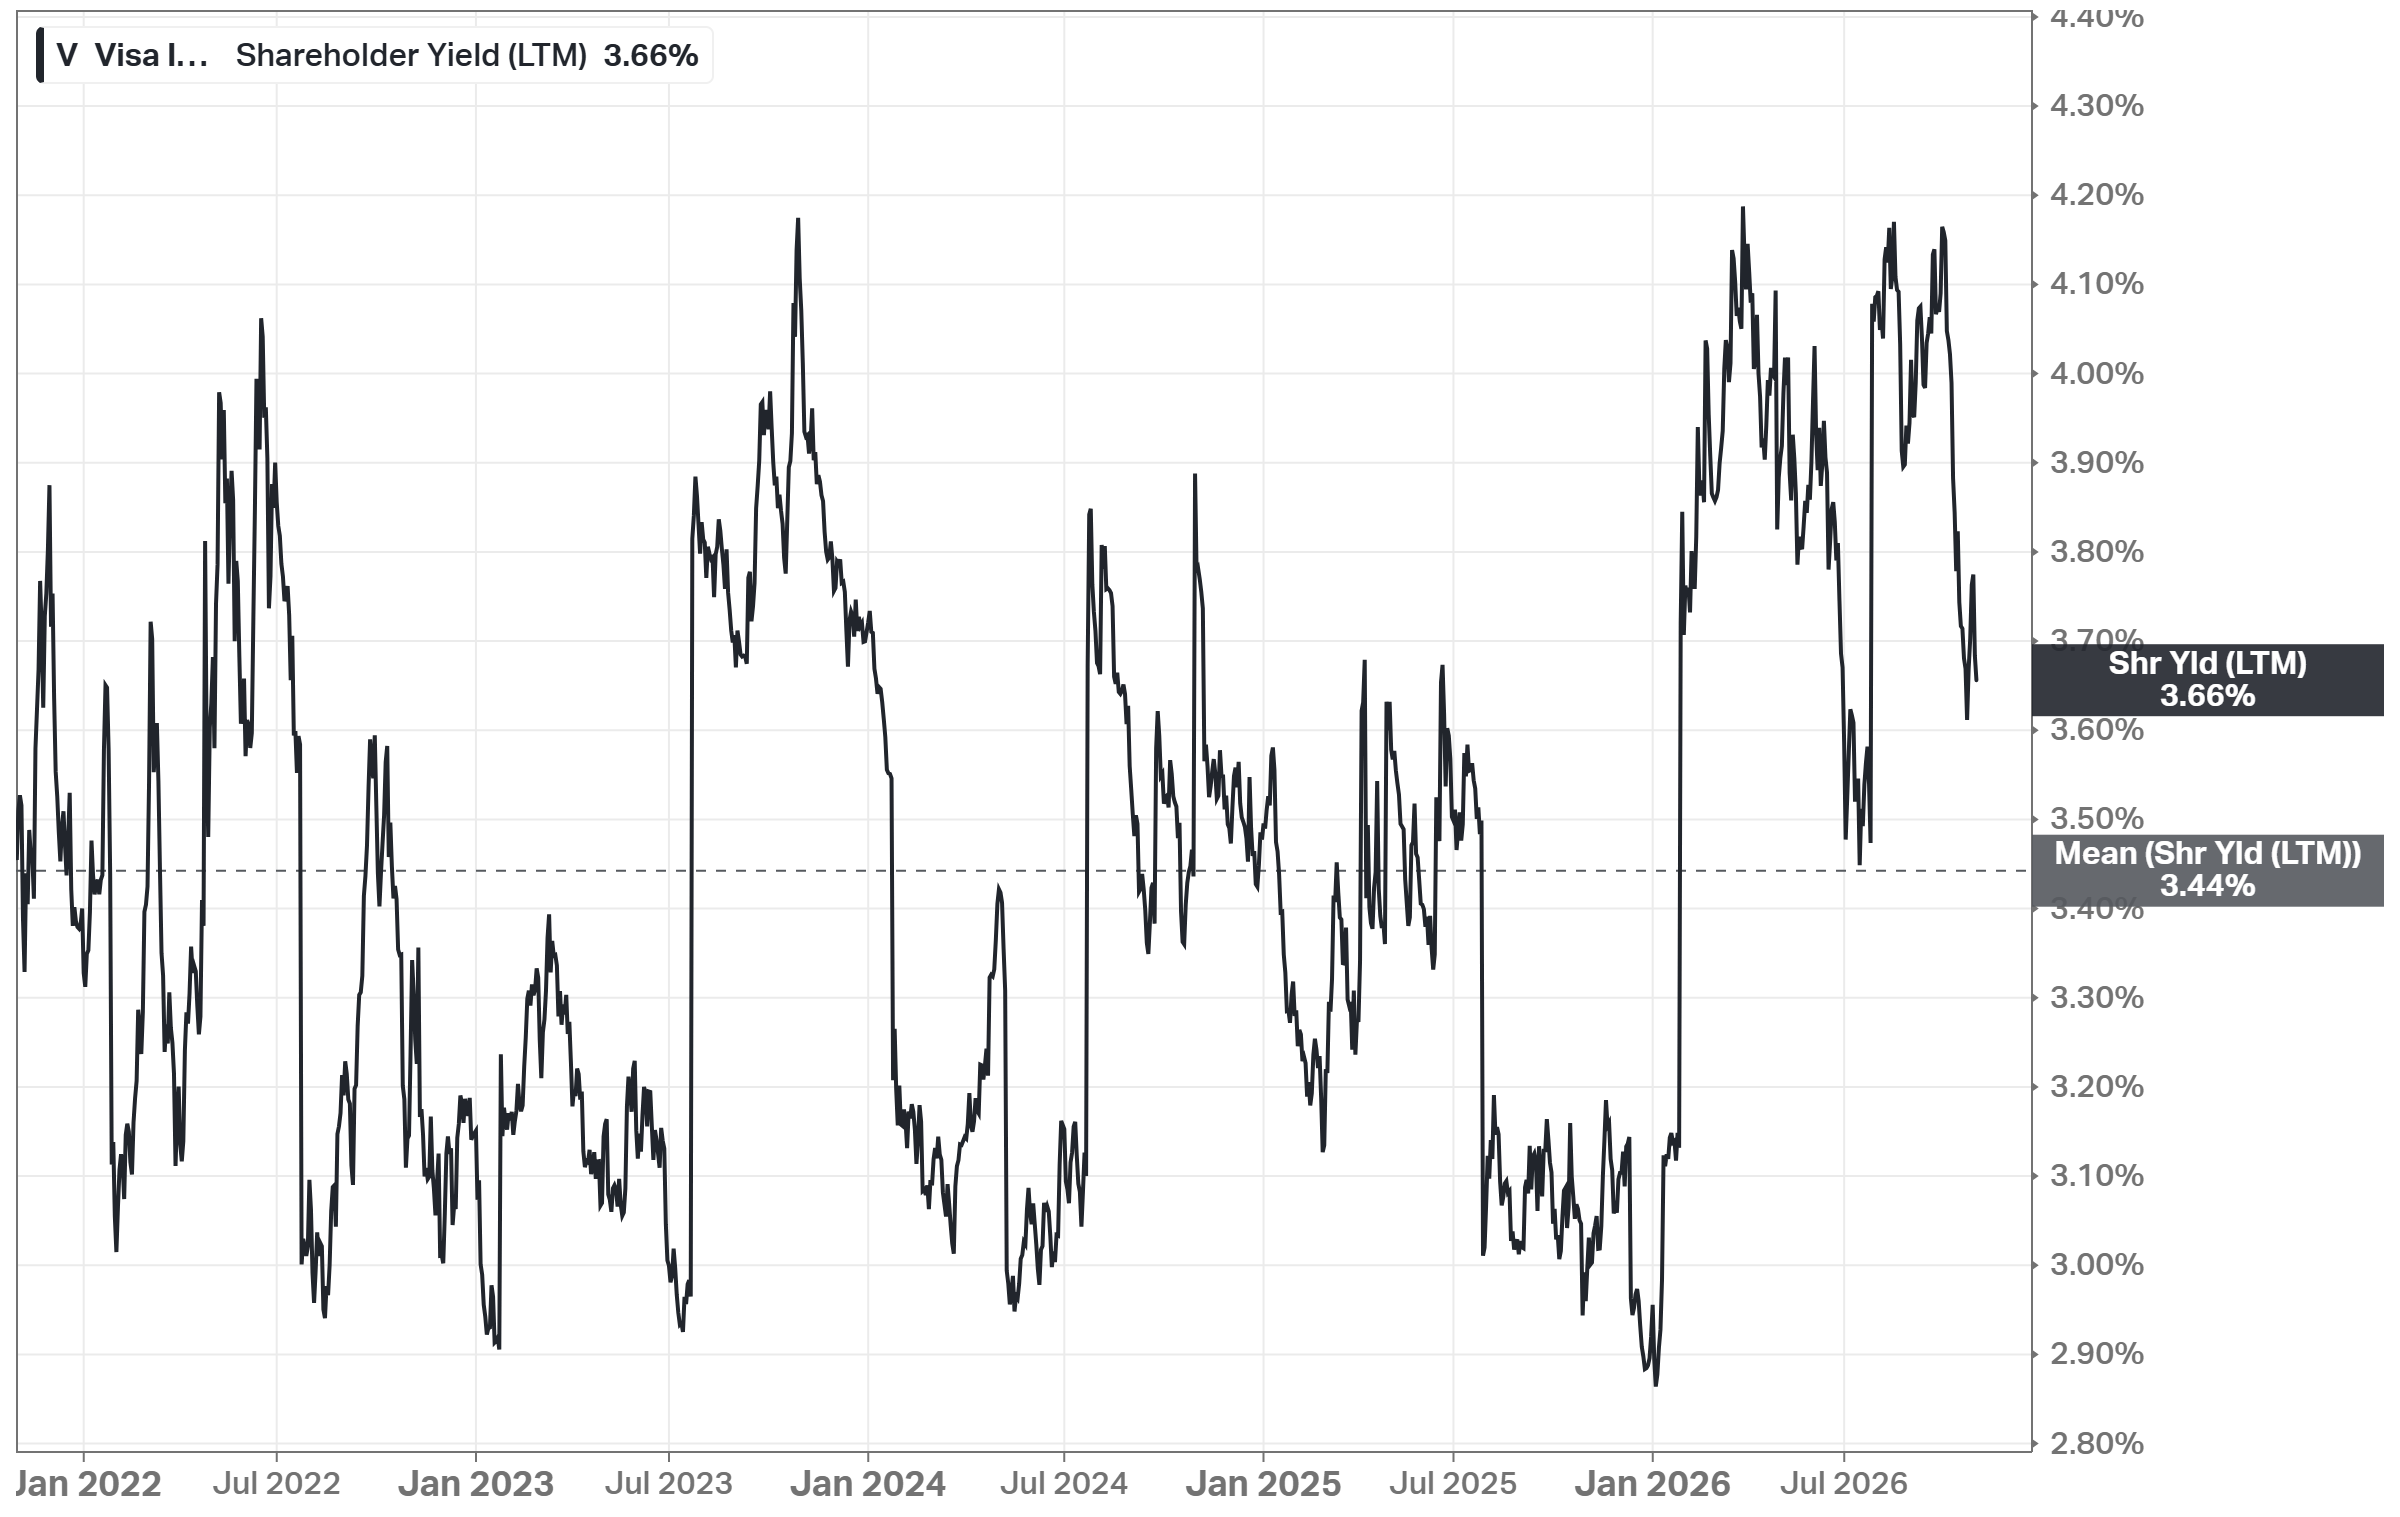
The shareholder yield, which also counts dividends and debt repayment, is 3.66% (5Y mean: 3.44%).
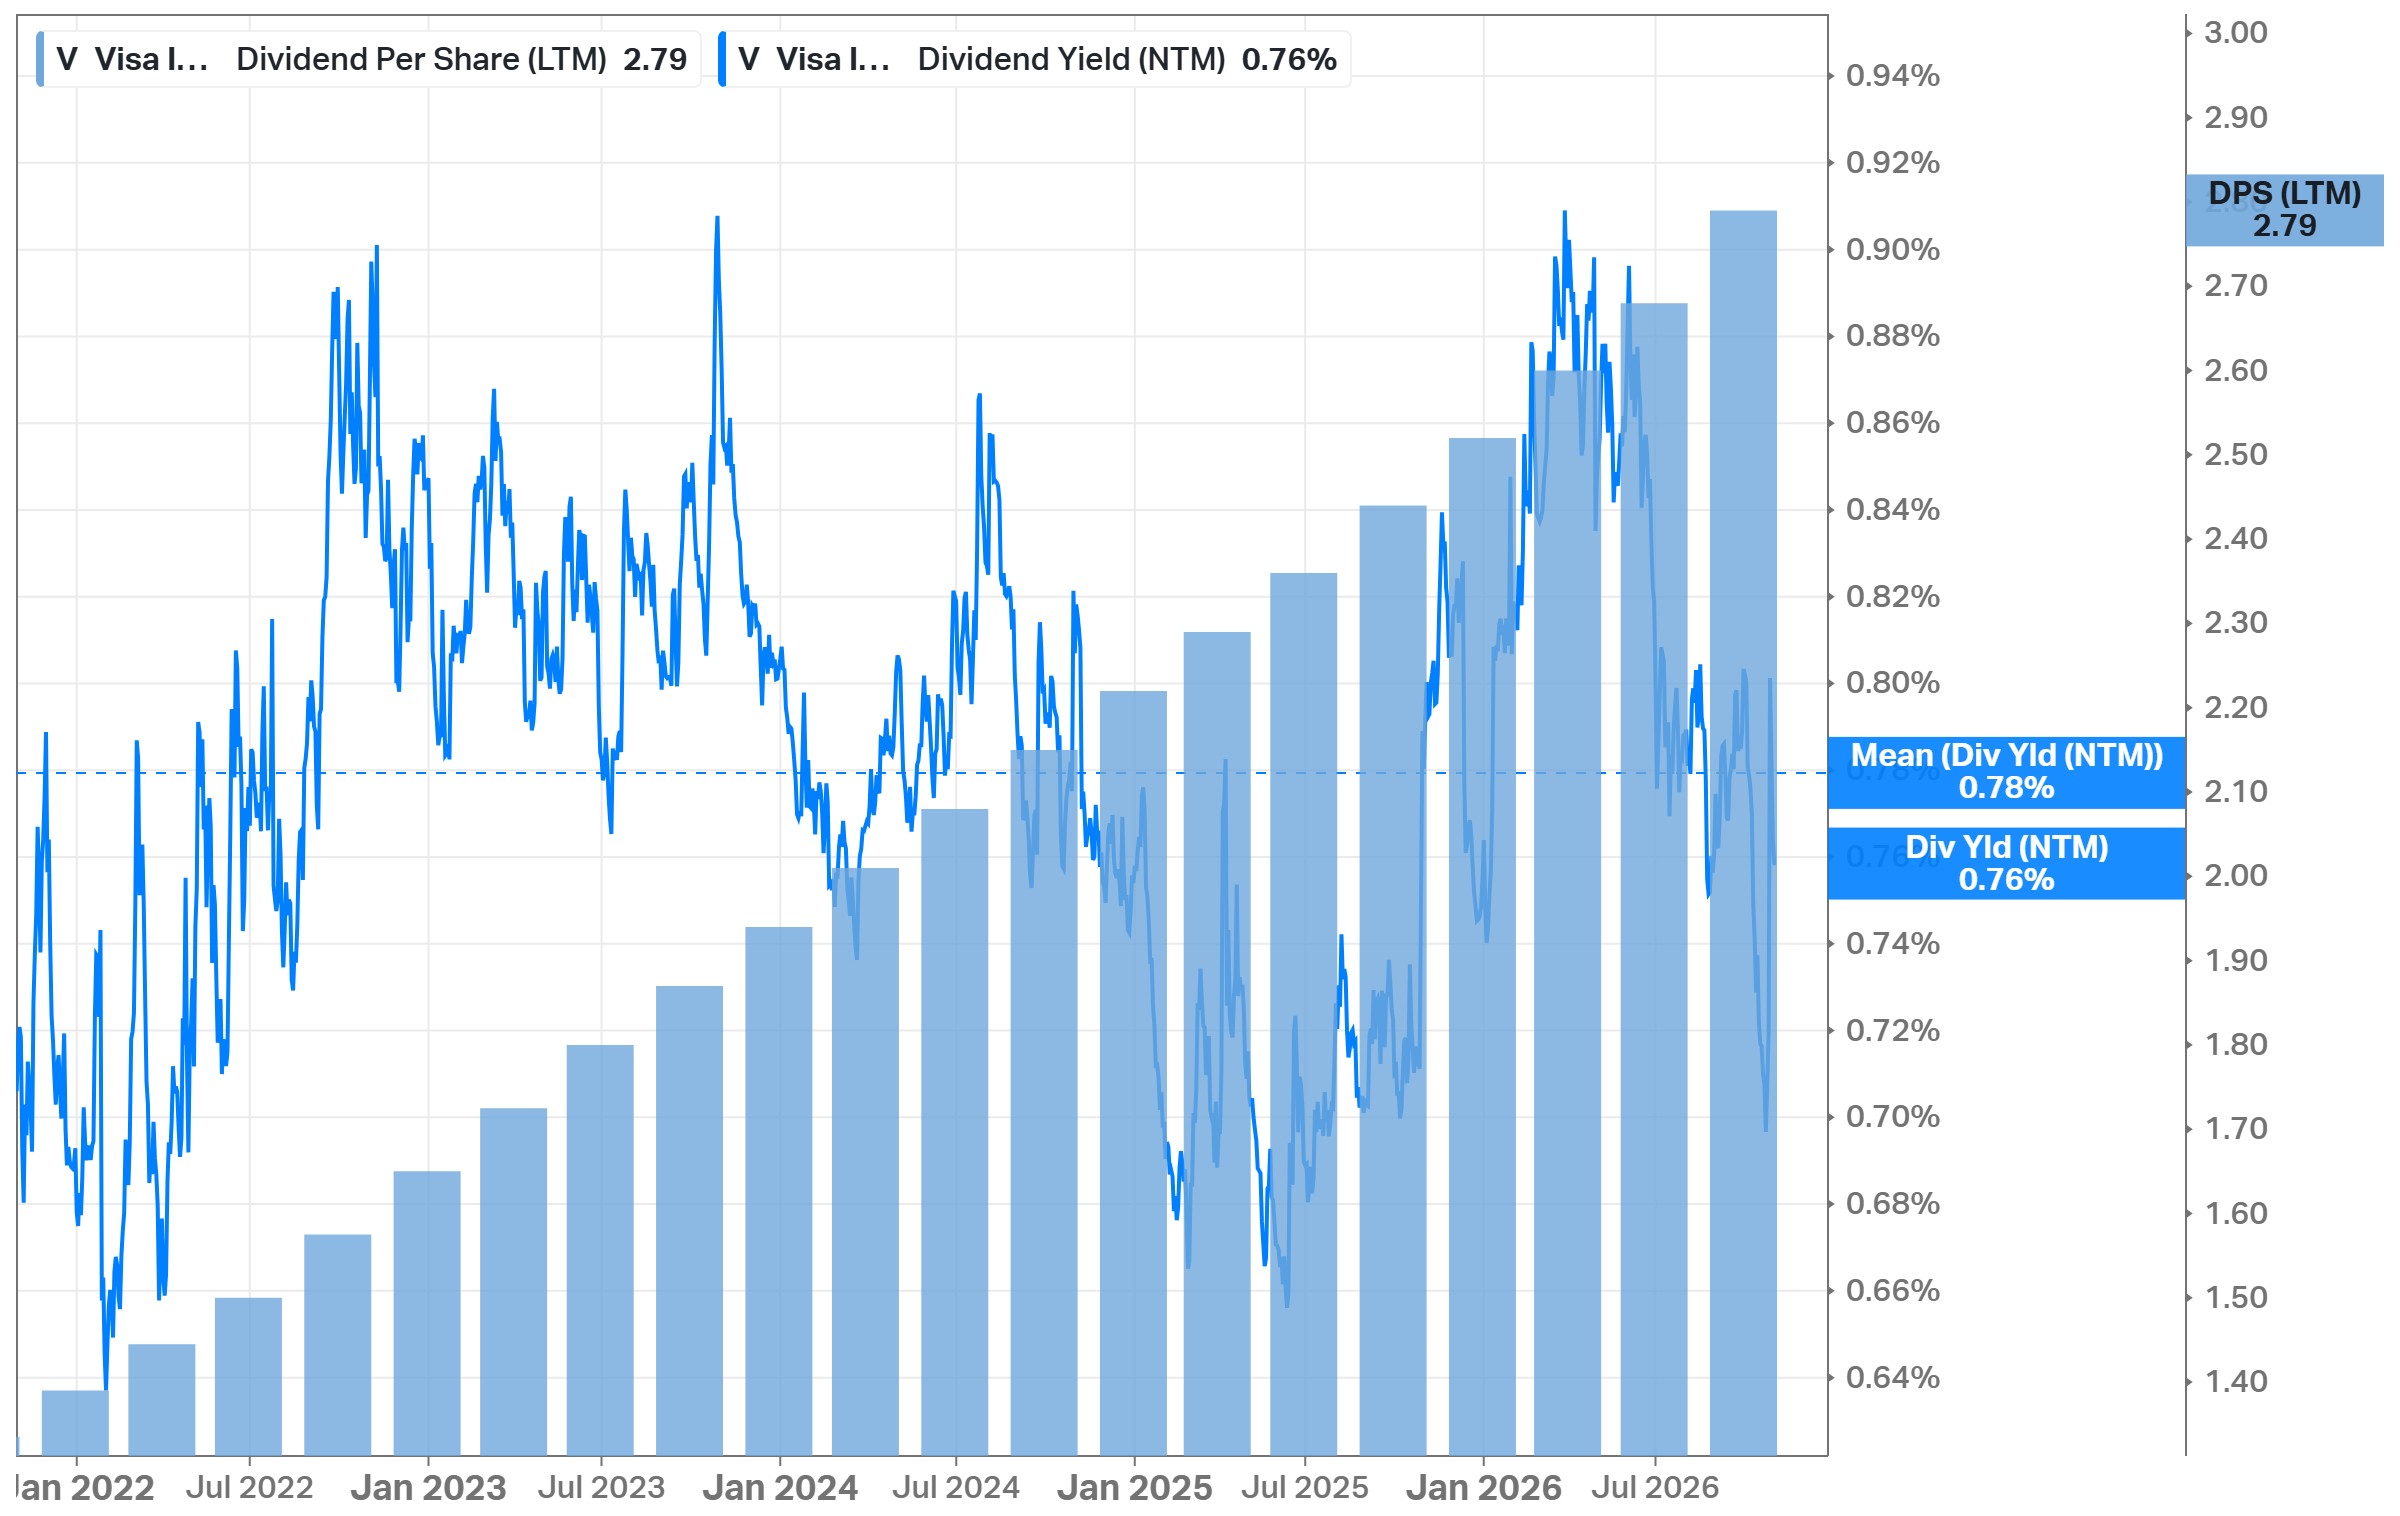
The dividend is small but grows fast. Visa raised its quarterly dividend 16% to $0.78, the 17th increase in a row, and the dividend grew 15.88% per year in the last 5 years. At $414, the yield is 0.75%, and the payout is ~21% of FY2027 consensus EPS. In FY2026, Visa paid $5.11B in dividends.
In total, Visa returned 116% of its FCF. Buybacks and dividends were $25.6B against $22.06B of FCF, and Visa also reduced its debt. The difference came from cash, which decreased from $17.16B to $12.94B, and from the escrow account. As I see it, this pace is not repeatable every year, since it used $4.2B of cash, but the policy did not change. Visa intends “to return excess free cash flow to shareholders through buybacks”.
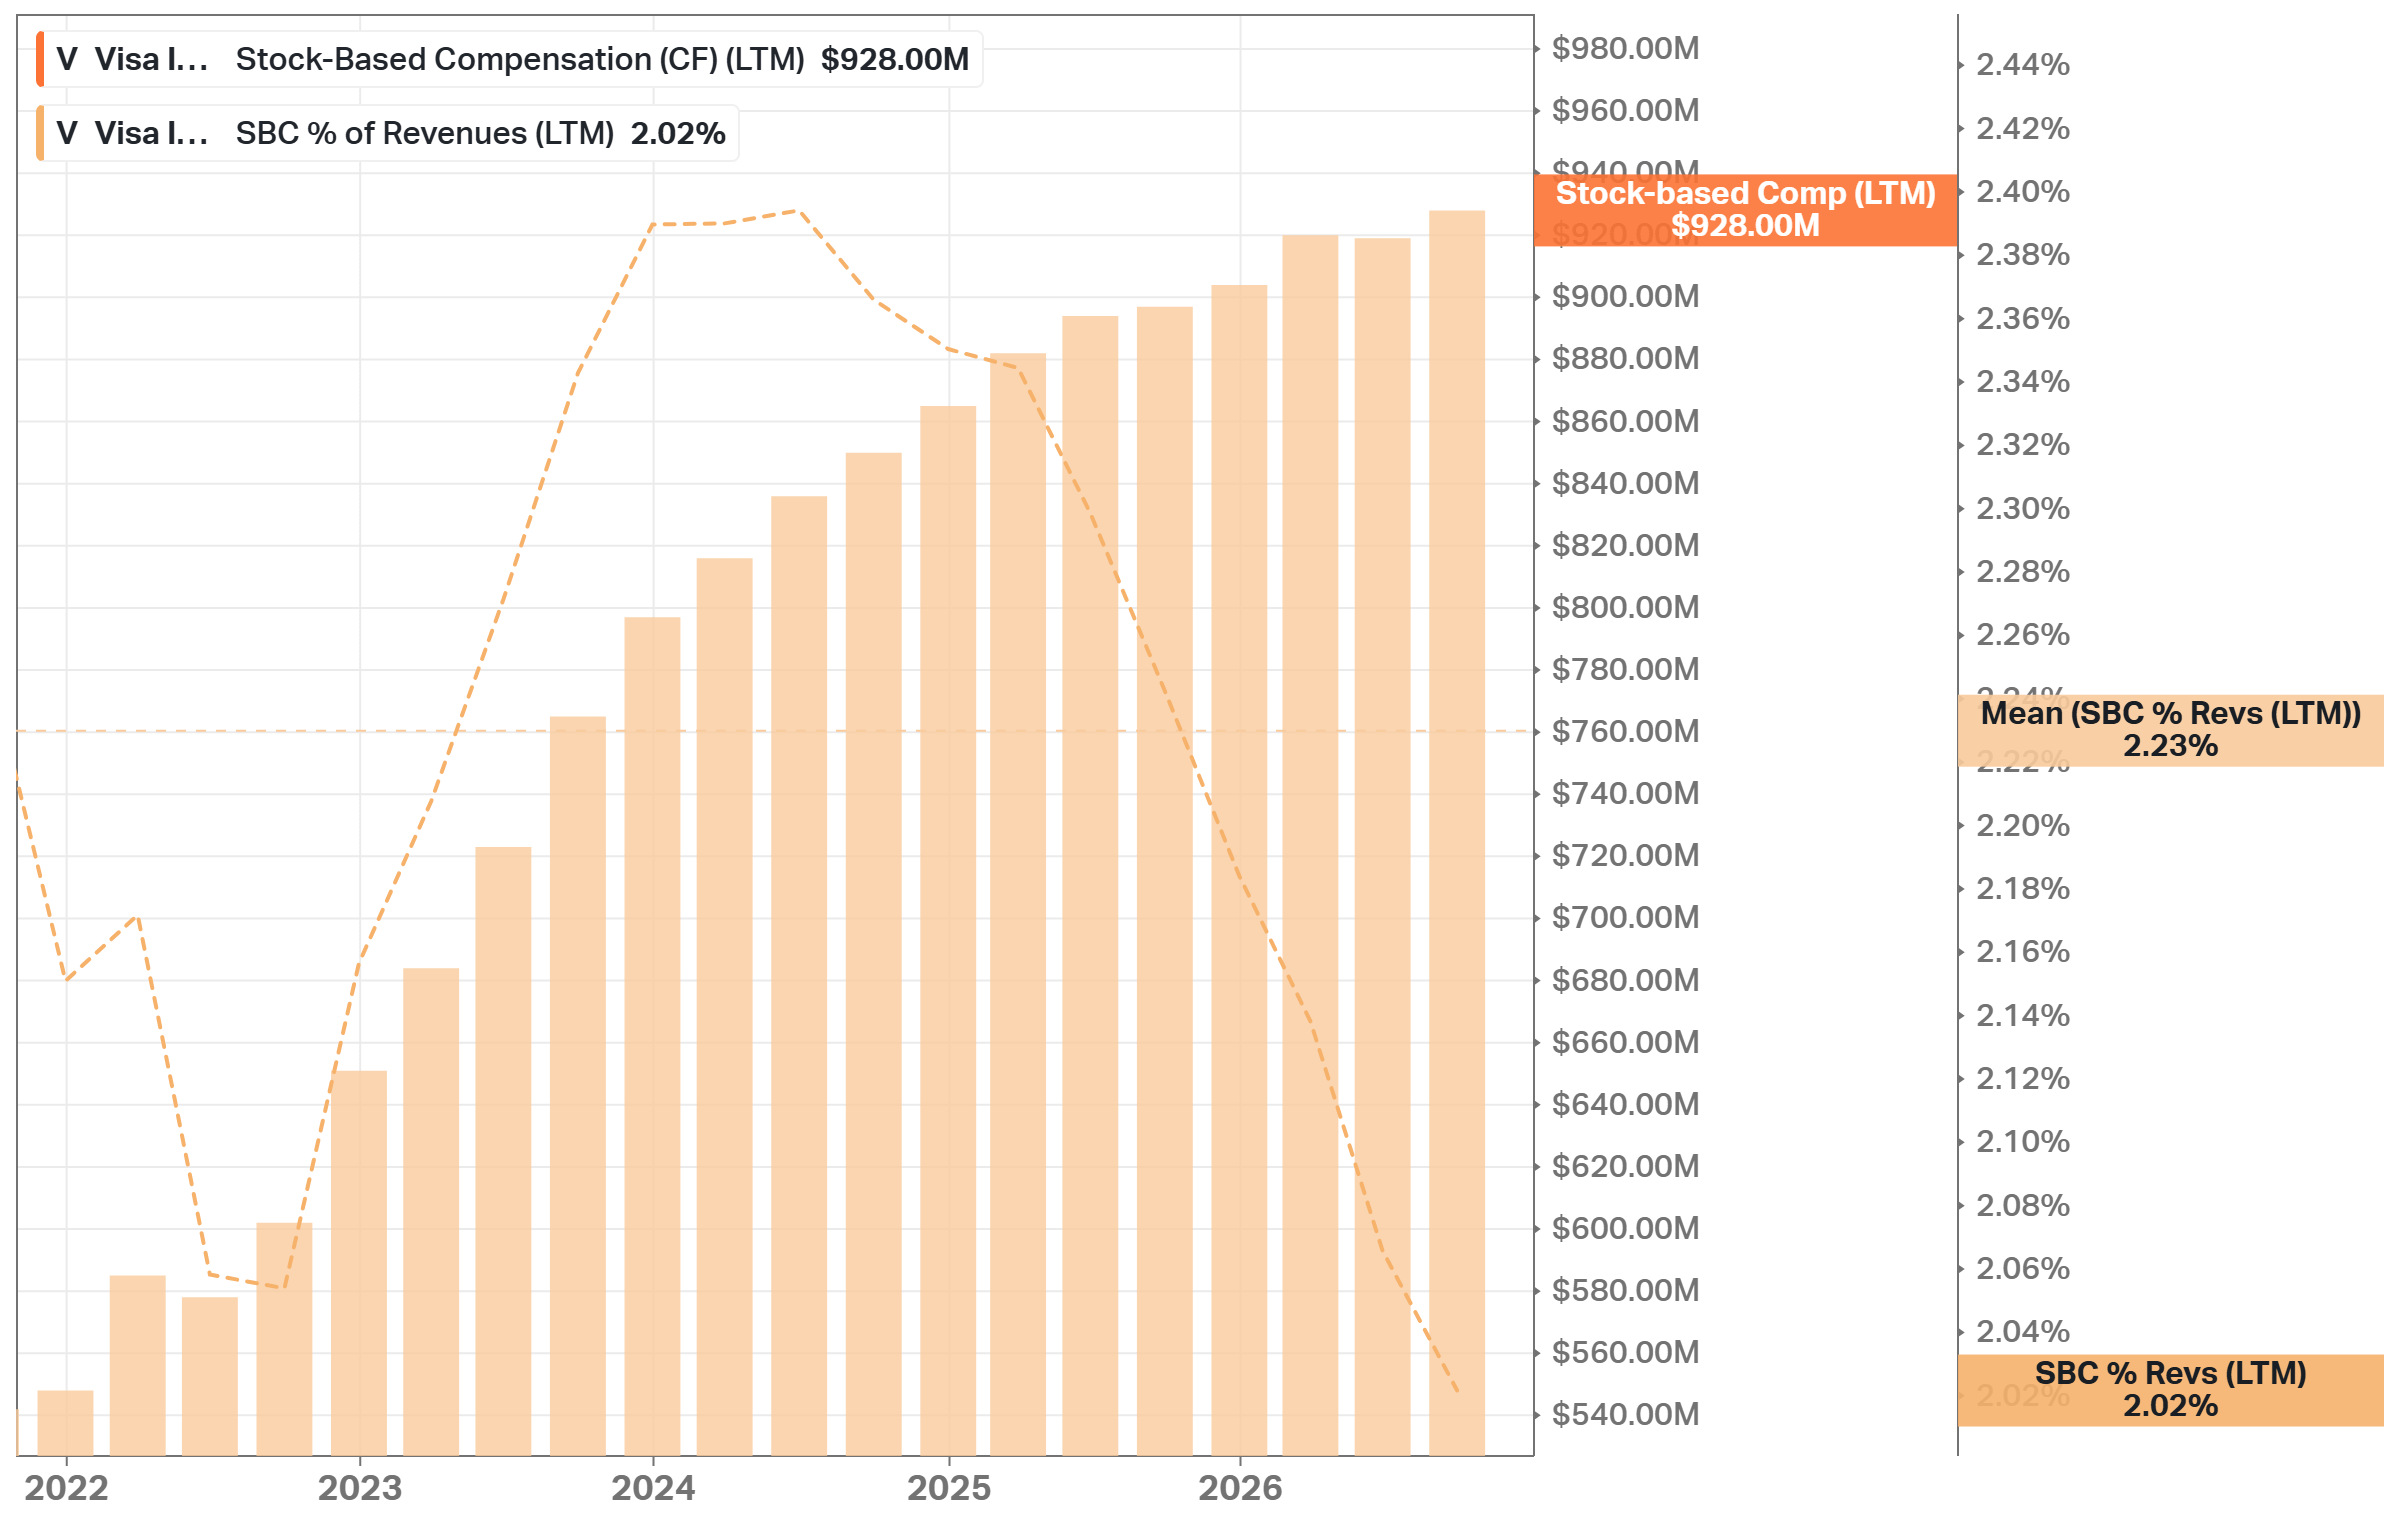
Stock-based compensation (SBC) is $928M, 2.02% of revenue, below its 2.23% 5Y mean. Capex is $1.67B, 3.6% of revenue. Both are small, so almost all of Visa's operating cash flow is available to shareholders.
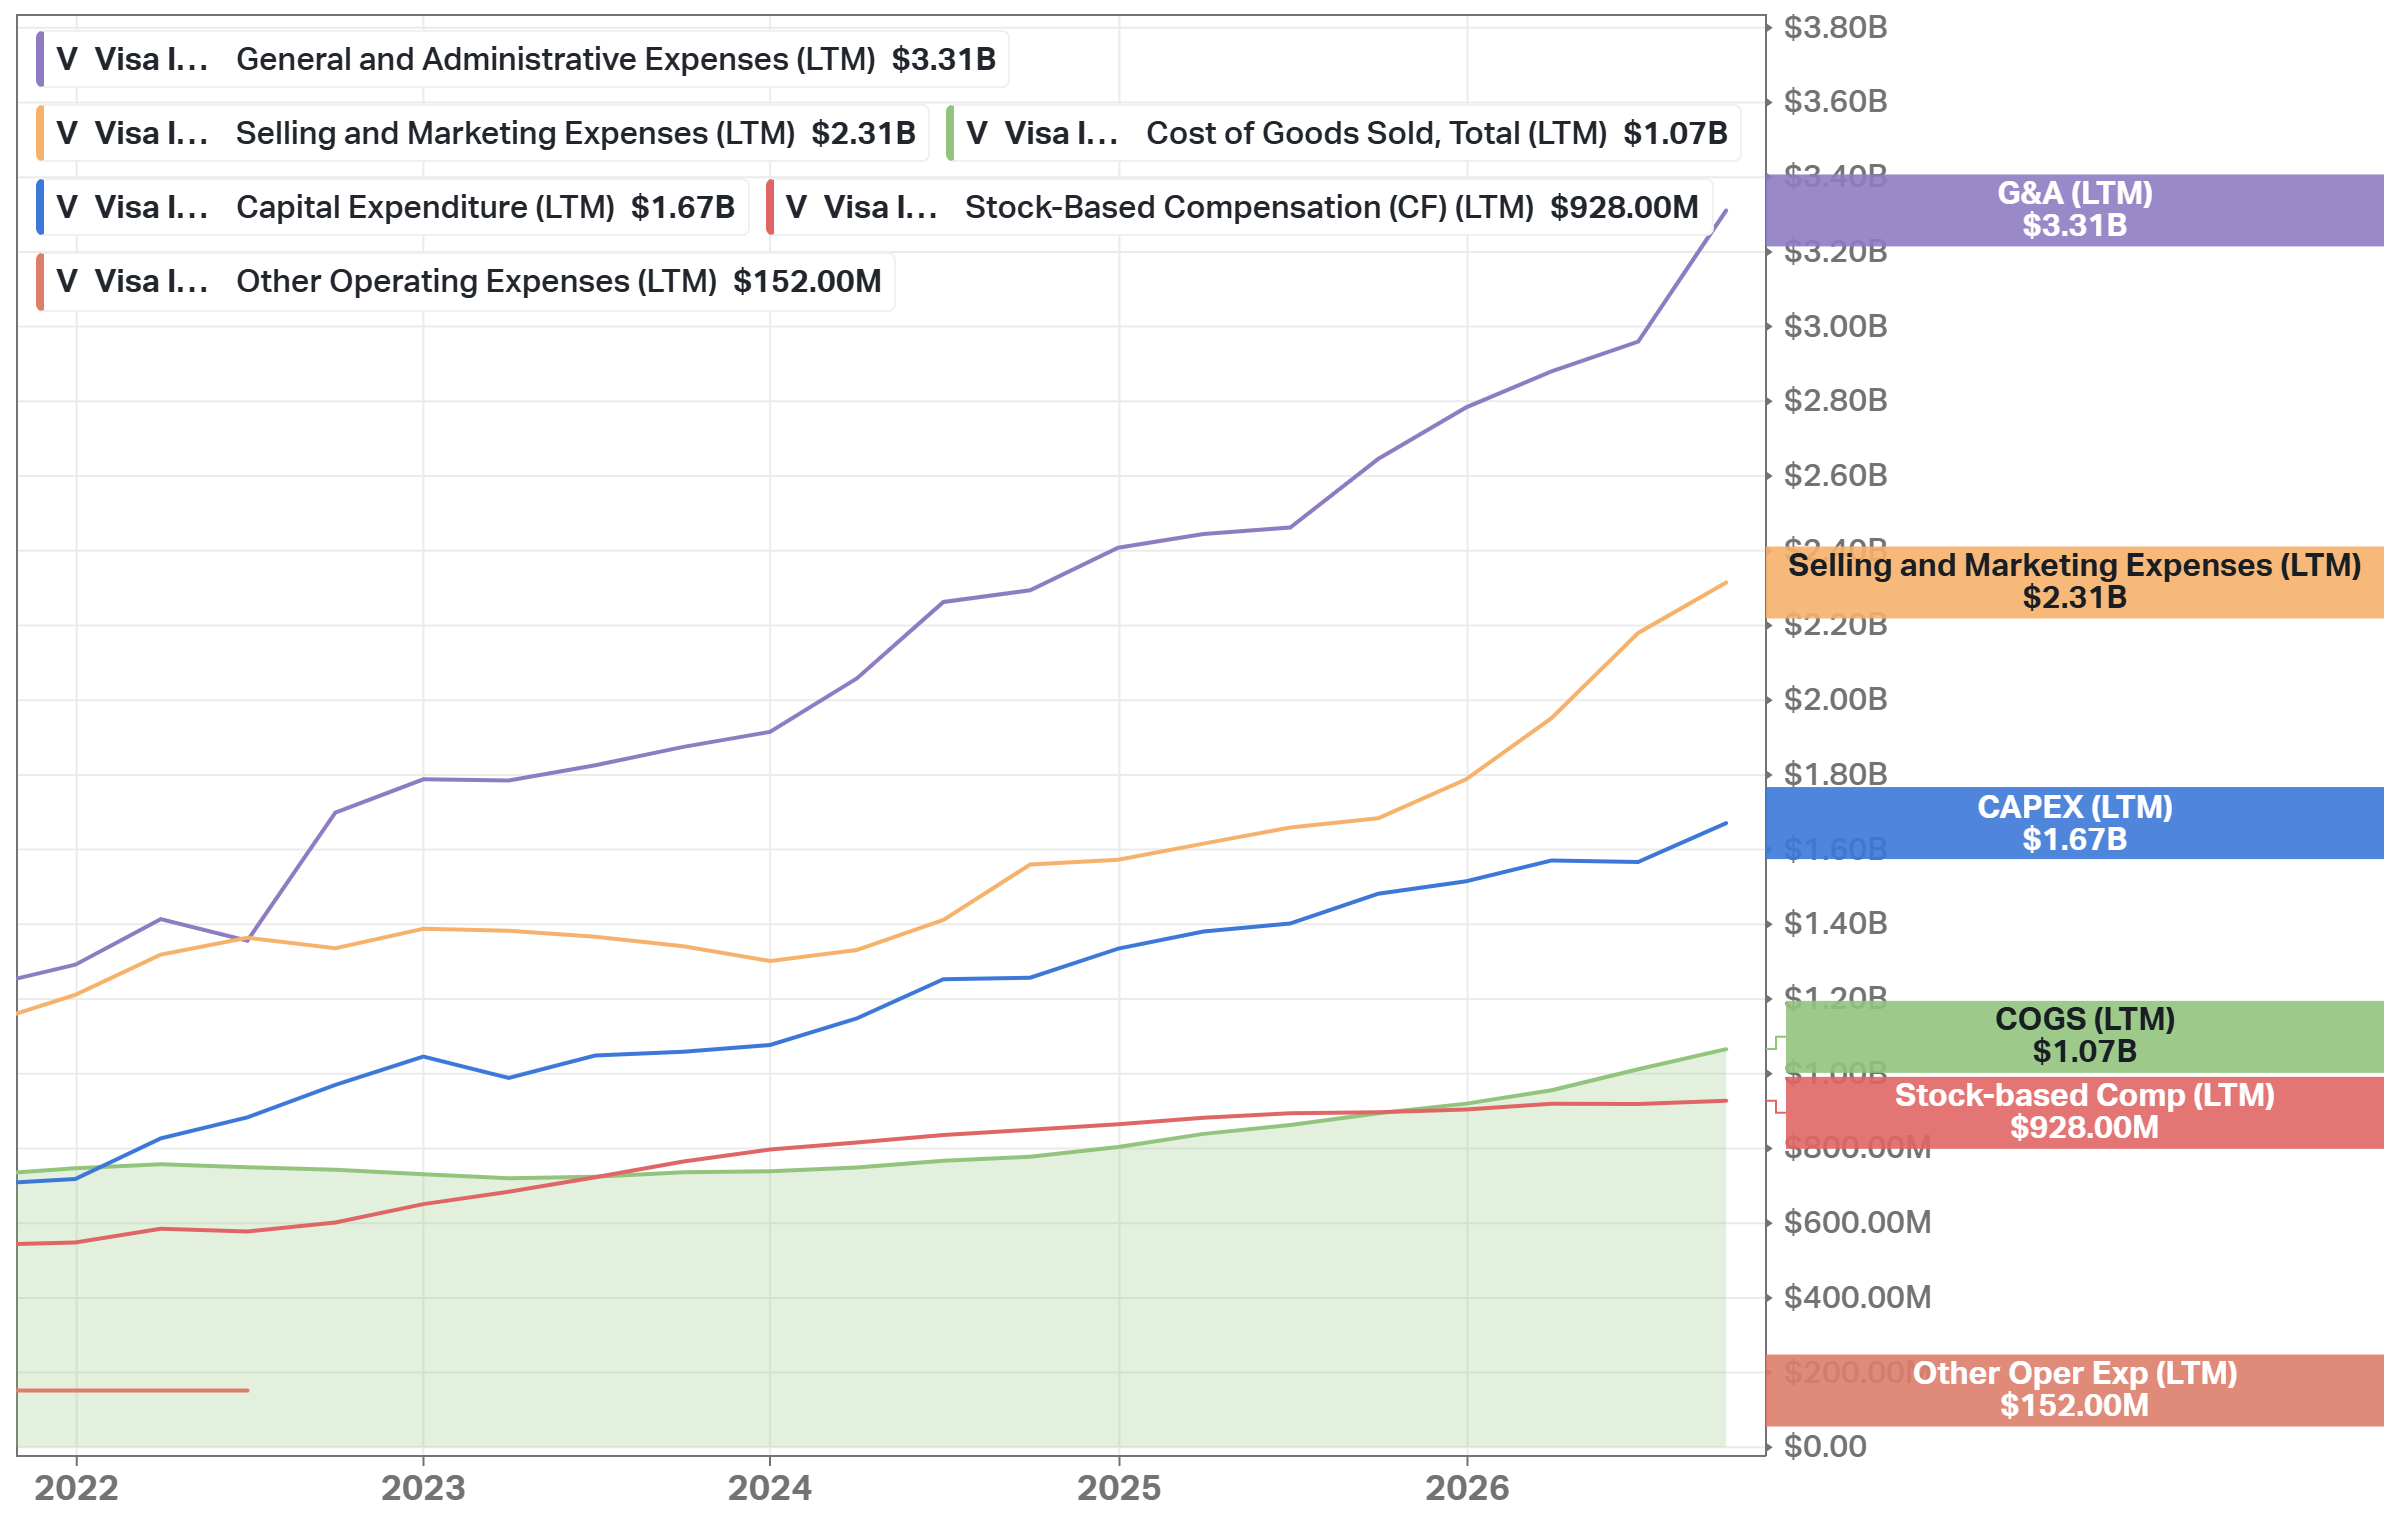
The expense growth is the weak point of FY2026. Non-GAAP operating expenses increased 16%, faster than net revenue (+15%), mostly because of marketing (+37%, partly the FIFA World Cup) and personnel. Visa also booked $563M of severance. For FY2027, Visa expects operating expenses to grow “modestly below net revenue growth”, so the margin should be stable or slightly higher.
As I see it, Visa’s capital allocation is simple and consistent. Visa does few large acquisitions (BioCatch at $2.4B is ~11% of FY2026 FCF), returns almost everything to shareholders, and its buybacks over the last year were made well below today’s price. The guidance is credible: Visa beat the EPS consensus in each of the last 20 quarters, although in Q4, EPS beat Visa’s own plan mostly because of a lower tax rate. The weak spot is the litigation, which costs cash every year, and the question for FY2027 is the cost of the renewals.

Advantages
A network that no competitor can rebuild. $17 trillion of volume in FY2025, 5.2 billion credentials, well over 200 million seller locations, and 281.3 billion processed transactions in FY2026 (+9%).
Pricing power. In Q4, service revenue grew 14% on 10% growth in Q3 payments volume, “primarily due to pricing”, and Visa expects similar pricing in FY2027.
A second source of growth. Value-added services grew 30% to $14B, and together with business payments and money movement, they are more than 40% of net revenue.
Exceptional returns. A 67.5% non-GAAP operating margin, ROIC of 44.10%, and capex of only 3.6% of revenue.
Predictable capital returns. $25.6B of buybacks and dividends in FY2026, 12.8% fewer diluted shares in 5 years, and 17 dividend increases in a row.
Disadvantages
Incentives grow faster than revenue. +21% in Q4, 29.7% of gross revenue, and ~25% of payments volume up for renewal in FY2027.
Constant legal and regulatory pressure. $1.76B of litigation provisions in FY2026 and $2.56B in FY2025, the merchant settlement that cuts US credit interchange, and the US Justice Department lawsuit on debit. According to the 2024 lawsuit, Visa collects more than $7B a year in US debit processing fees (equal to ~15% of FY2026 net revenue), and the litigation escrow does not cover this case.
Cross-border revenue lags cross-border volume. International transaction revenue grew 8% in FY2026 and in Q4, against 14% volume growth in Q4, because currency volatility was lower, and Visa expects volatility to be a drag in FY2027.
Expenses grew faster than revenue in FY2026. Non-GAAP operating expenses +16%, marketing +37%, and $563M of severance.
The stock is not cheap. 27.5x forward earnings, above the 26.6x 5Y mean, and PEG of 1.96.
What the bears get right: Part of Visa’s FY2026 growth came from sources that do not repeat: the FIFA World Cup marketing services and the acquisitions (Prisma and Newpay added ~1 point to Q4 net revenue growth). The renewals may also give back part of the pricing through incentives. In FY2027, ~25% of the payments volume comes up for renewal, and incentives already grew 21% in Q4. At the same time, the pressure comes from several sides at once: a lower debit cap, the Credit Card Competition Act, the Justice Department lawsuit, the settlement that lets merchants decline premium cards, and Capital One testing its credit cards on its own network. None of them breaks the moat alone, but together they can slow net revenue growth to high single digits. And the stock is priced for the good case. From ~28-31x, V derated twice in the last 5 years, in 2022 and from mid-2025 to March 2026, both times to ~22x. At 22x in FY2032, even the full consensus growth gives a fair price of ~$373, 10% below today’s price. If EPS growth also slows to ~11%, the pace of the low end of the guidance, the fair price at 22x is ~$327, 21% below.
Competitors
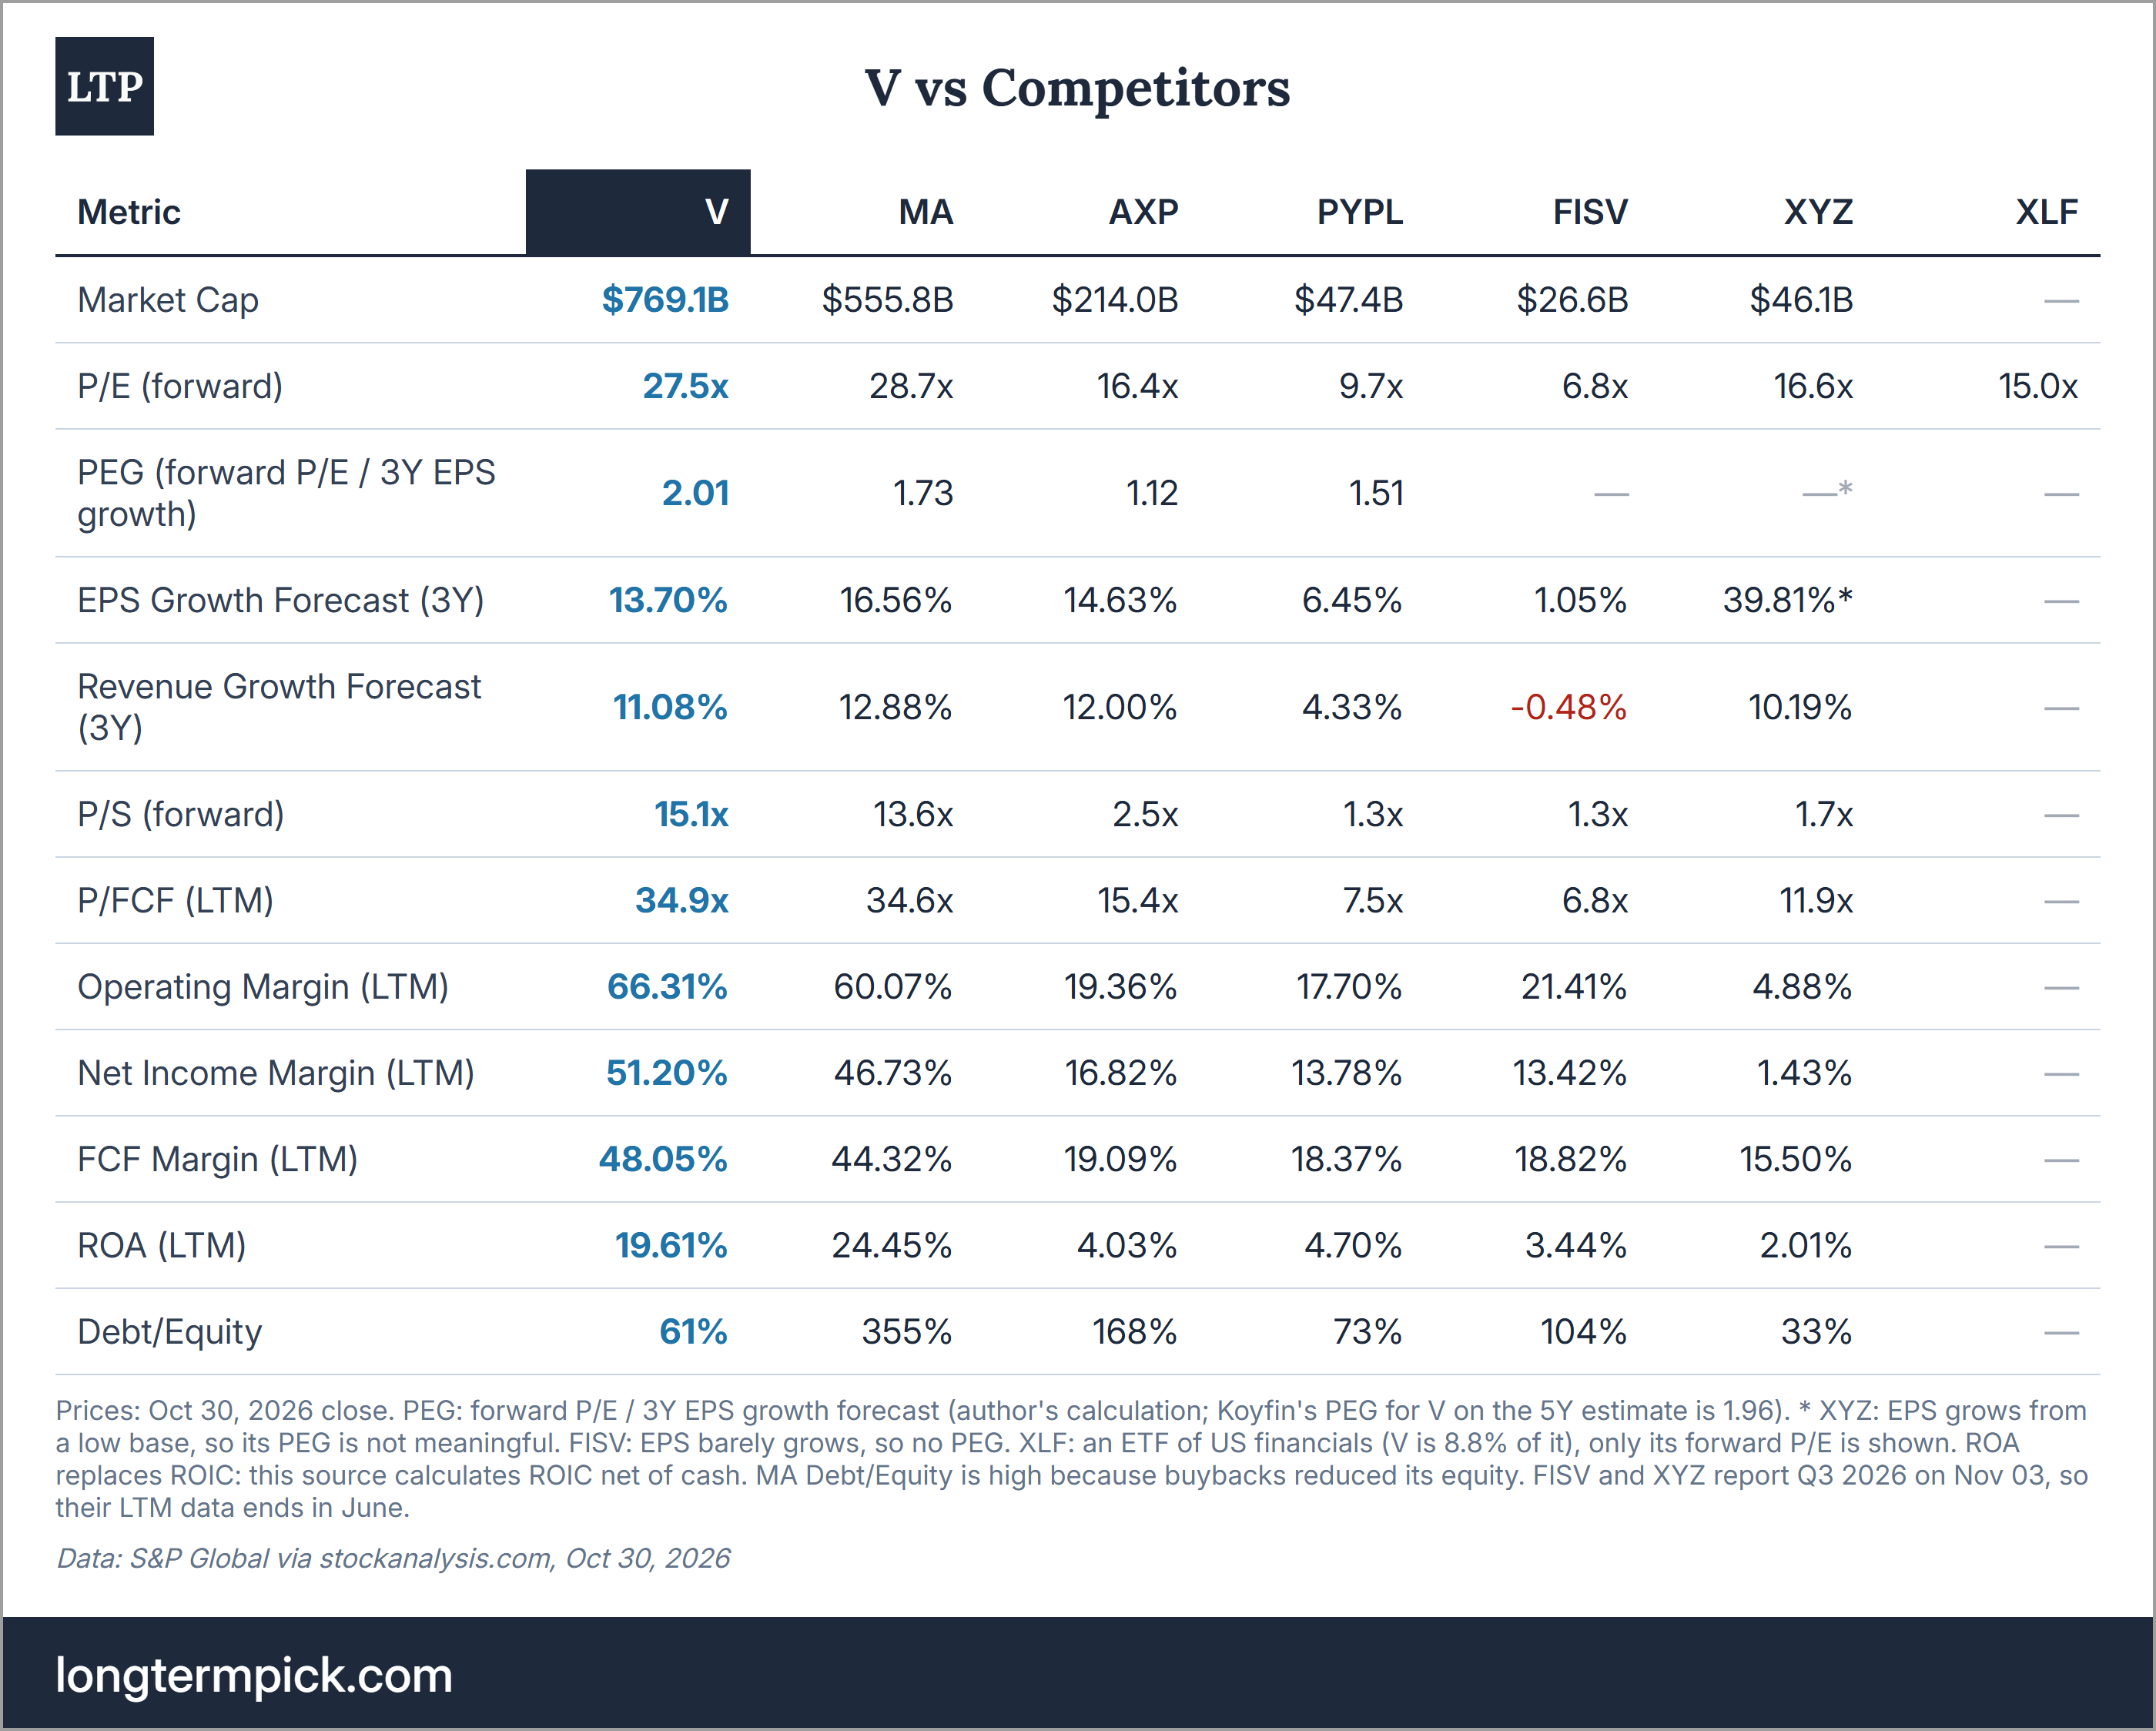
I compare Visa with 5 companies. Mastercard (MA) has the same model, a global network without credit risk, and is the closest competitor. American Express (AXP) is a network and a card issuer at once, so it has credit risk and rewards costs. PayPal (PYPL) competes for online checkout and money transfers. Fiserv (FISV) and Block (XYZ) are on the merchant side, with acceptance, processing and, for Block, Cash App. Global Payments (GPN) is not in the table, since its numbers after the Worldpay deal are not comparable yet. Discover is now part of Capital One, and its network has no separate stock.
On valuation, V and MA are the most expensive stocks in the table. On the same S&P Global data and the Oct 30 close, V trades at 27.5x forward earnings, against 28.7x for MA and 15.0x for XLF, the sector benchmark. The rest of the table is much cheaper: AXP at 16.4x, PYPL at 9.7x, and FISV at 6.8x, after Fiserv’s revenue fell 4% in Q2. The difference is growth. On the 3Y EPS forecast in the table, Mastercard grows 16.56% per year against 13.70% for Visa, so MA has the lower PEG, 1.73 against 2.01.
Part of this gap is timing. The 3Y windows are not the same. Mastercard’s fiscal year is the calendar year, so its 3Y forecast still includes 2026, when its EPS is expected to grow 18%. Visa’s starts with FY2027. On the next year alone, consensus expects +15% for Mastercard and +13% for Visa. On next year’s growth, MA’s PEG is ~1.86 against ~2.08 for V. The gap is smaller, but MA is still cheaper per point of growth.
The latest quarter is mixed. On net revenue, Mastercard grew slightly faster in its Q3 (+14% against +13% in Visa’s Q4), but Visa grew faster in value-added services (+31% in constant dollars against +19%) and cross-border volume (+14% against +11%). Mastercard’s US debit volume grew only 1.4% after Capital One moved its debit cards from Mastercard to Discover, while Visa’s US debit volume grew 9% in its Q4. AmEx grew revenue 9%, and PayPal only 2%.
On margins, Visa leads; on returns, only Mastercard is ahead. Visa’s LTM operating margin is 66.31%, against 60.07% for Mastercard and 4.88-21.41% for the others. The net margin (51.20%) and the FCF margin (48.05%) are the highest in the table too, even with the litigation payments in FY2026 FCF. Mastercard’s ROA is higher (24.45% against 19.61%), and its Debt/Equity is 355% because buybacks reduced its equity. Visa’s 61% is the second-lowest after Block.
In my view, Mastercard is the next-best alternative. Mastercard has the same moat and slightly faster expected growth, and MA has a lower PEG at almost the same multiple. Visa’s advantages are the higher margin, lower leverage, and 70% of the US Visa and Mastercard volume, but the US debit position is also the target of the Justice Department. As I see it, the choice between V and MA is not about quality. V is ~1 turn cheaper on forward earnings, MA is cheaper per point of growth, and neither is cheap. PYPL and FISV are cheap because their revenue barely grows, and AXP has credit risk.
Past
Q4 FY2026 (ended Sep 30, all USD, YoY):
Net revenue +13% to $12.14B (+13% in constant dollars), against the $12.09B consensus
Non-GAAP EPS +17% to $3.48, against the $3.43 consensus; GAAP EPS +22% to $3.19
Payments volume +9% and cross-border volume +14% (constant dollars); processed transactions +10% to 74.2 billion
Client incentives +21% to $5.12B; non-GAAP operating expenses +12%
FCF $6.89B; buybacks $3.98B (11M shares at an average of $369) and dividends $1.26B
FY2026: net revenue $45.90B (+15%), non-GAAP EPS $13.27 (+16%), GAAP EPS $12.32 (+21%), FCF $22.06B (+2%), and ROIC 44.10%
Why did V barely move after the report? The day after, V fell 0.3%, and on Oct 29 it gained 2.5%. In my view, there are three reasons:
The stock had already moved. From Sep 30 to the Oct 27 close, V gained 11.8%, so a good report was already in the price.
The beat was small. EPS was 1.5% above consensus, and EPS was better than Visa expected, primarily due to a “lower-than-expected tax rate”. Revenue was 0.4% above consensus.
The guidance confirmed the consensus but did not raise it. Low-double-digit revenue growth and EPS growth in the “low double digits to low teens” are in line with the +11% and +13% that consensus now expects, and Visa said that incentives growth will step up in FY2027.
The FY2027 estimates went up, not down. In the 4 weeks to Nov 02, a period that includes the report, 11 of the 16 analysts in the Zacks consensus raised their FY2027 EPS estimate and 1 cut it. The Zacks consensus is $15.03, the same as on Koyfin. At the same time, the 5Y EPS growth estimate decreased from 14.41% to 14.01%.
The Oct 29 gain was not about Visa. Mastercard reported that day, and MA gained 4.2%. Over October, MA gained 15.7%, as much as V, and the forward P/E of V increased from ~25x at the end of September to ~28x in mid-October, before the report changed any estimate. So the October move was a higher multiple for both networks. On Oct 13, China’s central bank approved Visa’s application to prepare a domestic card clearing business, but it is only permission to prepare, and V started to rise before it.
The longer history is steady. Net revenue increased from $24.1B in FY2021 to $45.9B in FY2026 (13.75% per year), non-GAAP EPS from $5.91 to $13.27 (17.56% per year), and GAAP EPS grew every year. The only weak year for GAAP EPS was FY2025 (+4.8%), because of $2.56B of litigation provisions; non-GAAP EPS grew 14.1% that year. The diluted share count decreased 12.8% in 5 years, so about 3 points a year of EPS growth came from buybacks. FCF grew only 8.72% per year, slower than EPS, partly because of the litigation payments.
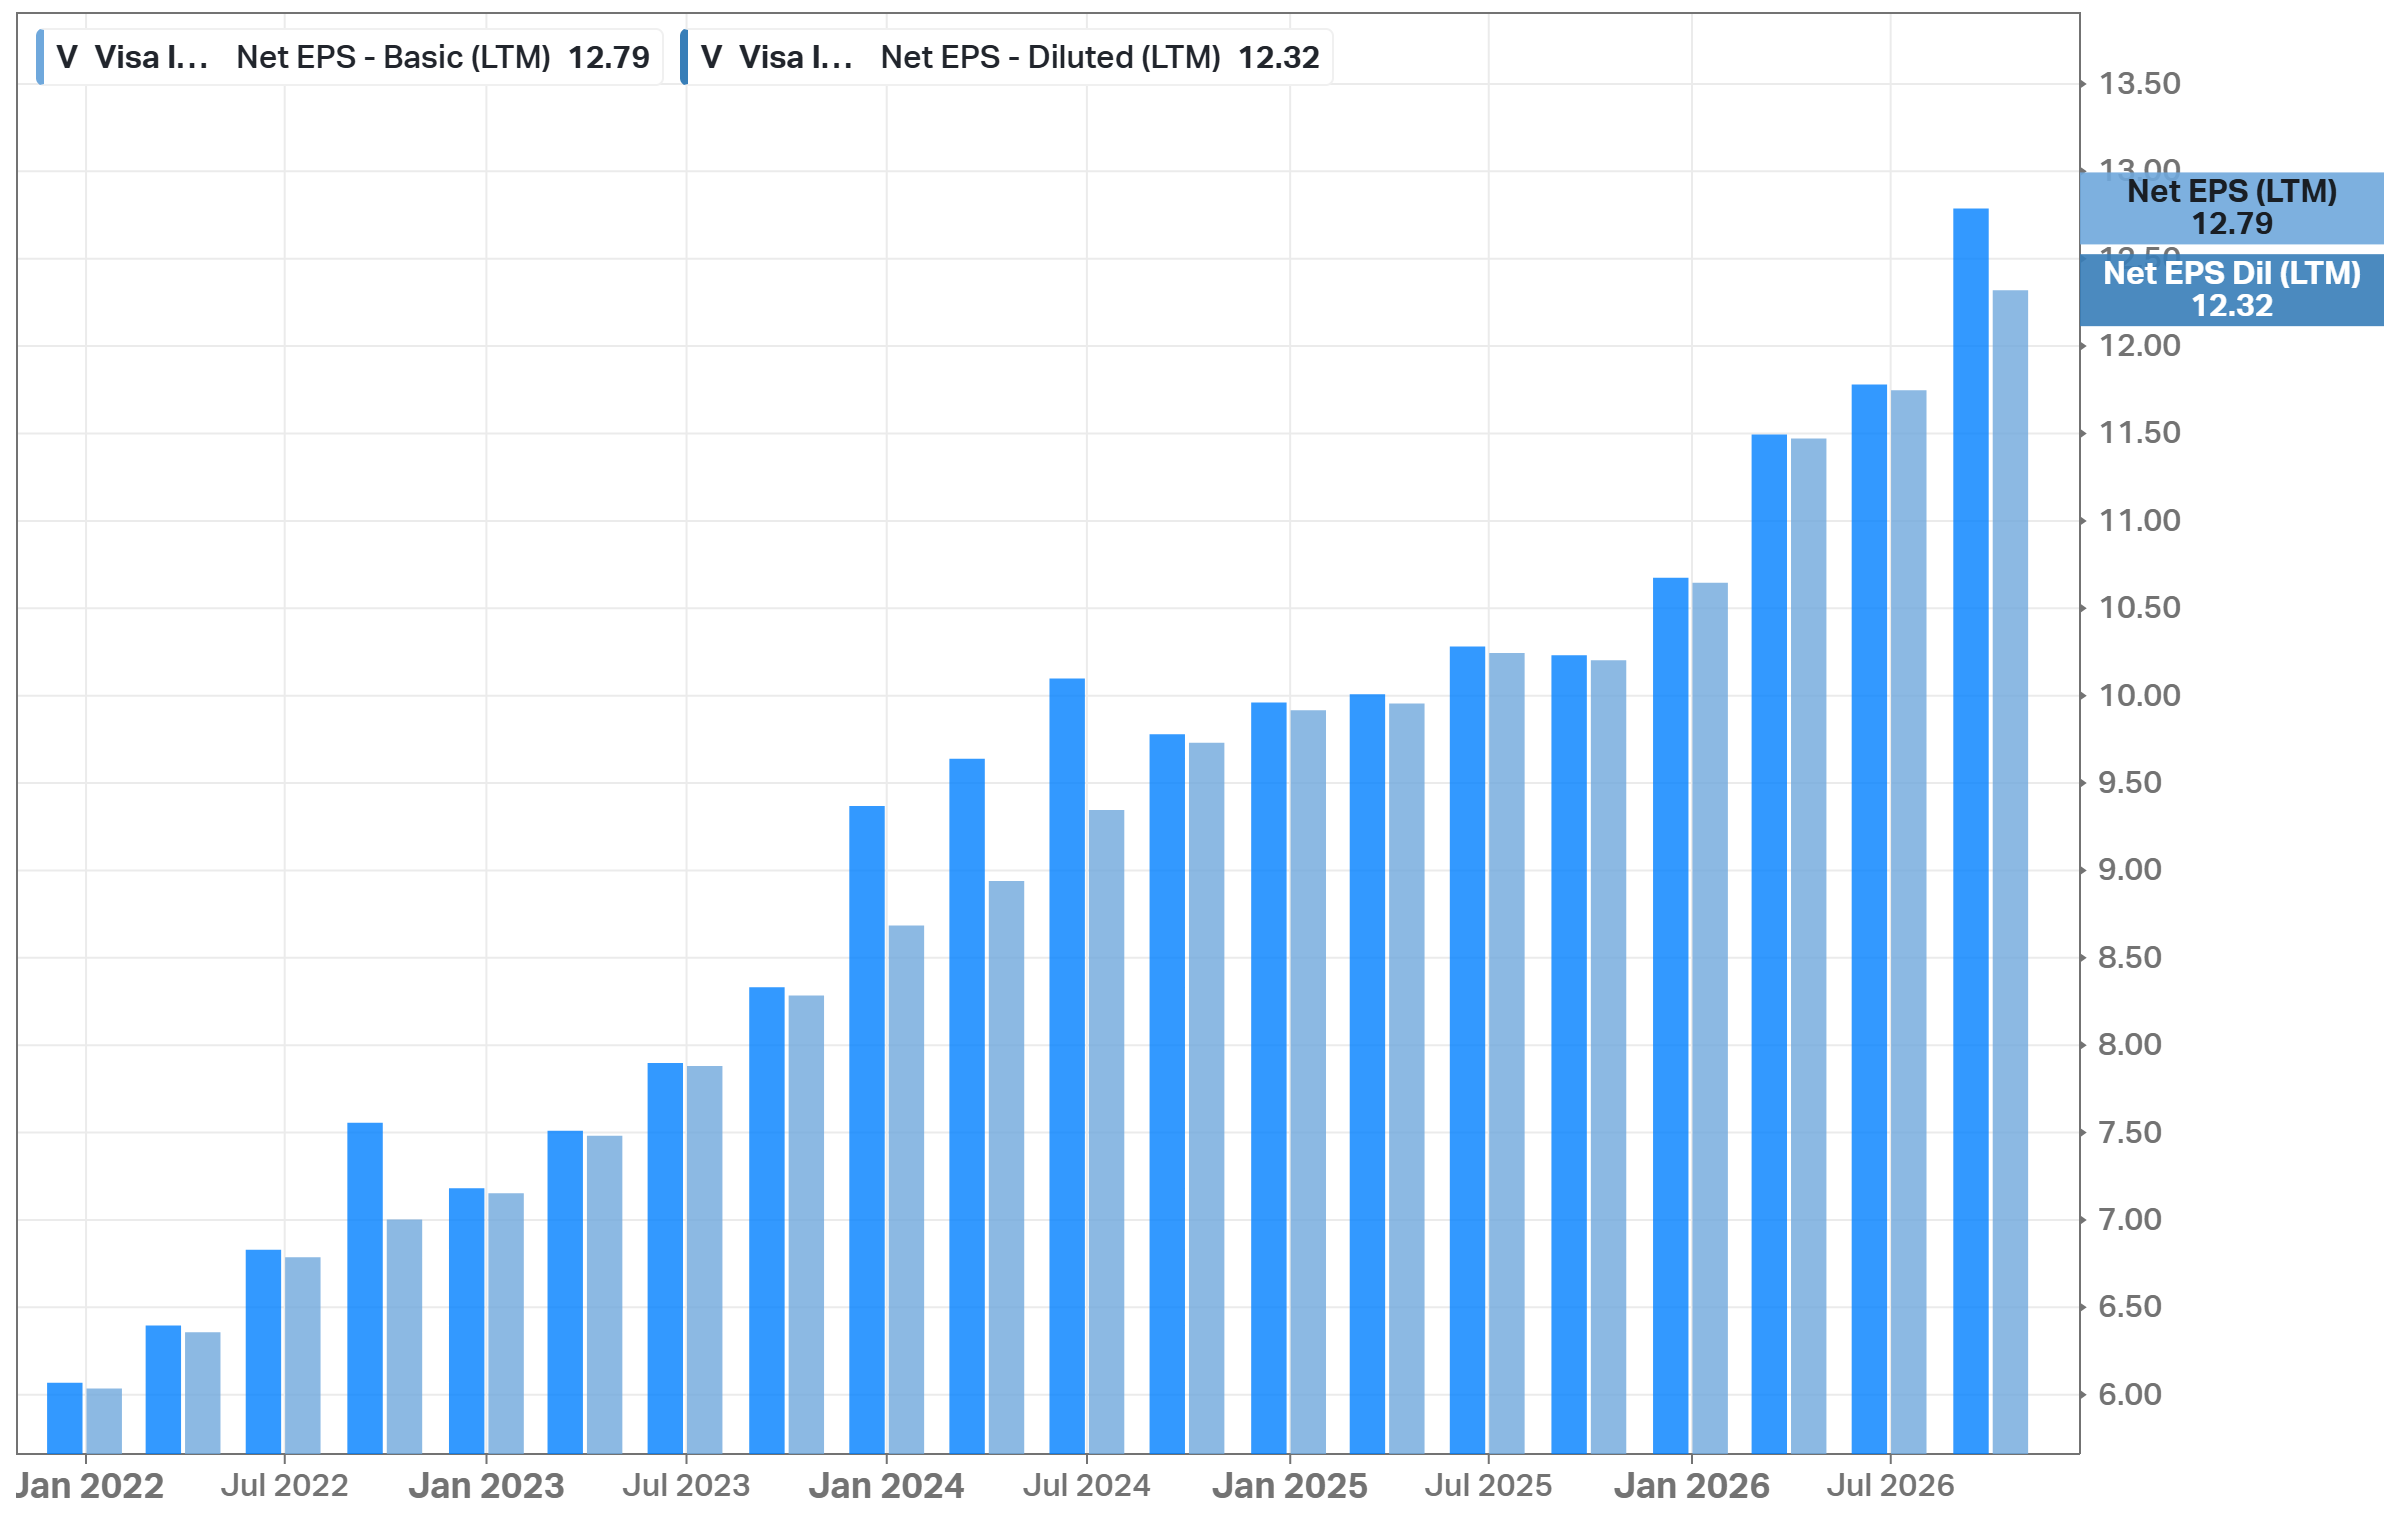
The Koyfin chart shows GAAP EPS. The gap between basic ($12.79) and diluted ($12.32) EPS in FY2026 comes from the share classes - diluted EPS counts the class B and C shares as converted into class A.
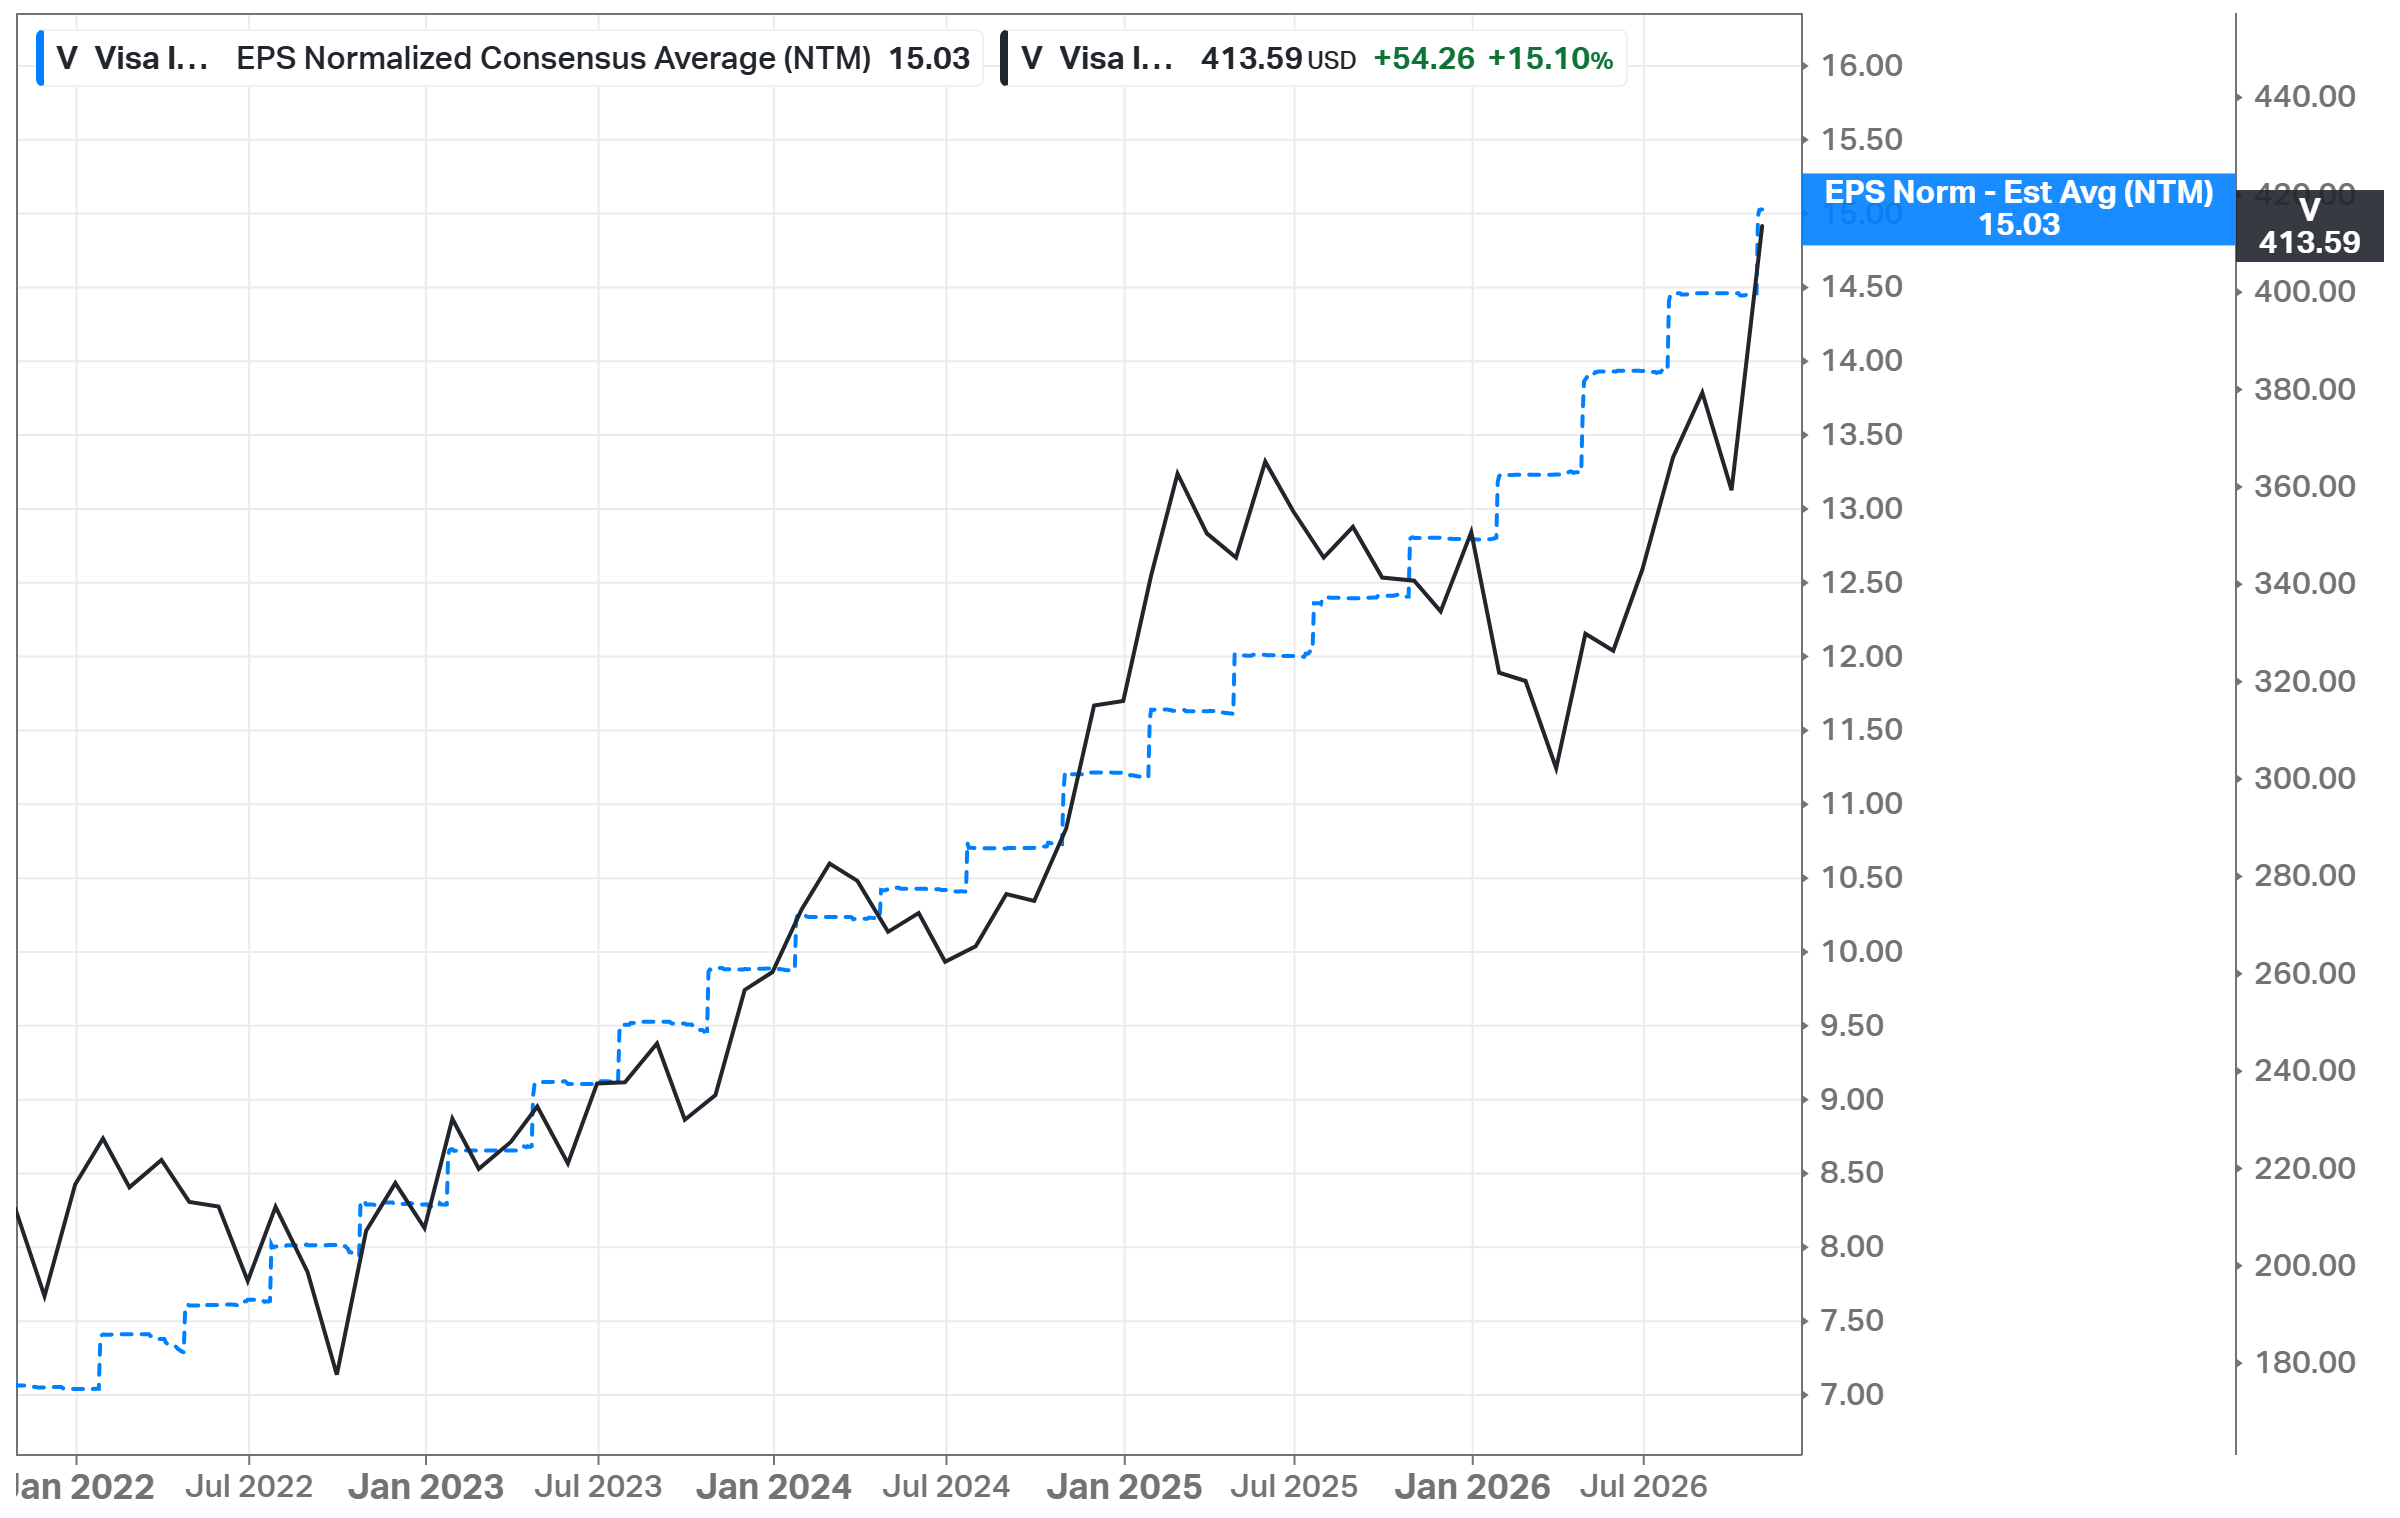
The consensus EPS grew every quarter, and the price caught up only now. The NTM EPS consensus more than doubled from ~$7 at the start of 2022 to $15.03. The price went the same way, but with a long pause - from its June 2025 high of $373 to the March 27 low of $296, V fell 21%, while the NTM EPS consensus increased ~9%. Since the March 27 low, V is up 40%, and ~60% of it was the multiple, from ~22.5x back to 27.5x. Over 2026 as a whole, the return came from EPS, since the multiple is about where it started the year.
I did not find one verified reason for the derating from mid-2025 to March 2026. It came together with the GENIUS Act on stablecoins (July 2025), Trump’s call for a 10% cap on card interest rates (January 2026), and his support for the Credit Card Competition Act. None of them changed Visa’s numbers. The conflict in the Middle East did. Travel stocks fell when it escalated in early March, and Visa says FY2027 laps its impact on cross-border travel.
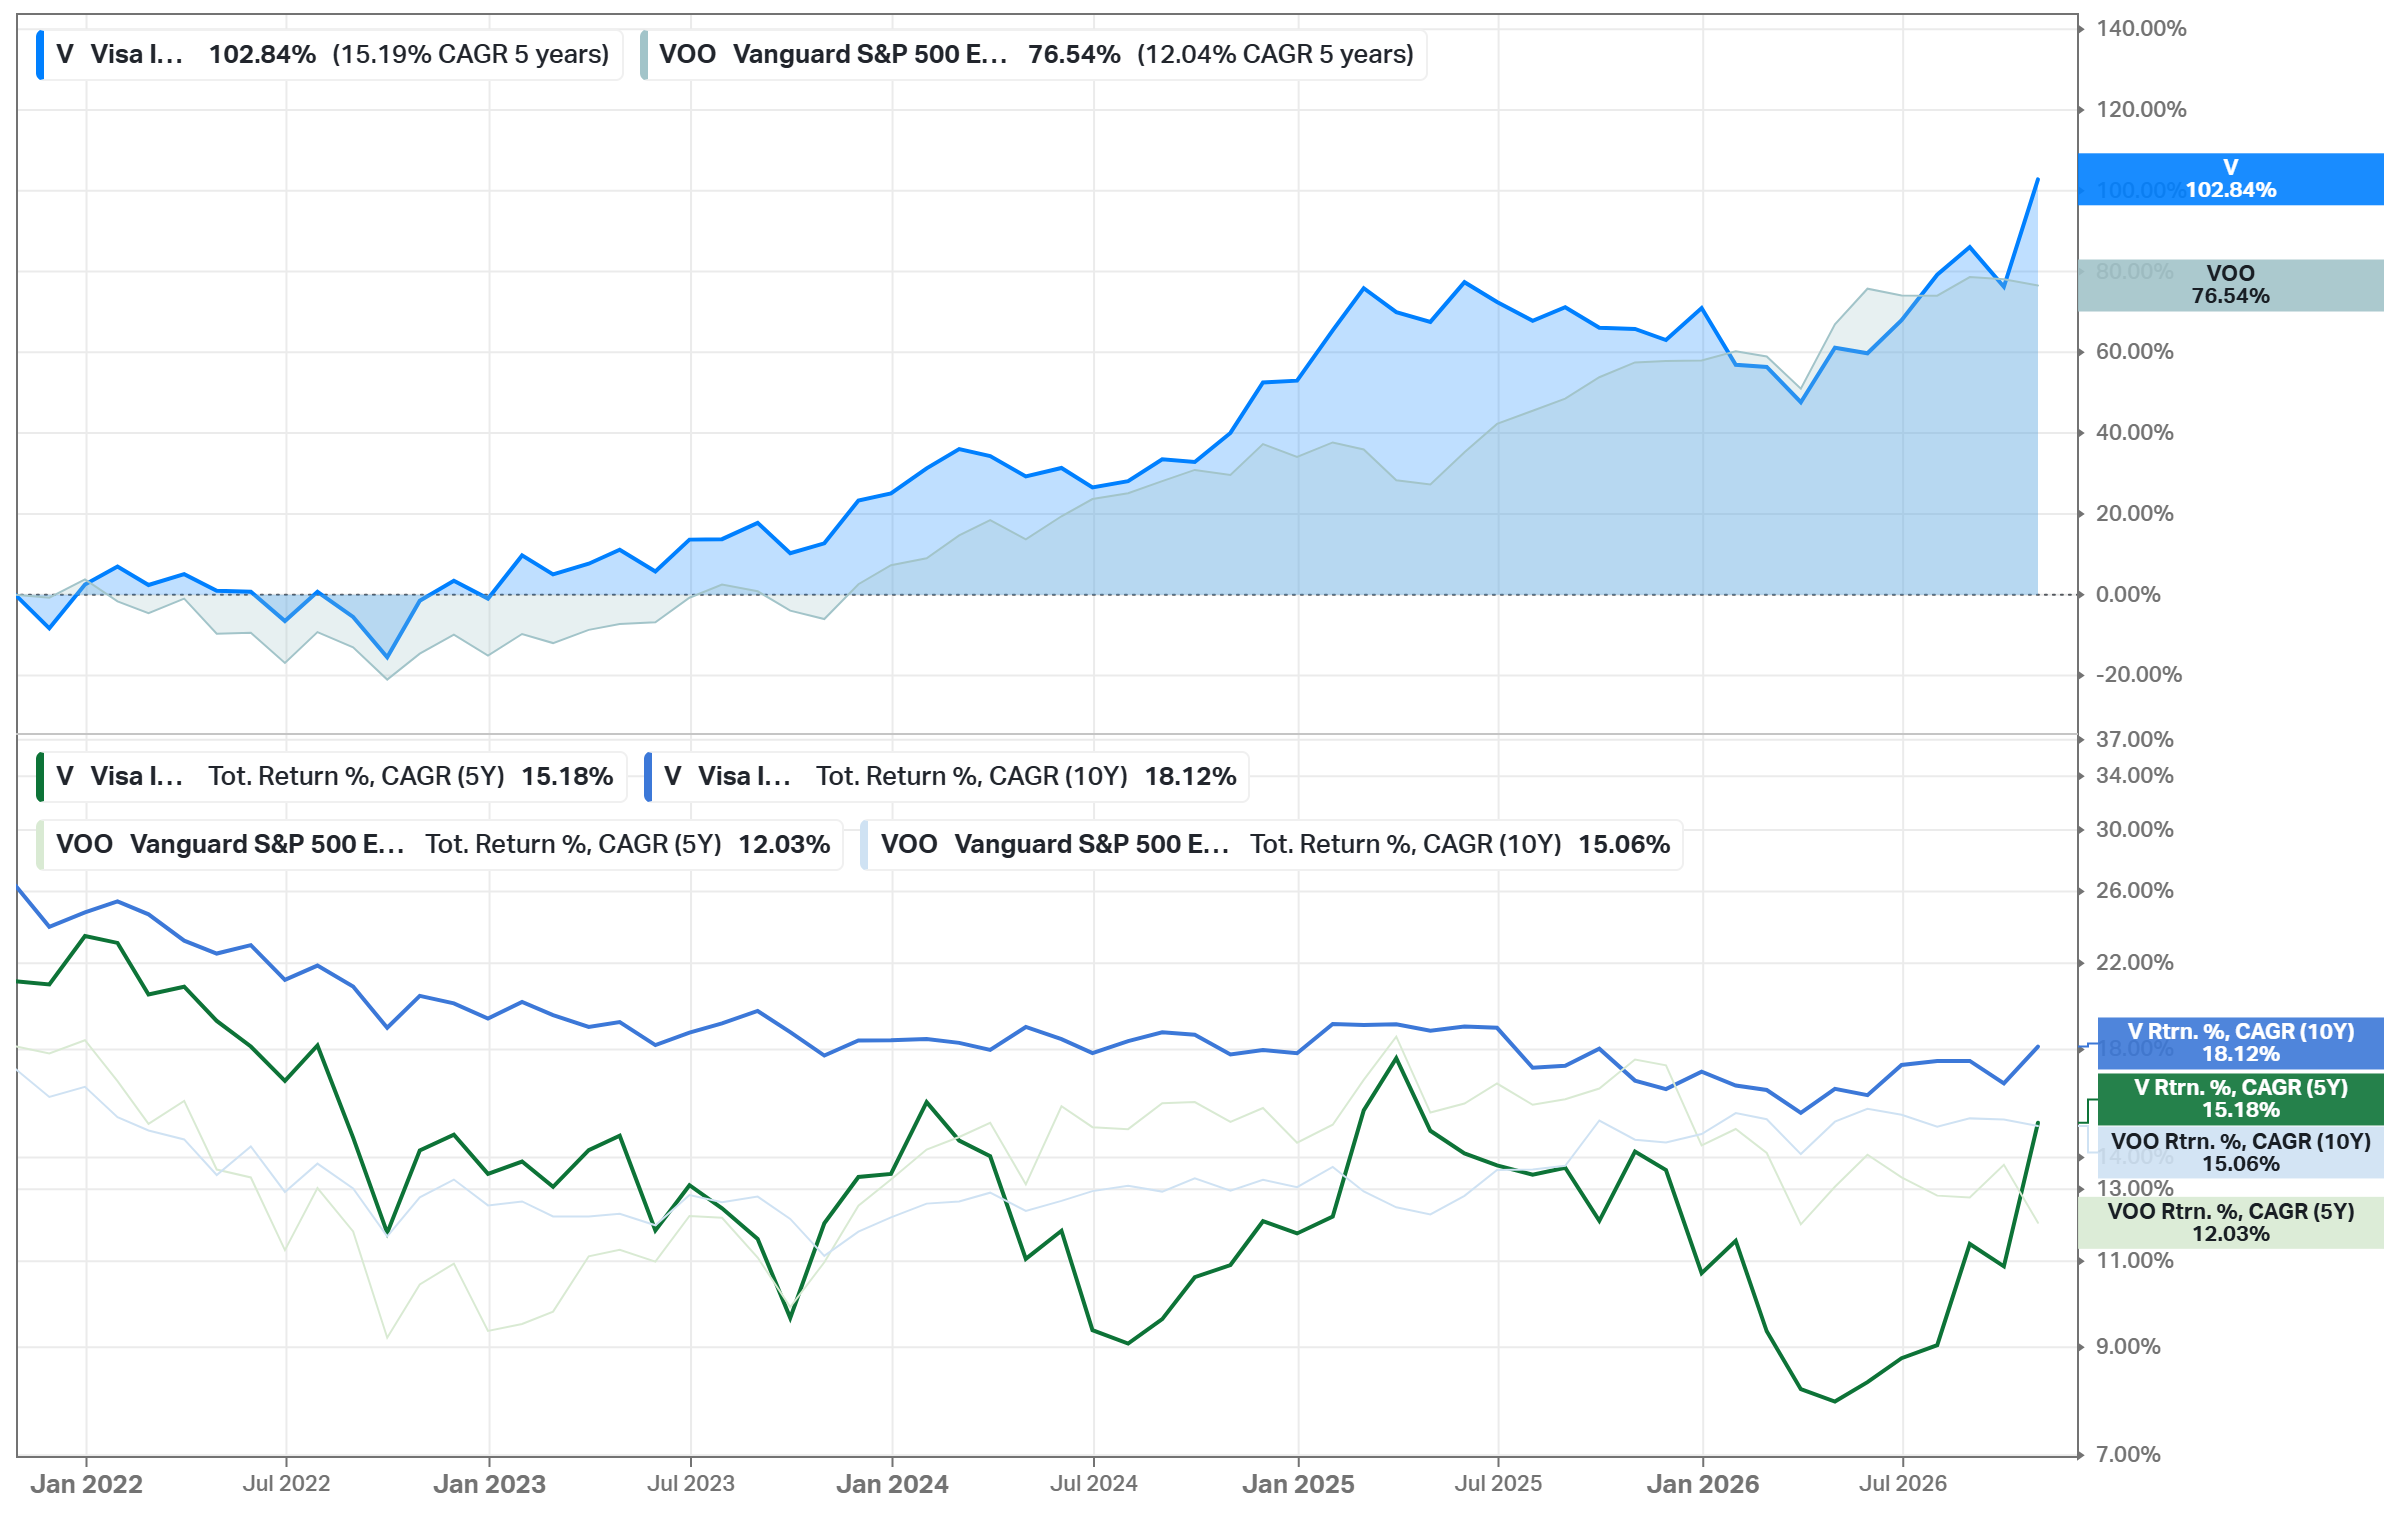
V beat the S&P 500, but less than its EPS growth. Over 5 years, V returned 15.18% per year against 12.03% for VOO, and over 10 years 18.12% against 15.06%. At the same time, non-GAAP EPS grew 17.56% per year over 5 years. In late 2021, V traded at ~30x forward earnings, so the 5Y return lost ~2 points a year to the lower multiple, even with today's 27.5x.
Future

Consensus revenue (S&P Global): FY2027 $51.02B (+11.2%), FY2028 $56.48B (+10.7%), and FY2029 $62.91B (+11.4%), so ~11% per year
Consensus EPS: $15.03 -> $17.13 -> $19.51 (FY2027-FY2029), +13-14% per year; the NTM estimate increased every quarter of 2026
5Y forward EPS growth estimate: 14.01%, against a 15.51% 5Y mean and a 13.41% -1 standard deviation band. It was ~12-13.5% from 2024 to mid-2026, ~14.5% in August, and 14.01% after the report. At ~12.5%, my Base Case would be $429. To compare, non-GAAP EPS grew 17.56% per year in FY2021-FY2026
Analysts (S&P Global): 36 of 40 have a Buy or Strong Buy rating, 3 Hold, and 1 Strong Sell; average target $441.15 (+6.7% from $413.59), range $330-485
Company guidance for FY2027: net revenue growth in the low double digits, with Q2 as the low point; operating expenses growth “modestly below net revenue growth”; EPS growth in the “low double digits to low teens”; a tax rate of ~19%; Q1 EPS growth at the “low end of mid-teens”
What must go right. My model needs EPS to grow ~14% per year, the consensus. It uses 14.76% because it adds the 0.75% dividend yield, and reaches EPS of $29.92 in FY2032. By my estimate, this is possible if net revenue grows ~11% per year, the operating margin stays at ~67%, and the share count decreases ~2.5-3% per year. So the consensus does not need margin expansion, but it needs the FY2027 revenue growth for 5 more years and buybacks at about the FY2026 pace. VAS growing 20%+ and pricing make ~11% realistic.
FY2027 is harder than this average. The non-GAAP tax rate increases from 17.9% to ~19%, and non-operating expense from $141M to $250-300M, “primarily as a result of lower cash balances”. By my estimate, with 11% revenue growth and expenses growing slightly slower, non-GAAP net income grows only ~9-10% in FY2027, and EPS ~12-13% with the buybacks. This is why the EPS guidance is “low double digits to low teens”, and the +13% consensus is at its upper end.
The buybacks are the tighter part. At $414, the FCF yield is 2.9%. After the 0.75% dividend, FCF alone buys back ~2.1% of the shares a year. In FY2026, Visa bought back 3%, but it needed 116% of FCF. With 2.1% a year and 11% revenue growth, EPS grows ~13.4%, slightly below the consensus. Before the litigation payments, FCF would buy back ~2.6% a year, enough for ~14%. And most of these payments came from the escrow, where each deposit already reduced the share count like a buyback. So for class A shareholders, the real pace is closer to 2.6%, and what the consensus needs is that the cost outside the escrow stays small - the Justice Department case and the US debit class actions.
The part I trust least is incentives. If gross revenue slows to ~10% and incentives grow 3-4 points faster (in FY2026 they grew ~1 point faster than gross revenue, in Q4 ~6 points faster), net revenue growth falls to ~8-9%, and EPS growth to ~10-11%, by my estimate.
For me, the next two reports are the test. Q1 FY2027 (late January) shows the first renewals and incentives growth, and Visa says Q2 is the low point of growth. The Zacks consensus already expects Q2 EPS of $3.63, ~10% above the $3.31 of Q2 FY2026, and in the last 4 weeks, 5 analysts cut their Q2 estimate and 2 raised it. Net revenue growth of ~11% with incentives growing less than 20% is a pass. Growth below 10% in Q2 with incentives above 20% is a warning, since then the consensus is too high. The other checkpoints are the pricing in the second half, international transaction revenue against cross-border volume, the Fed’s new debit cap, the settlement approval, and the Justice Department case.
Current Valuation
Current vs 5Y mean:
Price/Fwd Earnings: 27.5x vs 26.6x
Price/Fwd Sales: 15.1x vs 13.8x
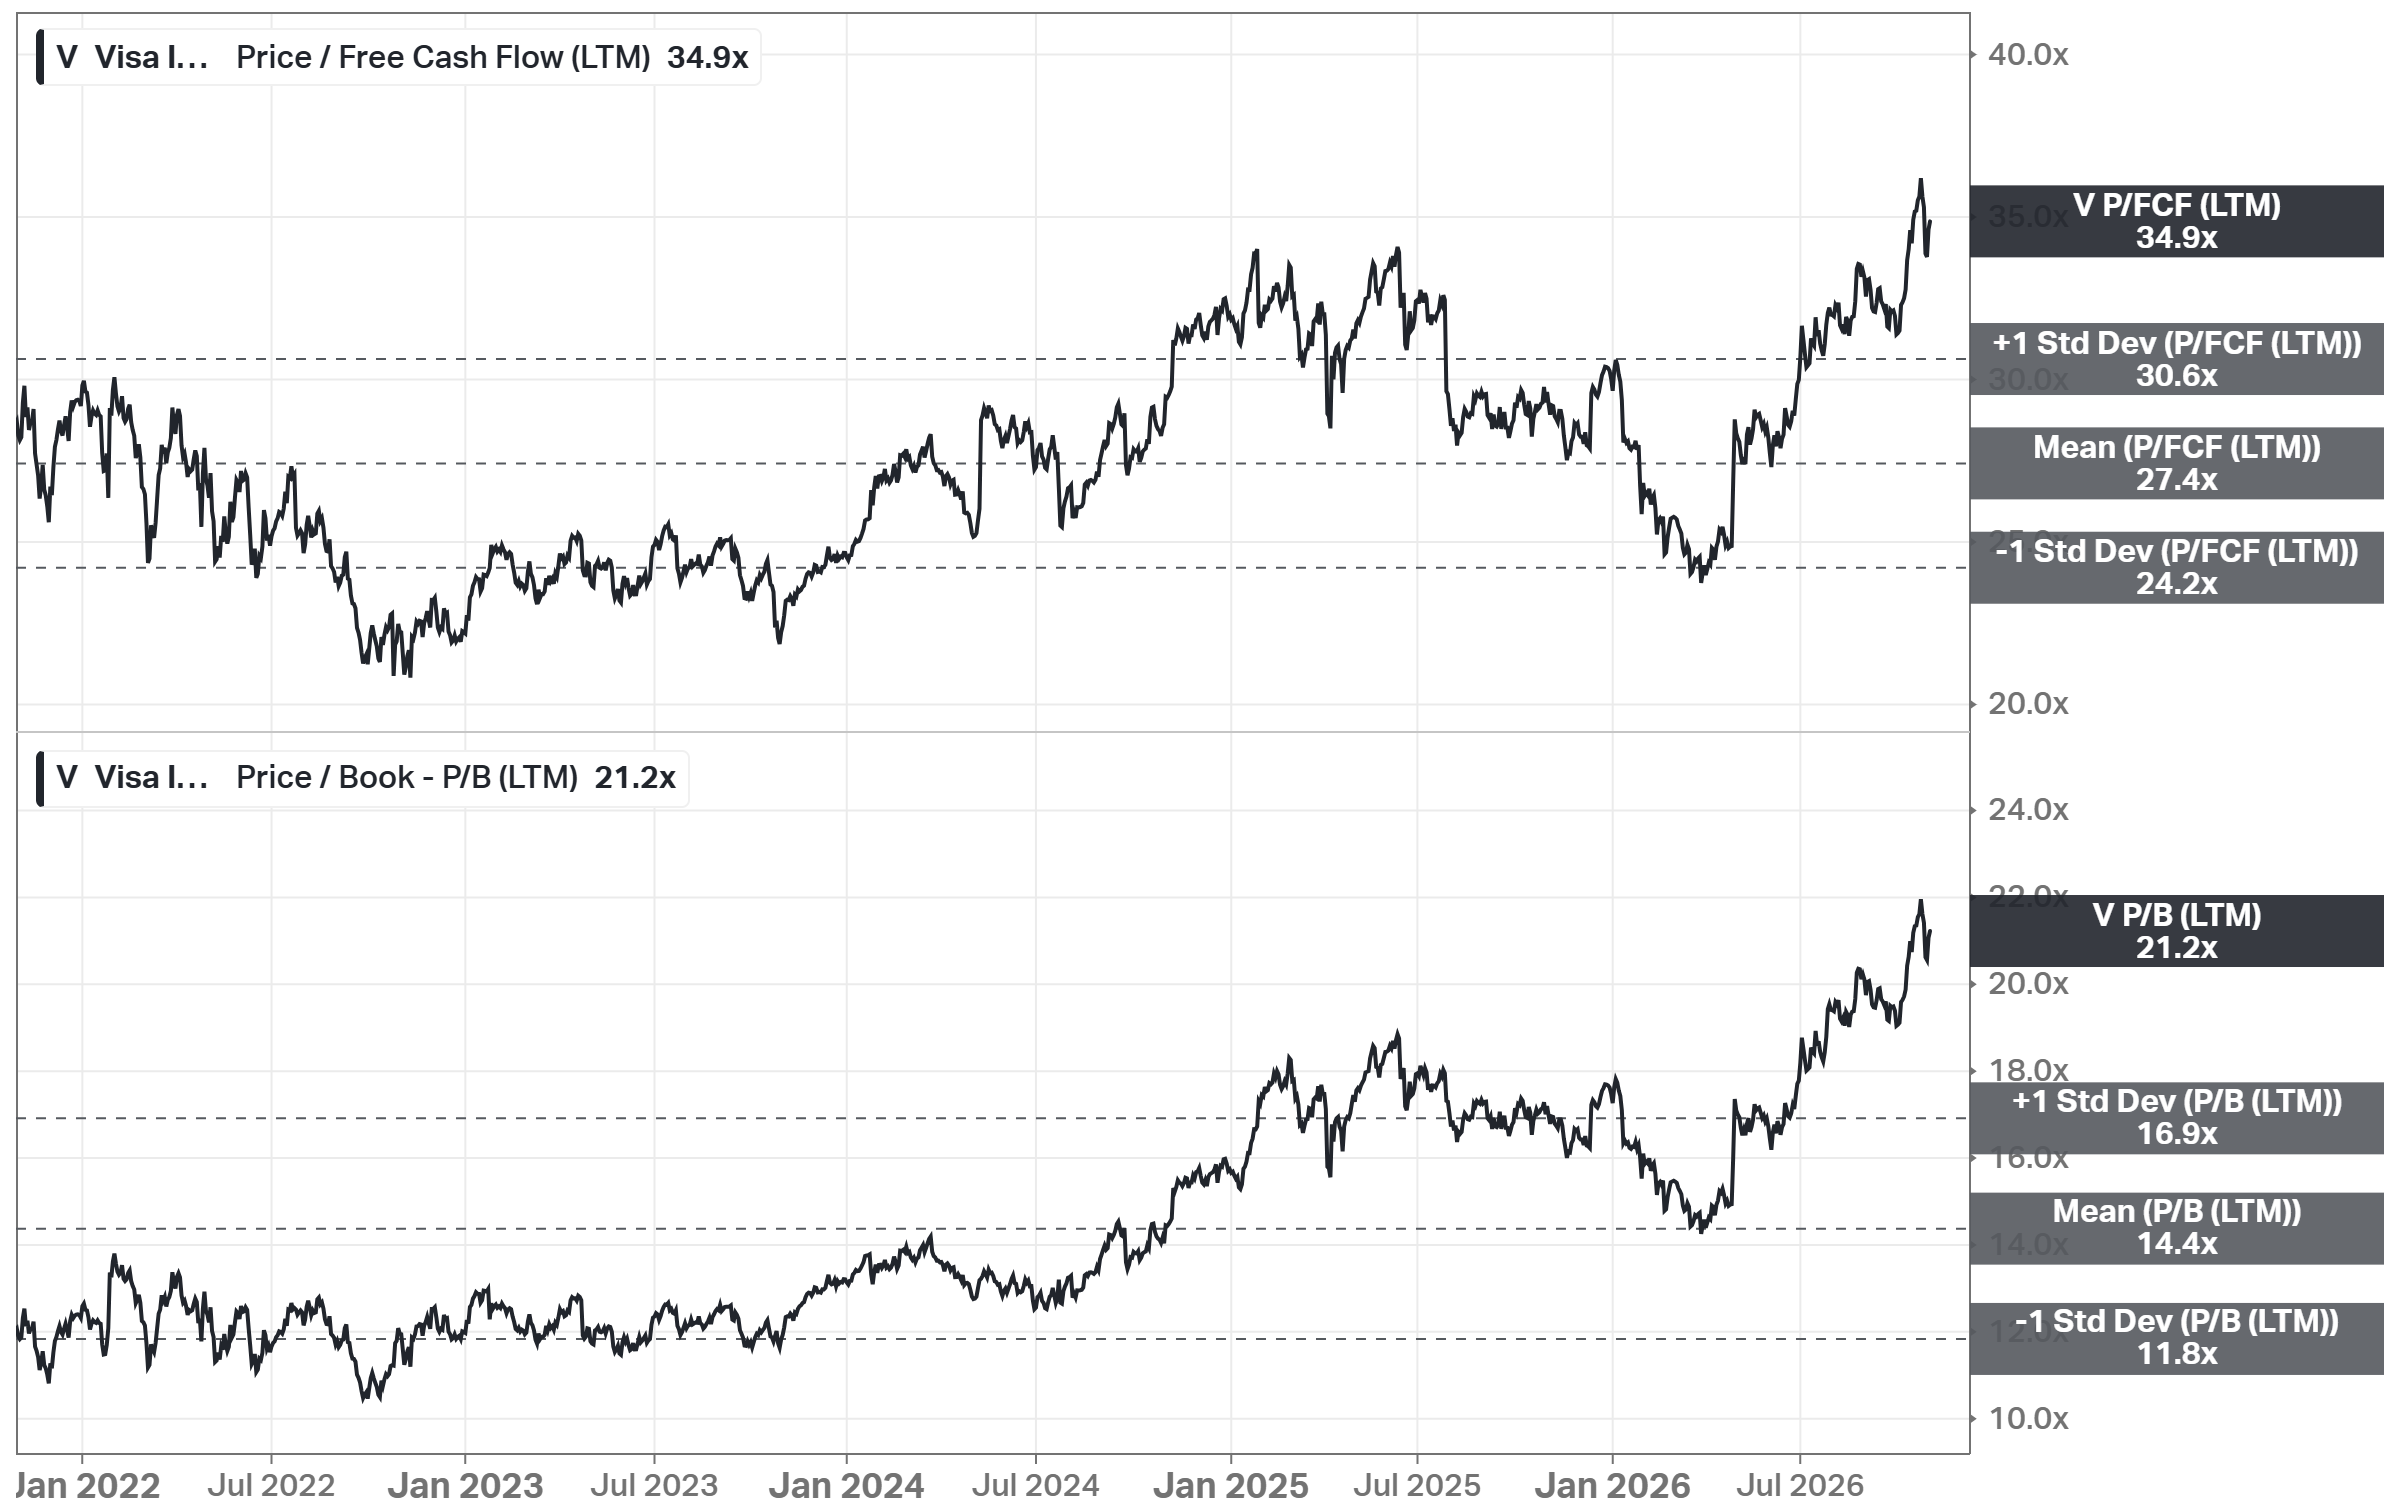
Price/FCF: 34.9x vs 27.4x
Price/Book: 21.2x vs 14.4x
PEG: 1.96 vs 1.87
Forward Earnings Yield: 3.6% (FY2027 EPS)
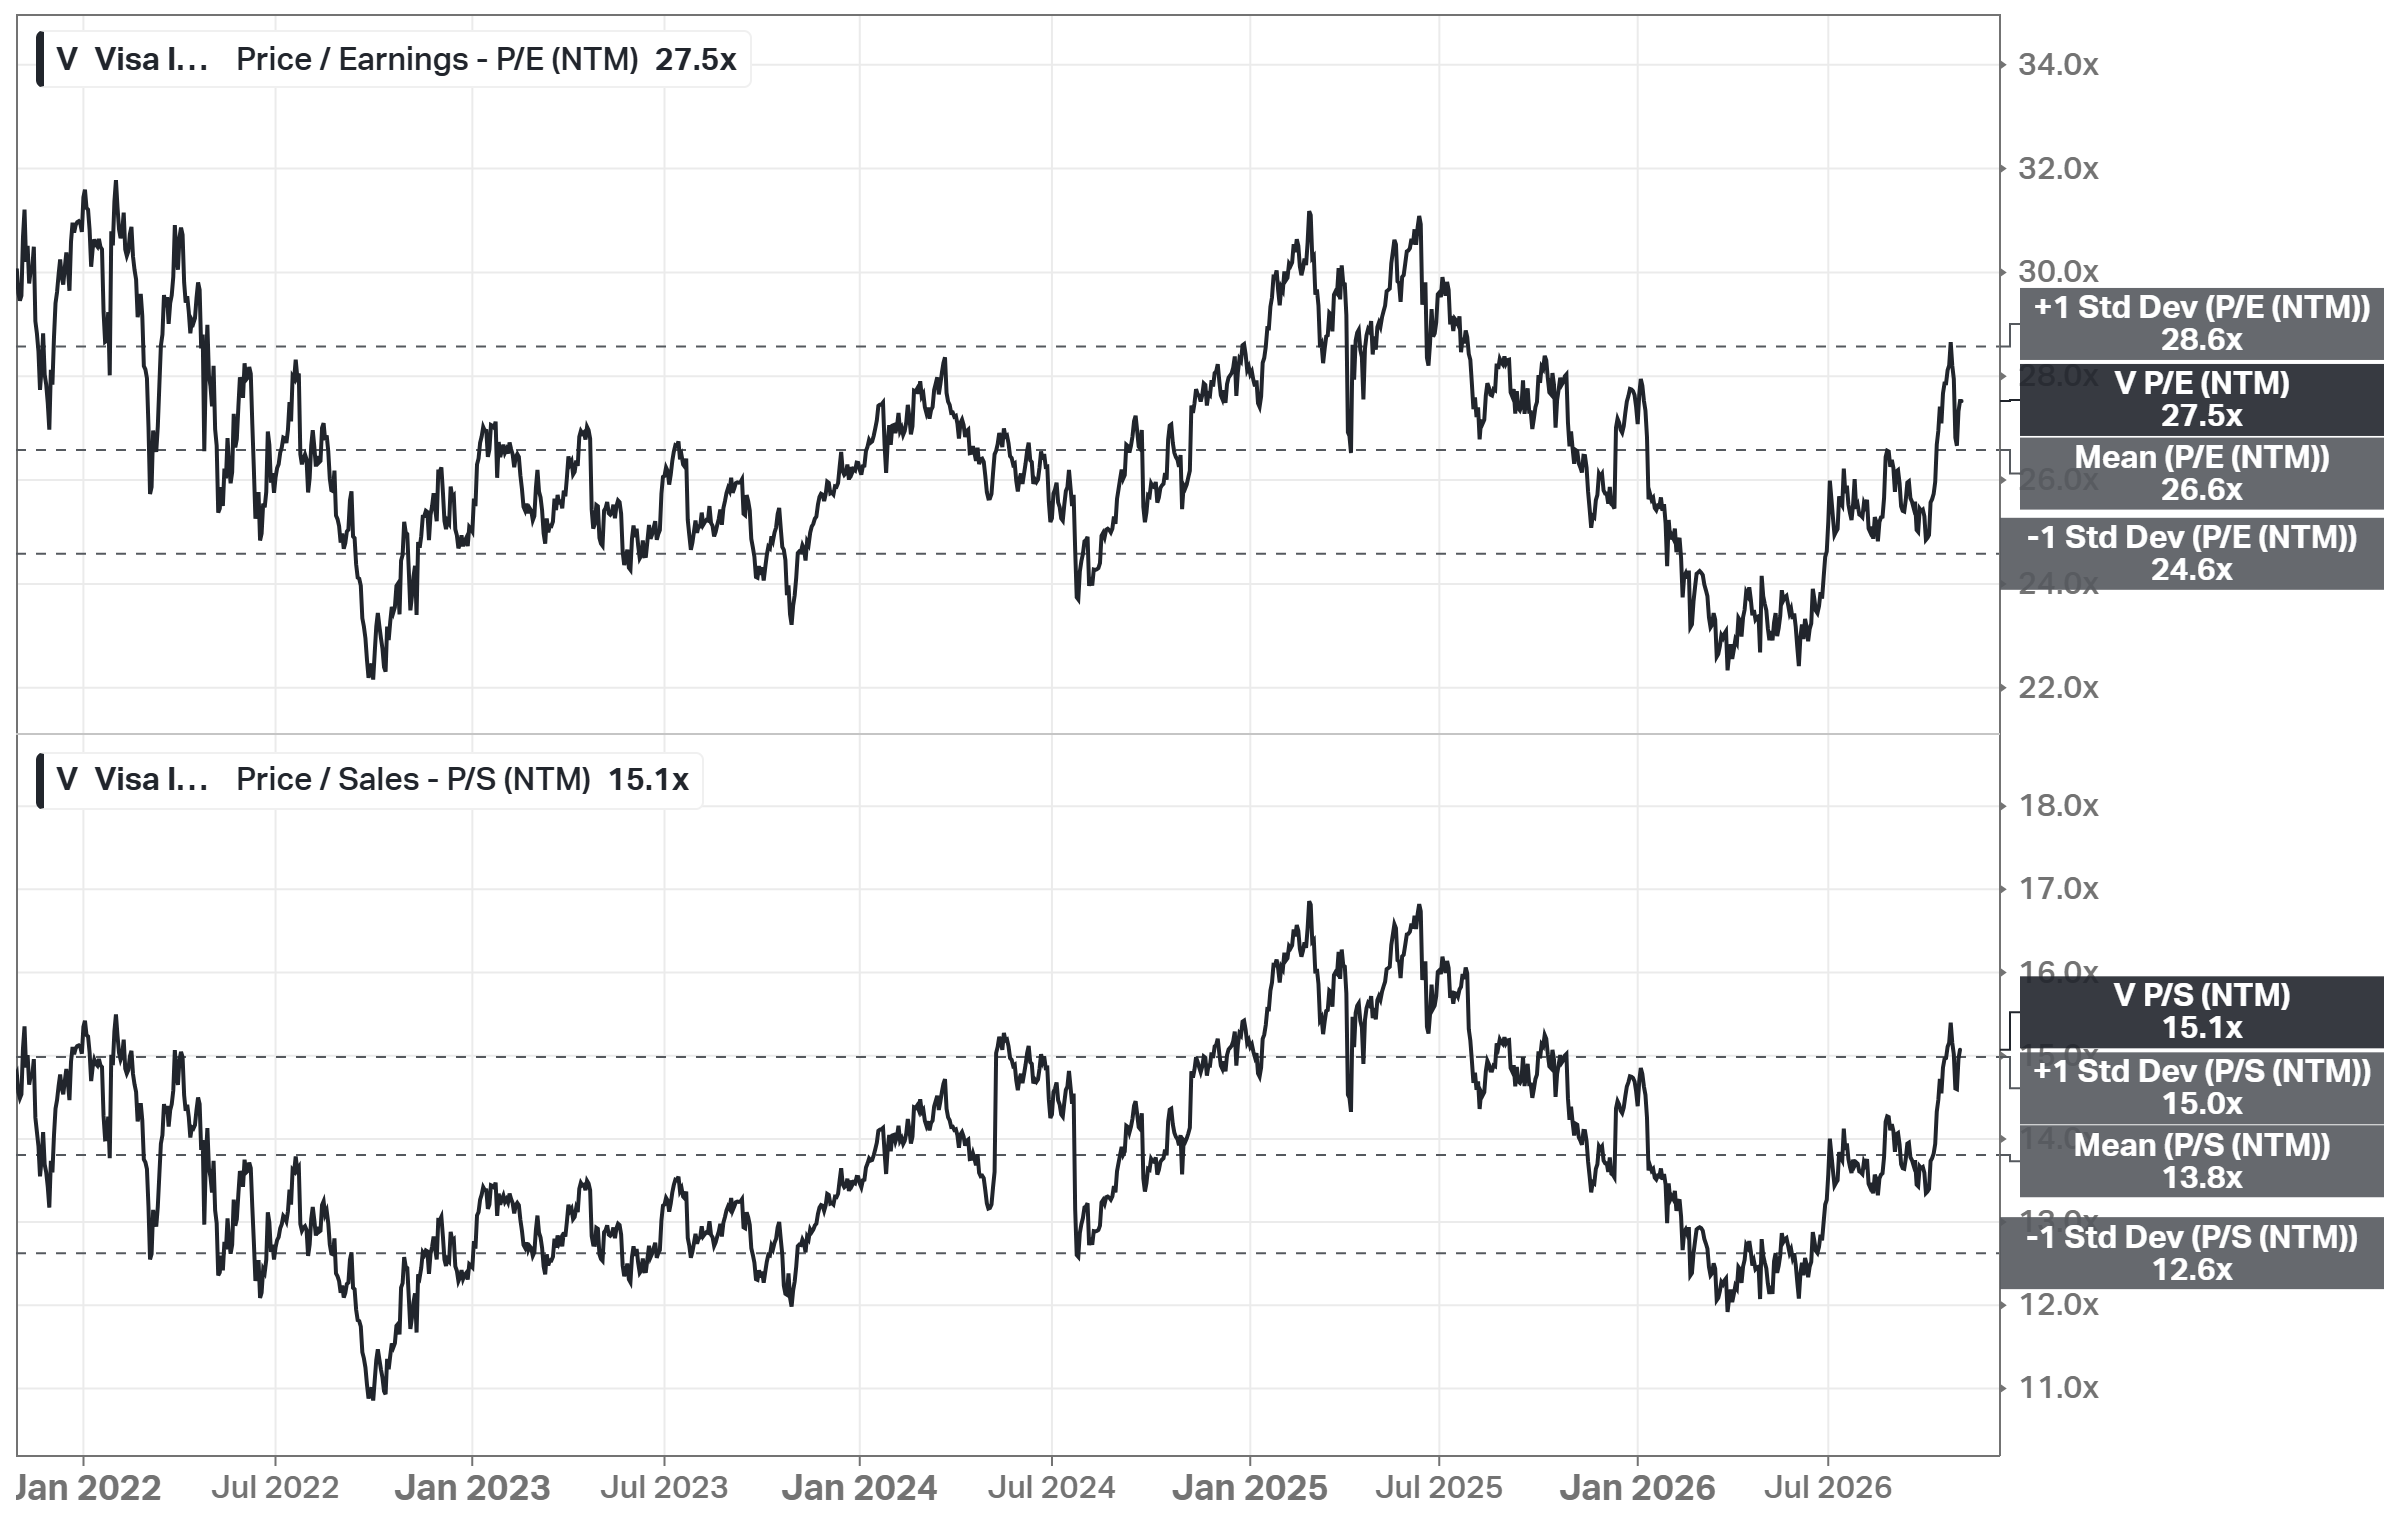
On earnings, V is between its mean and its +1 standard deviation band. The forward P/E is 27.5x, against a 26.6x mean, a 28.6x +1 standard deviation band, and a 24.6x -1 standard deviation band. The range of the last 5 years was ~22-32x: the lows were in October 2022 and in March-June 2026, and the highs in early 2022 and in 2025. P/S is 15.1x, just above its +1 standard deviation band (15.0x). The forward earnings yield is 3.6%, and on FY2028 consensus EPS, the P/E is 24.1x.
Analyst’s note:
Two of the multiples look more expensive than they are. P/FCF (34.9x against a 27.4x mean) uses FY2026 FCF after ~$3.8B of litigation payments; on the NTM FCF estimate, it is 27.9x against a 24.5x mean, still above it. P/B (21.2x against 14.4x) increased mostly because buybacks reduce equity, so for Visa it says little about valuation. I use the forward P/E and the PEG for the model.
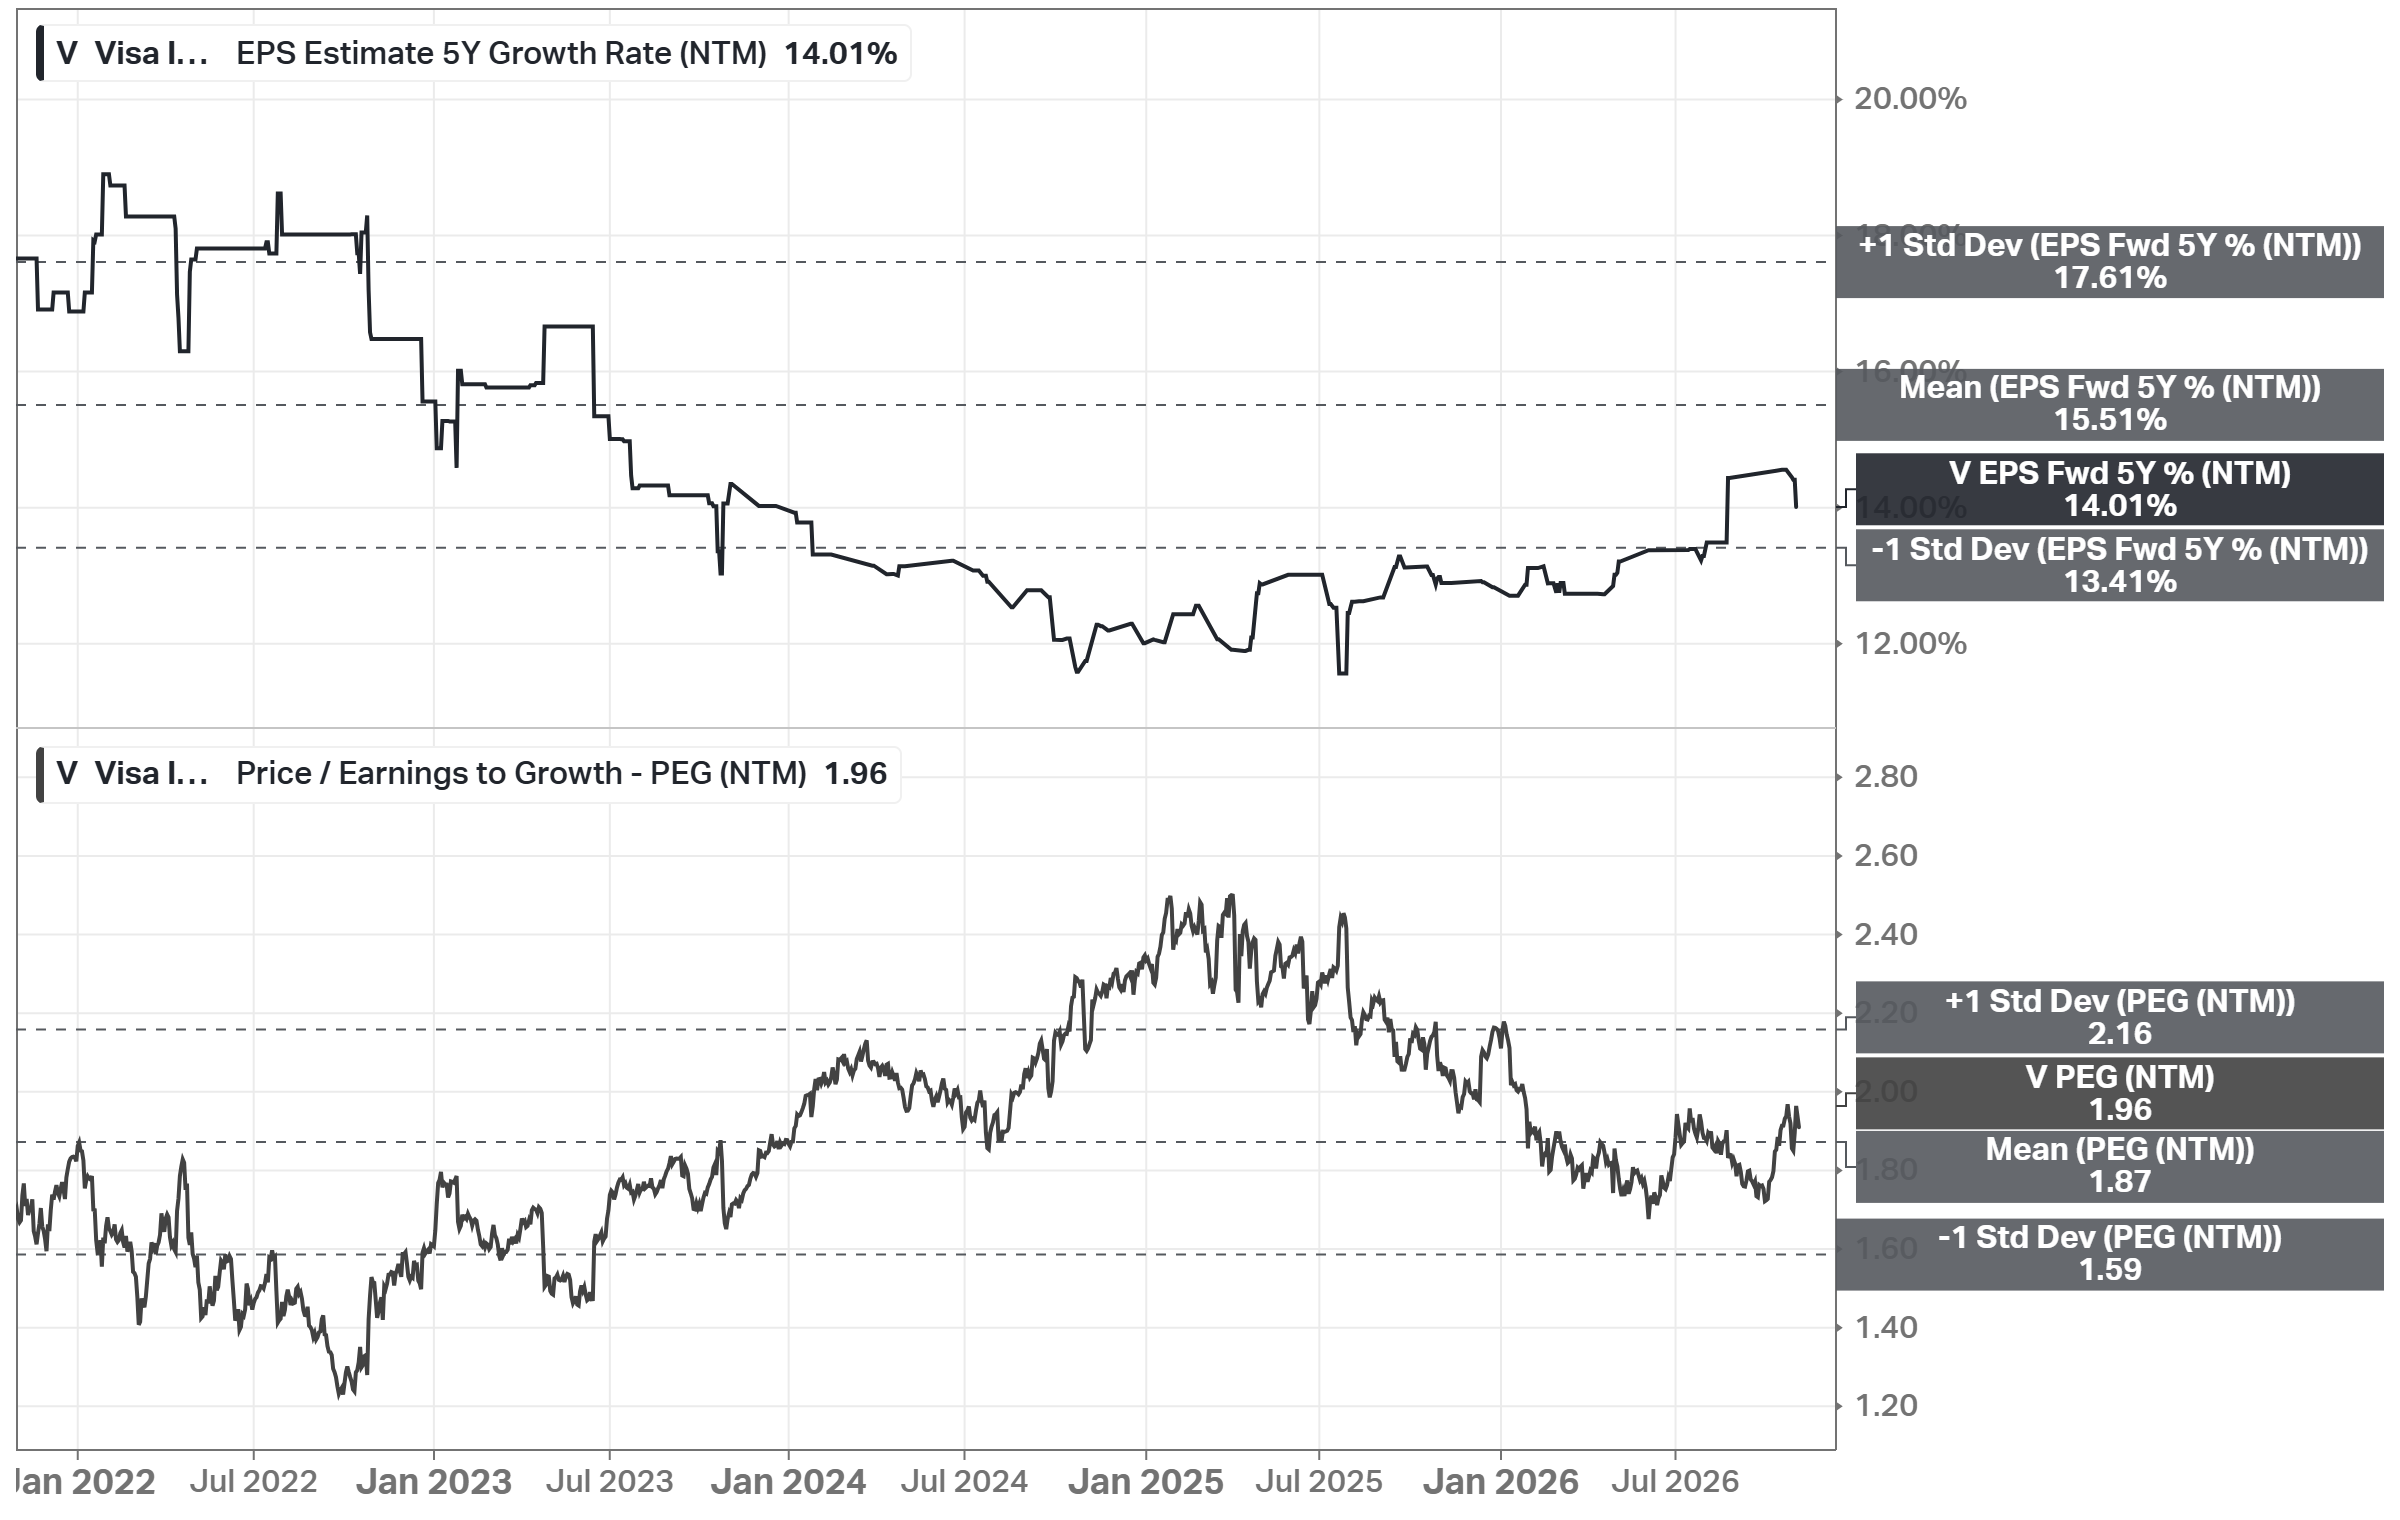
The growth estimate decreased more than the multiple. The 5Y EPS growth estimate is 14.01%, against ~18% in early 2022 and a 15.51% mean. The PEG ratio is 1.96, above its 1.87 mean. So the market pays more per point of growth than on average in the last 5 years, while Visa grows more slowly than it did. To compare, in October 2022 the PEG was ~1.2-1.3, and in March 2026 ~1.7.
What does $414 already assume? If the forward multiple stays at 27.5x, V returns its EPS growth plus the 0.75% dividend. For a 12% return per year (the discount rate of my model), Visa then needs ~11% EPS growth per year, the low end of the FY2027 guidance. If the multiple returns to ~24x (the -1 standard deviation band, rounded down) in 5 years, Visa needs ~14.4% growth, about the full consensus. If it falls to ~22x, where it was in October 2022 and in March 2026, it needs ~16.4%, more than the consensus and close to the 17.6% of FY2021-FY2026, which included the post-pandemic recovery. So the price leaves room for one of the two to disappoint, not for both, and only a little - the multiple can fall to ~24x, but not to the ~22x of 2022 and March 2026. A return to 22x alone gives ~$373, 10% below today’s price, even with the consensus growth.
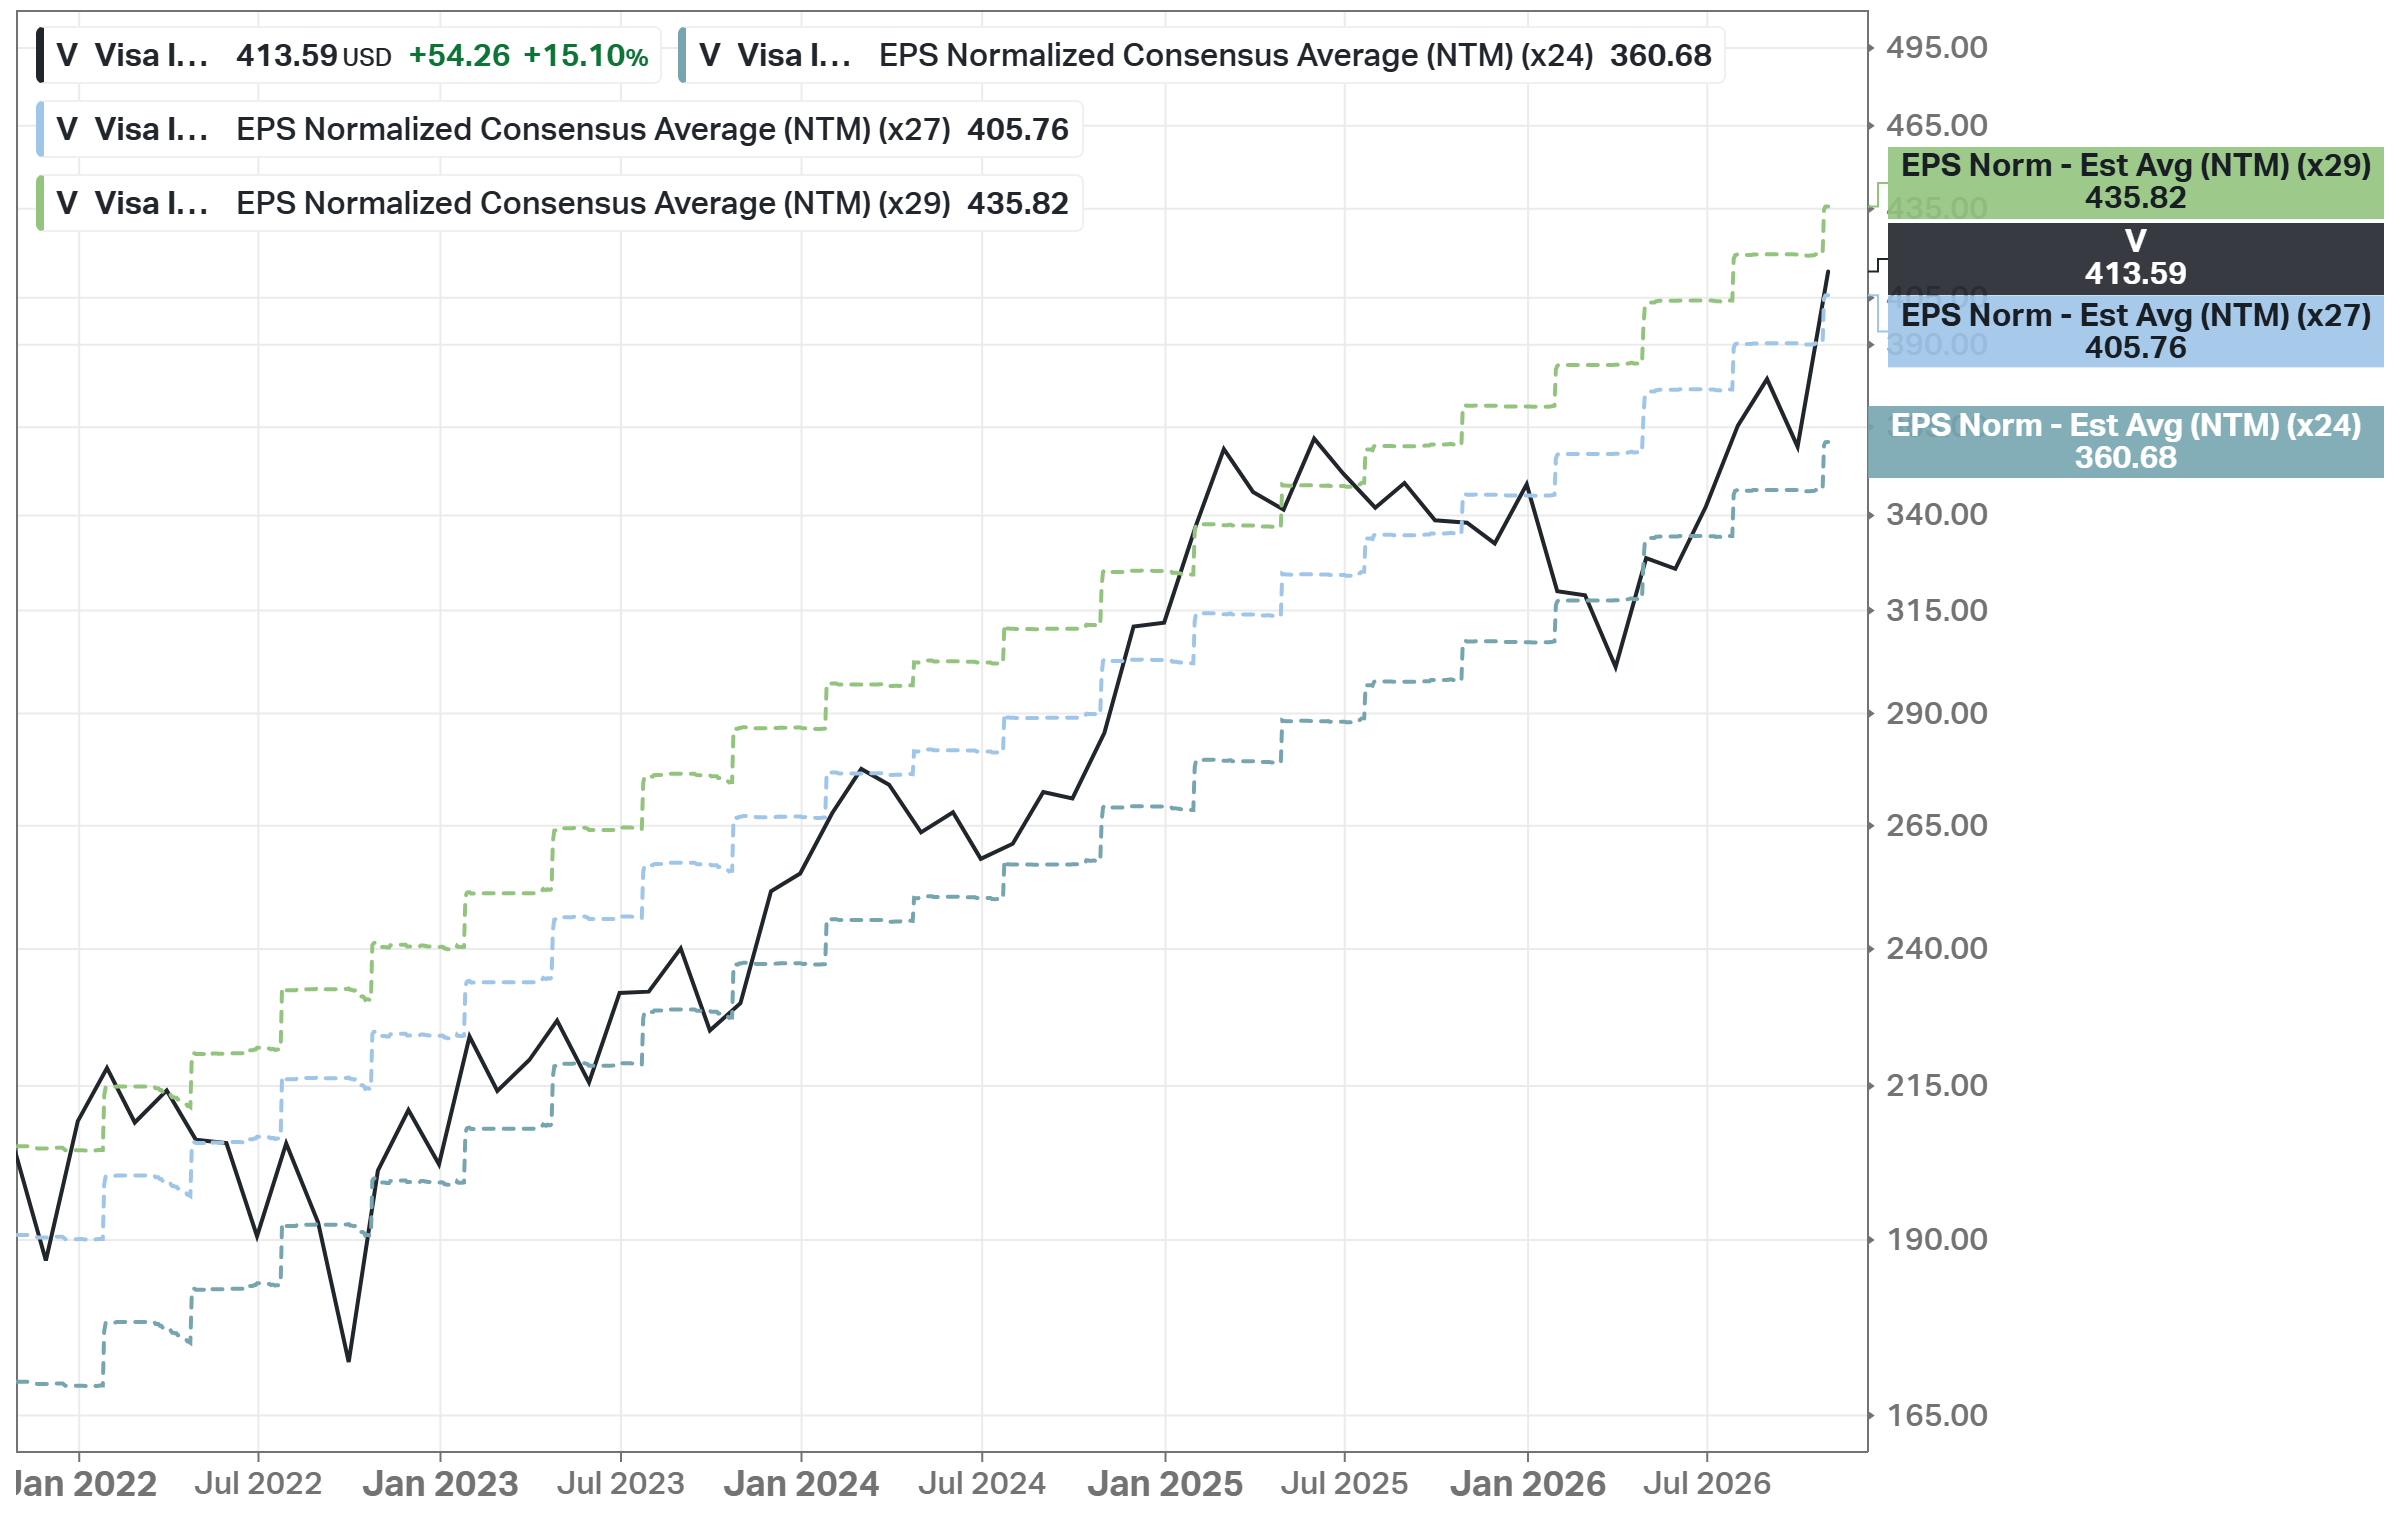
One chart frames this whole section. It shows the consensus forward EPS times my exit multiples (24x, 27x, and 29x) against the V price. At $414, V is above the 27x line ($406) and below the 29x line ($436). The lines use today’s NTM EPS, so the 24x line ($361) is not my Bear Case fair price ($407), which uses EPS in FY2032 discounted at 12%. In the last 5 years, V was above the 27x line for long periods in early 2022 and from late 2024 to mid-2025, and both times the next 12 months brought a lower multiple.
Fair Price
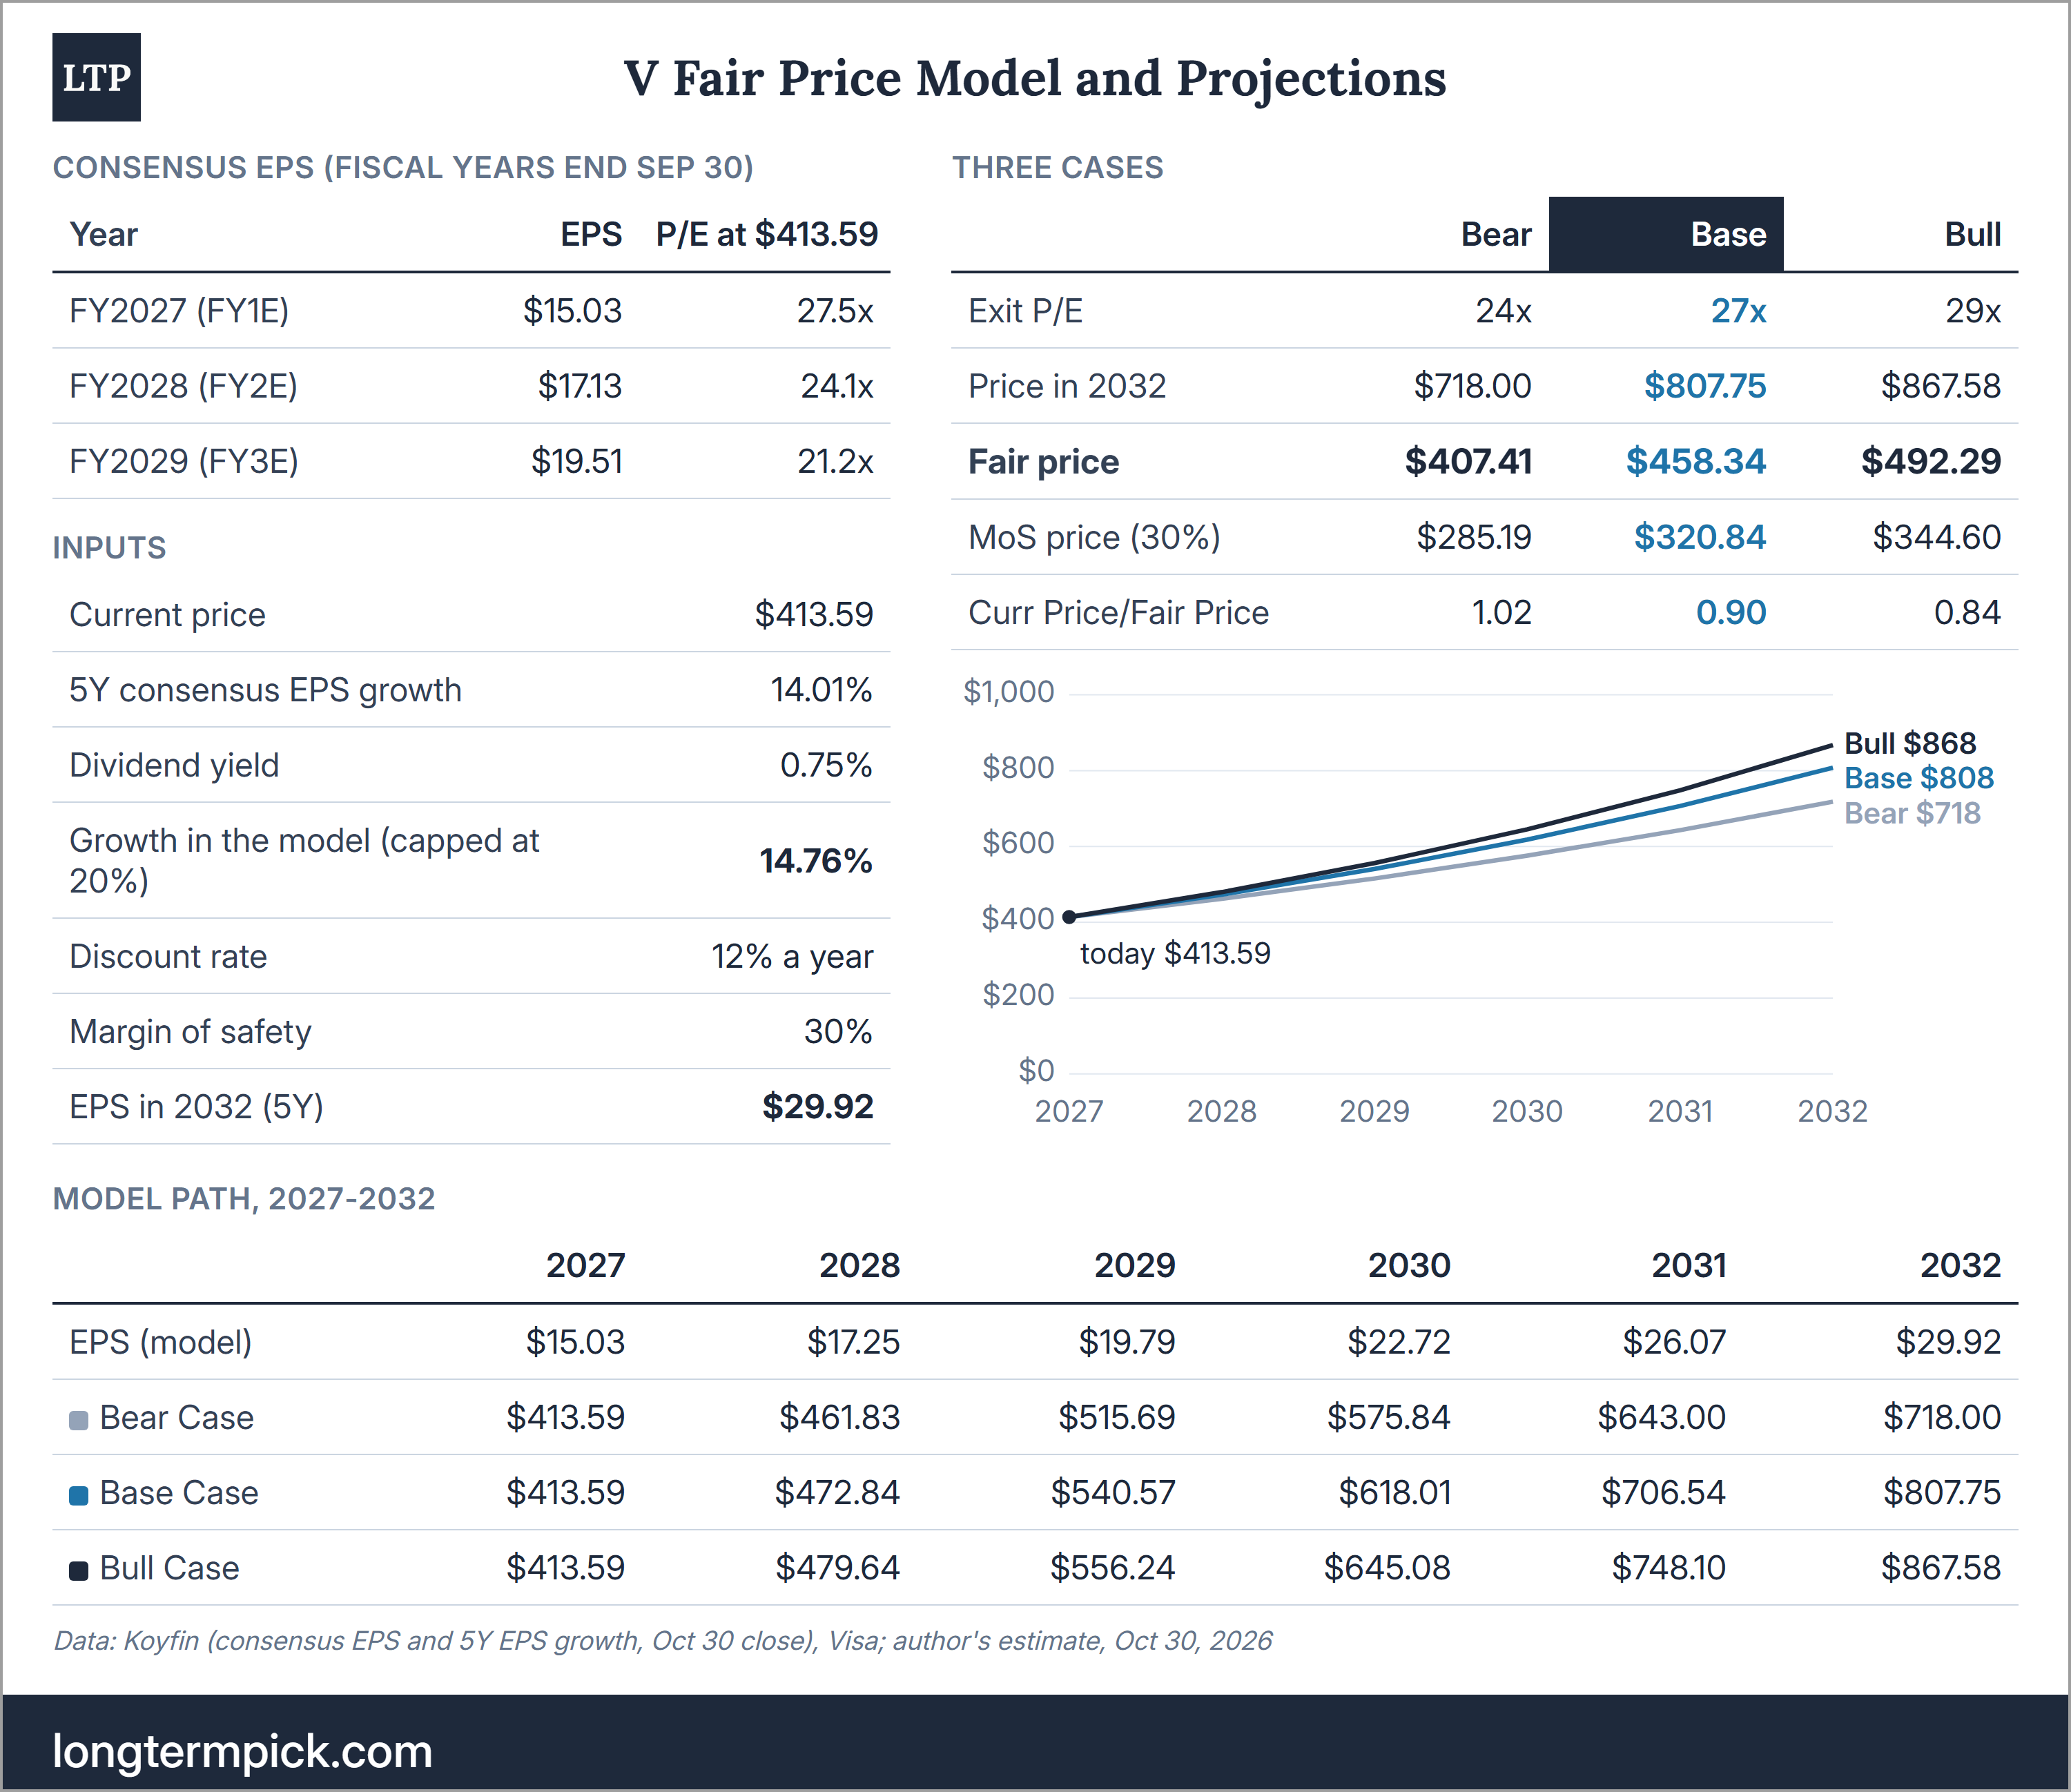
My model grows EPS for 5 years at the consensus rate. Consensus can be too optimistic, and my model takes this into account by capping future growth at 20%. For Visa, the cap does not matter. The 5Y EPS growth estimate is 14.01%, plus a 0.75% dividend yield, so the model uses 14.76%. The starting point is the FY2027 consensus of $15.03, and in FY2032 it becomes $29.92. In FY2028 and FY2029, my path ($17.25 and $19.79) is 1% above the consensus.
The discount rate is 12%; the margin of safety is 30%. The exit multiples are 24x, 27x, and 29x. 24x is the -1 standard deviation band (24.6x) rounded down, so the Bear Case assumes that V trades at the low end of its usual 5Y range. It is below today’s 27.5x, so this case includes some derating. I round the Bear Case down, not to the nearest multiple, because V traded at ~22x twice in the last 5 years. At 25x, the Bear Case would be $424, and V would be inside the zone. 27x is the 5Y mean (26.6x) and 29x the +1 standard deviation band (28.6x), both rounded to the nearest whole multiple; 29x is below the 30x ceiling of my rules. Worth noting that the mean includes 2022, when the growth estimate was ~18%. At the mean PEG of 1.87 and today’s 14.01%, the multiple is 26.2x, and at 26x the Base Case is $441. So in my view, 27x is slightly generous for today’s growth, and V is closer to its fair price than the 10% gap suggests.
Bear Case (exit P/E 24x): fair price $407 - MoS price $285
Base Case (exit P/E 27x): fair price $458 - MoS price $321
Bull Case (exit P/E 29x): fair price $492 - MoS price $345
Analyst’s note:
Portfolio #004 used the same multiples and the same FY2027 EPS, but a 14.41% growth estimate, read from Koyfin on Oct 30. In the export for this analysis (Nov 01, the same Oct 30 close), the estimate is 14.01% after the post-report revisions, so the Base Case is $458, ~$8 lower. In the Portfolio and Watchlist series, I start buying at a 30% discount to my Base Case, so the buy zone is up to $321 for V now. In this analysis, the accumulation zone is the range from the Bear Case MoS price to the Bear Case fair price, $285-407. Both numbers come from the same model.
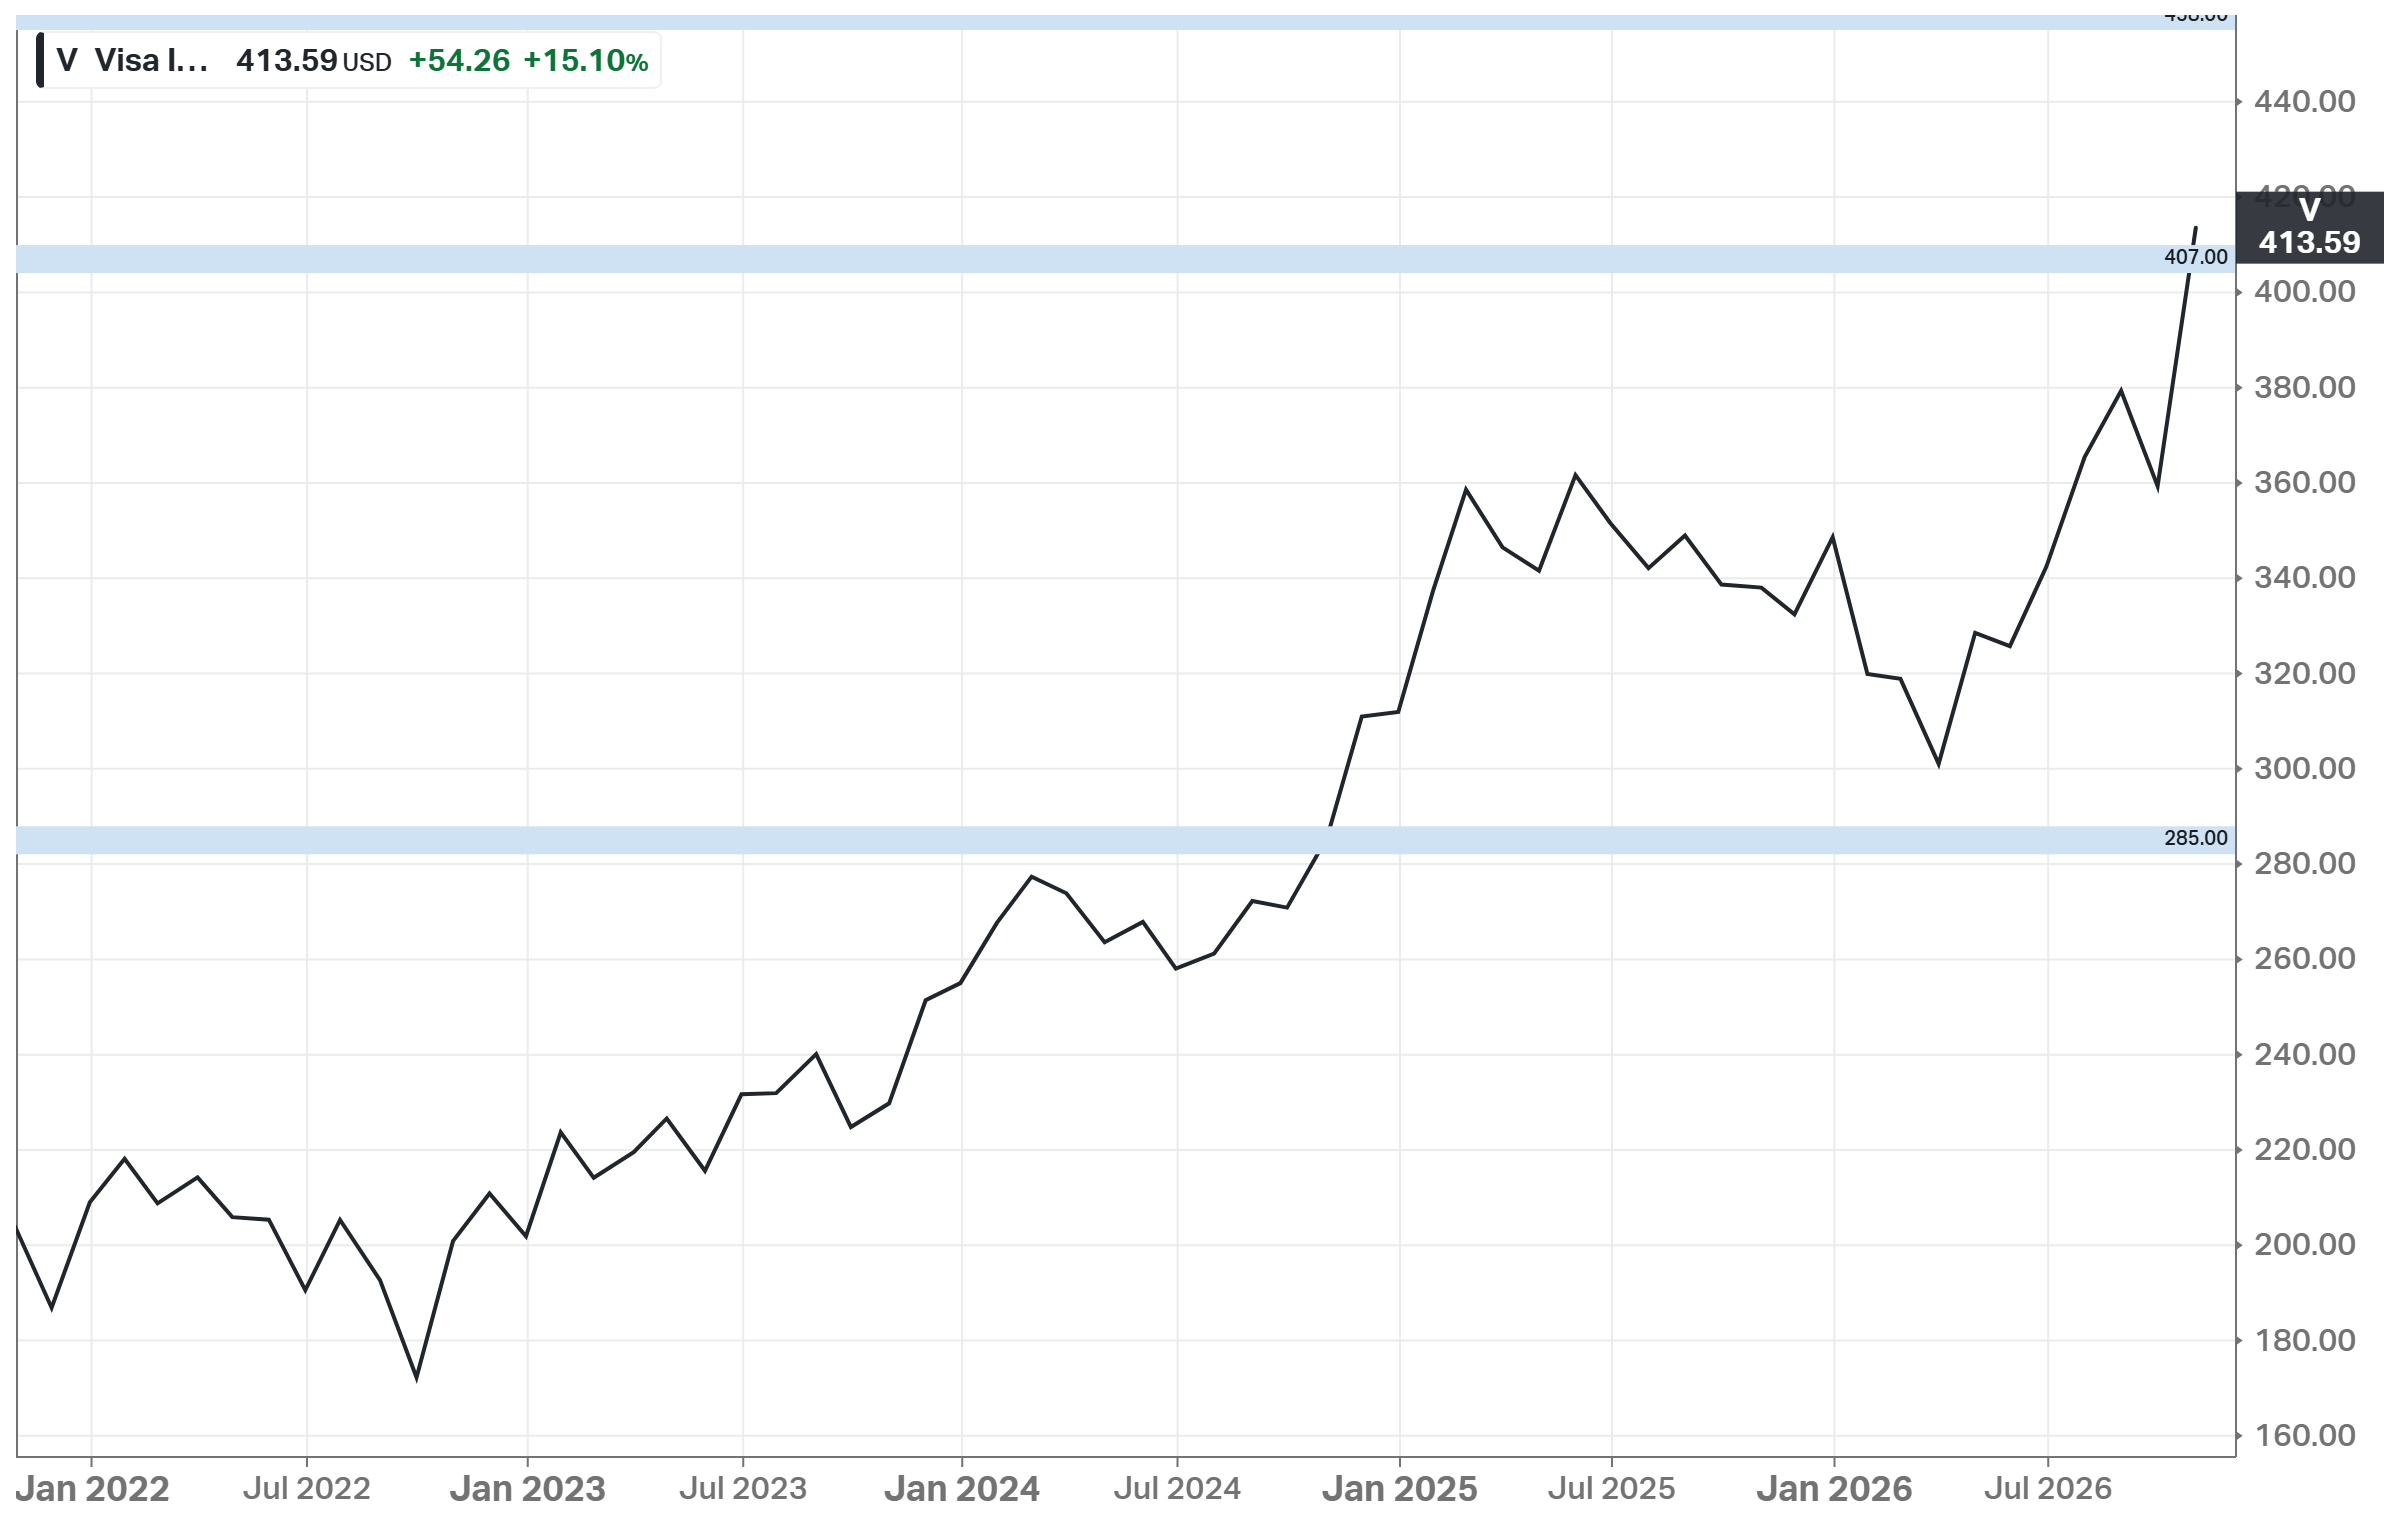
Analyst’s note:
The chart shows the accumulation zone ($285-407), and the Base Case fair price ($458) is the line at the top edge. The Bull Case fair price of $492 is above the scale of the chart.
At $414, V is 1.5% above the Bear Case fair price and 10% below the Base Case. The accumulation zone is $285-407, so V is just above it. The result depends most on growth. If EPS grows ~11% per year plus the dividend, at the pace of the low end of the guidance, the fair prices are $357/$401/$431, and today’s price is slightly above the Base Case. At ~10% EPS growth, the Base Case is $384. If the multiple falls to 22x at the consensus growth, the fair price is $373.
As I see it, the zone has two parts. From $357 to $407, the price covers a lower multiple (24x) if EPS grows at the consensus rate. Below $357, it also covers slower growth, because the Bear Case at ~11% EPS growth is $357.
Due Diligence
Profitability (12 of 15):
Positive Gross Profit: $44.84B
Positive Operating Income: $28.11B
Positive Net Income: $23.50B
Positive FCF: $22.06B
Gross margin >= 40%: Yes (97.68%)
Net margin >= 10%: Yes (51.20%)
FCF margin >= 10%: Yes (48.05%)
Management (ROIC, ROE, ROA) >= 10%: Yes (44.10%/63.51%/19.61%)
Strong 3Y Revenue Growth: No (12.0% per year, FY2023-FY2026)
Revenue Growth Forecast: No (~11% per year, FY2027-FY2029)
ROE is increasing: ~34% at the start of 2022 -> 63.51%
ROIC is increasing: ~21% at the start of 2022 -> 44.10%
Revenue surprises in the last 5Y in a row: No (miss in Q3 FY2024)
EPS surprises in the last 5Y in a row: Yes (20 of 20)
EPS growth YoY 5Y in a row: Yes (FY2022-FY2026)
Financial Strength (3 of 6):
Total assets ($94.36B) exceed total liabilities ($58.25B) by 1.6x
Negative Net Debt: No ($7.89B of net debt)
Low Debt/Equity: No (61.1%; 5Y mean: 58.4%)
Debt/Capital: No (37.93%; 5Y mean: 36.79%)
Interest coverage (FFO): 31.3x (5Y mean: 33.6x)
Piotroski F-Score: 8 of 9 (FY2026; not passed: higher current ratio)
Valuation and Advantage (2 of 4):
Valuation < 5Y mean: No (P/E 27.5x vs 26.6x)
Valuation < the industry: No (P/E 27.5x vs 15.0x for XLF; AXP, PYPL, FISV and XYZ are cheaper)
Does it have a moat: Yes (wide)
Outperformed the S&P 500 over 5Y: Yes (15.18% vs 12.03% CAGR)
Shares (1 of 3):
Insider ownership >= 5%: No (0.125%, including options)
Fewer shares outstanding YoY: Yes (Q4: 1,882M vs 1,945M diluted)
Insider buys in the last 6M: No (only sales)
Price (2 of 4):
1Y price forecast > 10%: No (+6.7%)
Next 5Y EPS growth estimate (CAGR) > 10%: Yes (14.01%)
DCF Value: ~$352 (base case: revenue growth 9.7% - below consensus, 8.8% discount rate); overvalued by ~15%
Short Interest < 5%: Yes (1.10%)
Verdict
In my view, Visa is one of the best businesses in the market and fits a long-term portfolio, and I hold it in mine. Visa earns a 67.5% non-GAAP operating margin and a 44% ROIC, takes no credit risk, and returned 116% of its FCF to shareholders in FY2026. At the same time, V trades at 27.5x forward earnings, above its 26.6x 5Y mean, with PEG of 1.96, after a 40% rally since March, and ~60% of that rally came from the multiple. Consensus expects ~14% EPS growth per year, and the price needs ~11% if the multiple holds and ~14% if it returns to its -1 standard deviation band. My model gives fair prices of $407/$458/$492, so V is 1.5% above the $285-407 accumulation zone and 10% below the Base Case. The realistic downside is a costly renewal year, more regulatory pressure on interchange and debit, and a multiple back at 22-24x, as in 2022 and in early 2026. With the consensus growth, the fair price is then ~$373-407; if EPS growth also slows to ~11%, it is ~$327-357. For me, this is a stock to hold, not to add to. Only below ~$357 does the price cover both a 24x multiple and EPS growth of ~11%. The things to watch are net revenue growth and incentives in Q1 and Q2 FY2027, the renewals with large clients, the gap between international transaction revenue and cross-border volume, the Fed’s new debit cap, the final approval of the merchant settlement, and the Justice Department case.
One-Pager
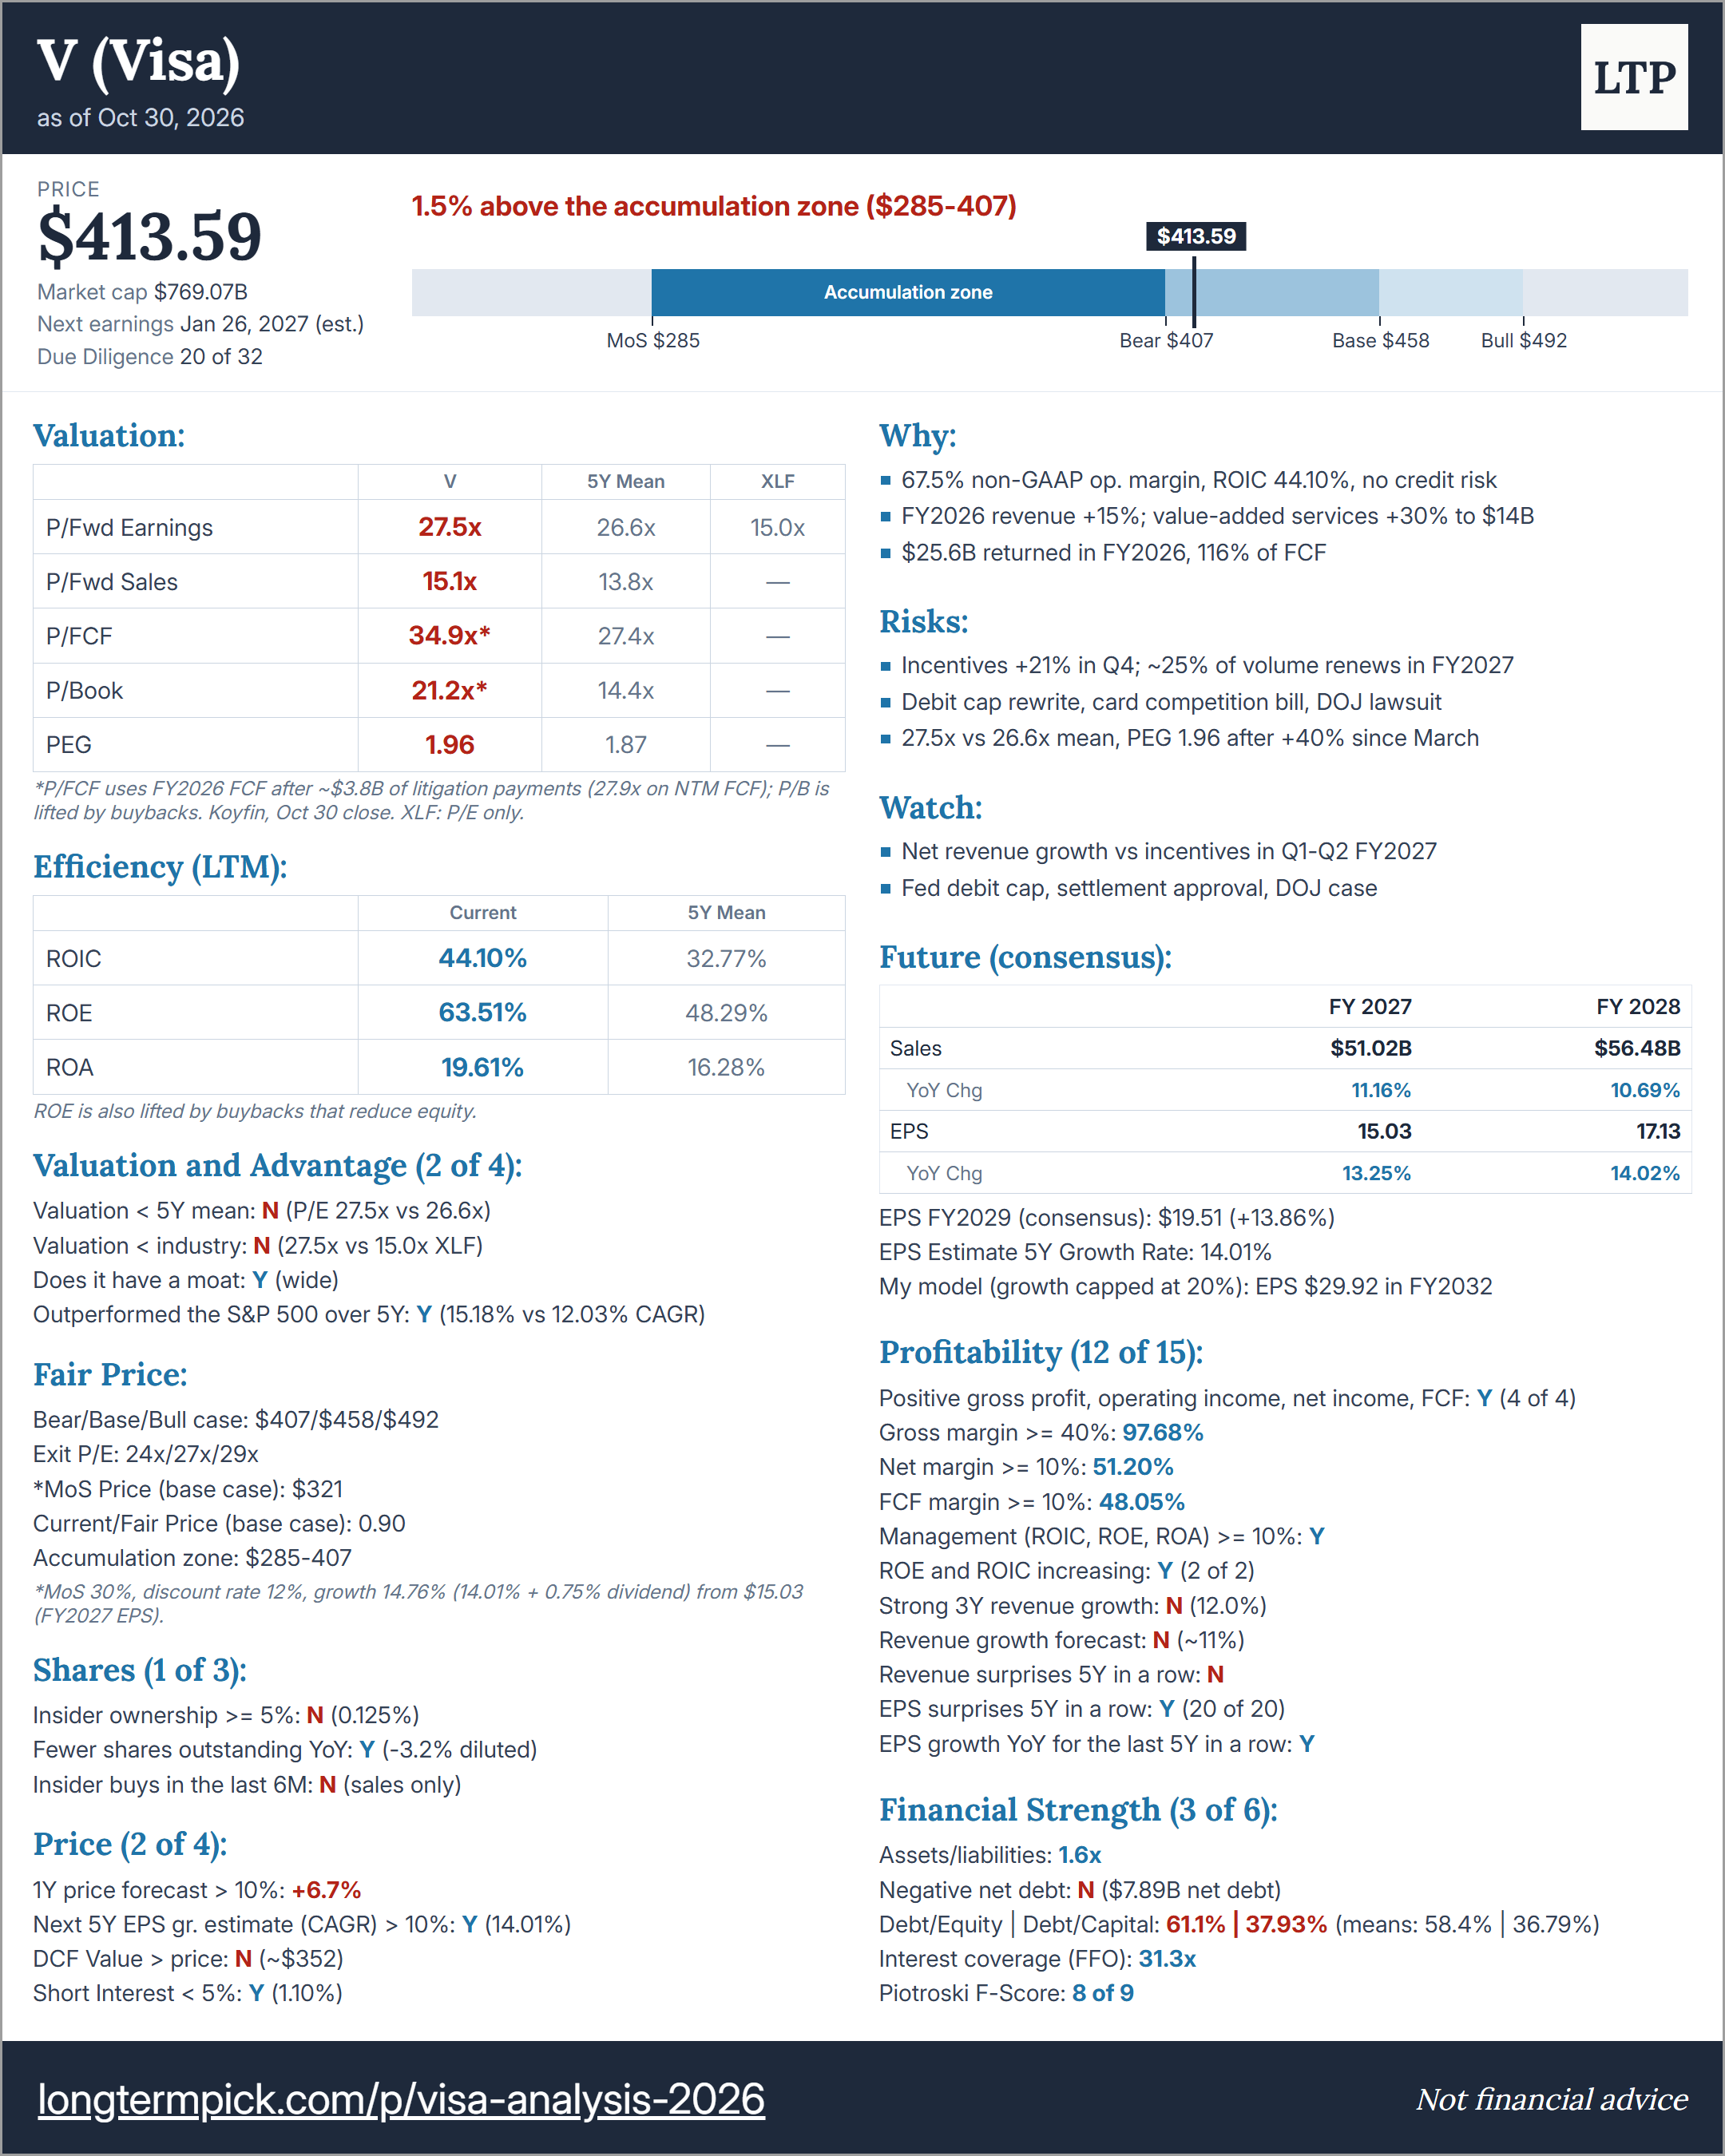
This is not a financial or investing recommendation. It is solely for educational purposes.