

TL;DR: Netflix (NFLX) has more paid memberships than any other streaming service, and it earns almost all of its revenue from subscriptions and a growing part from ads. The Q3 2026 report was another quarter of double-digit growth. At the same time, Netflix cut its ad revenue forecast and guided Q4 below consensus, and NFLX fell again. The stock is down 50% from its June 2025 peak, while LTM EPS without the Warner Bros. Discovery (WBD) termination fee is up 25%. As I see it, if the multiple holds, the price assumes Netflix's margin stops growing, while the data shows slower margin growth, not the end of it. NFLX trades inside my accumulation zone, but the thesis is not proven yet; my full fair price math is at the end of this post.
Investment Thesis
The Q3 report on Oct 20 matched Netflix’s own revenue forecast and beat the EPS consensus, and the stock still fell - for the third report in a row. In my February analysis, the idea was that Netflix moves from subscriber growth to profit growth. At that time, Netflix’s deal to buy Warner Bros.’ studios and HBO Max was still pending. Since then, Netflix walked away when Paramount Skydance offered more, received a $2.8B termination fee, lost its co-founder from the board, replaced its content chief, and cut ~1,000 jobs. My idea here is to separate the one-offs in the 2026 numbers from the trend, and to compare the trend with what the price assumes.
Growth slowed, but it did not stop. Revenue increased 12% YoY to $12.87B (11% F/X neutral, without currency effects), after 16% in Q1 and 13% in Q2. Operating income increased 37% to $4.46B, but Q3 2025 included a ~$619M charge for tax assessments in Brazil. Without it, operating income grew ~15%, and the operating margin increased ~1 point to 34.6%. For 2026, Netflix expects revenue of $51.1B (+13%) and a 31.5% operating margin.
The 2027 consensus looks slow only because of one payment in 2026. Consensus EPS for 2026 is $3.57, and ~$0.52 of it is the after-tax termination fee, by my estimate. Against $3.05 without the fee, the 2027 consensus of $3.77 is +24%, not the +6% that the reported numbers show. NFLX trades at 18.1x forward earnings with a 21.28% 5Y EPS growth estimate, PEG of 0.85.
The business generates more cash than ever, and Netflix returns all of it. LTM FCF was $11.38B, of which up to $2.8B is the fee, and the LTM operating margin was 31.3%. ROIC is 27.69% against a 19.44% 5Y mean, and ROE is 53.46%, or ~45% without the fee. In the last 12 months, Netflix spent $12.86B on buybacks, more than its FCF and 4.7% of today’s market cap. Net debt is $6.91B, 2.5% of the market cap.
The multiple is below the low end of its usual 5Y range. At 18.1x forward earnings, NFLX trades below its -1 standard deviation band (24.3x), the lower edge of its usual range in the last 5 years. The 32.6x 5Y mean is higher because NFLX traded at ~55-60x in late 2021. NFLX pays no dividend, so if the forward multiple does not change, my 12% required return needs only ~12-13% EPS growth per year. Without one-offs, 2026 EPS is on track for ~15-16% growth ($3.05 against ~$2.64 in 2025, without the fee and the Brazil charge).
The bear case is a Netflix that grows by price and ads, not by viewing. Engagement barely grows (view hours +2% in H1 2026), YouTube takes more TV time, US revenue growth slowed from 18% to 11% in 3 quarters, the ad business is behind its own plan, and the operating margin expands only ~1 point this year without one-offs, after ~2.5 points a year in 2020-2025. My model takes this into account by removing the fee from the starting EPS and by using today’s 18x as the Bear Case exit multiple. Even so, NFLX is 14% below my Bear Case fair price of $78. That case still assumes 20% growth, though. If the margin grows only ~1 point a year, EPS grows ~17%, and my model gives ~$68 at the 18x exit, about today’s price.
Analyst’s note:
Share and per-share numbers reflect the 10-for-1 stock split of November 2025, and the price anchor is the Oct 22 close of $67.05. Netflix’s GAAP EPS for 2026 includes the $2.8B termination fee that Paramount Skydance paid on behalf of Warner Bros. Discovery in Q1. Netflix booked it in “interest and other income” and does not disclose its after-tax effect on EPS. At the 21% US federal tax rate, it is ~$2.21B, or ~$0.52 per share. The $3.57 consensus includes the fee, since it equals the reported EPS of the first 9 months ($2.90) plus Netflix’s Q4 forecast ($0.67). Netflix’s own Q1 forecast points to a similar number. EPS was $1.23 against a $0.76 forecast made before the fee. I use the larger $0.52, so my model starts from $3.05. In cash terms, Netflix raised its 2026 FCF forecast by only $1.5B after the fee, so if anything, my adjustment is too large, not too small. The Koyfin forward multiples use NTM EPS, which no longer includes Q1 2026, so they do not need this adjustment.
Company Overview
Next Earnings Date: Jan 19, 2027 (estimated)
Market Cap: $275.3B
Sector: Communication Services | Industry: Entertainment
Type: Large Blend
Short Interest: 2.0%
Netflix was founded in 1997 as a DVD-by-mail service. Today it has more paid memberships than any other streaming service: over 325M at the end of 2025 and, as the company says, an audience approaching 1 billion people. Netflix stopped reporting membership numbers regularly in 2025. Ted Sarandos and Greg Peters manage the company as co-CEOs. Co-founder Reed Hastings, who led Netflix as CEO and co-CEO for more than 25 years, did not stand for re-election to the board in June 2026, and Jay Hoag, a director since 1999, became the chair. A year earlier, Hoag did not get a majority of the votes at the annual meeting. Netflix explains it by his low attendance in 2024 (less than 75% of the board and committee meetings), and the board rejected his resignation. It is a small point, but the new chair starts with weak support from shareholders. Netflix had ~16,000 full-time employees at the end of 2025, according to its 10-K.
The business is one product sold in two ways. Members pay a monthly subscription, and on the cheapest plan they also see ads. As of Sep 30, 2026, plans cost the equivalent of $1-37 per month, depending on the country and the plan, according to the Q3 10-Q. Advertising is still small (Netflix expects ~$2.7B in 2026, ~5% of revenue), but it is the fastest-growing part, ~80% this year. Subscriptions bring almost all the rest. Netflix also earns some revenue from consumer products and live experiences (Netflix House), but it says this revenue is not material. Netflix sells directly to members, and partners such as TV makers, pay-TV distributors, mobile operators and internet providers promote or bundle the service. In India, for example, Netflix added its first loyalty bundle with Flipkart this year.
The content comes from three sources. Netflix produces its own series and films, adds live events (NFL games, MLB, boxing), and licenses series and films from other studios after their first release. Non-English viewing increased from under 10% of all viewing a decade ago to more than a third today. Recently, Netflix signed licensing deals with Disney (DIS), Sony (SONY) and Universal, its largest deal ever with Globo in Brazil, and it integrated the whole TF1 channel into its French service. In March, it also bought InterPositive, a company founded by Ben Affleck that develops AI tools for filmmakers. Cash paid for acquisitions in Q1 was $586M.
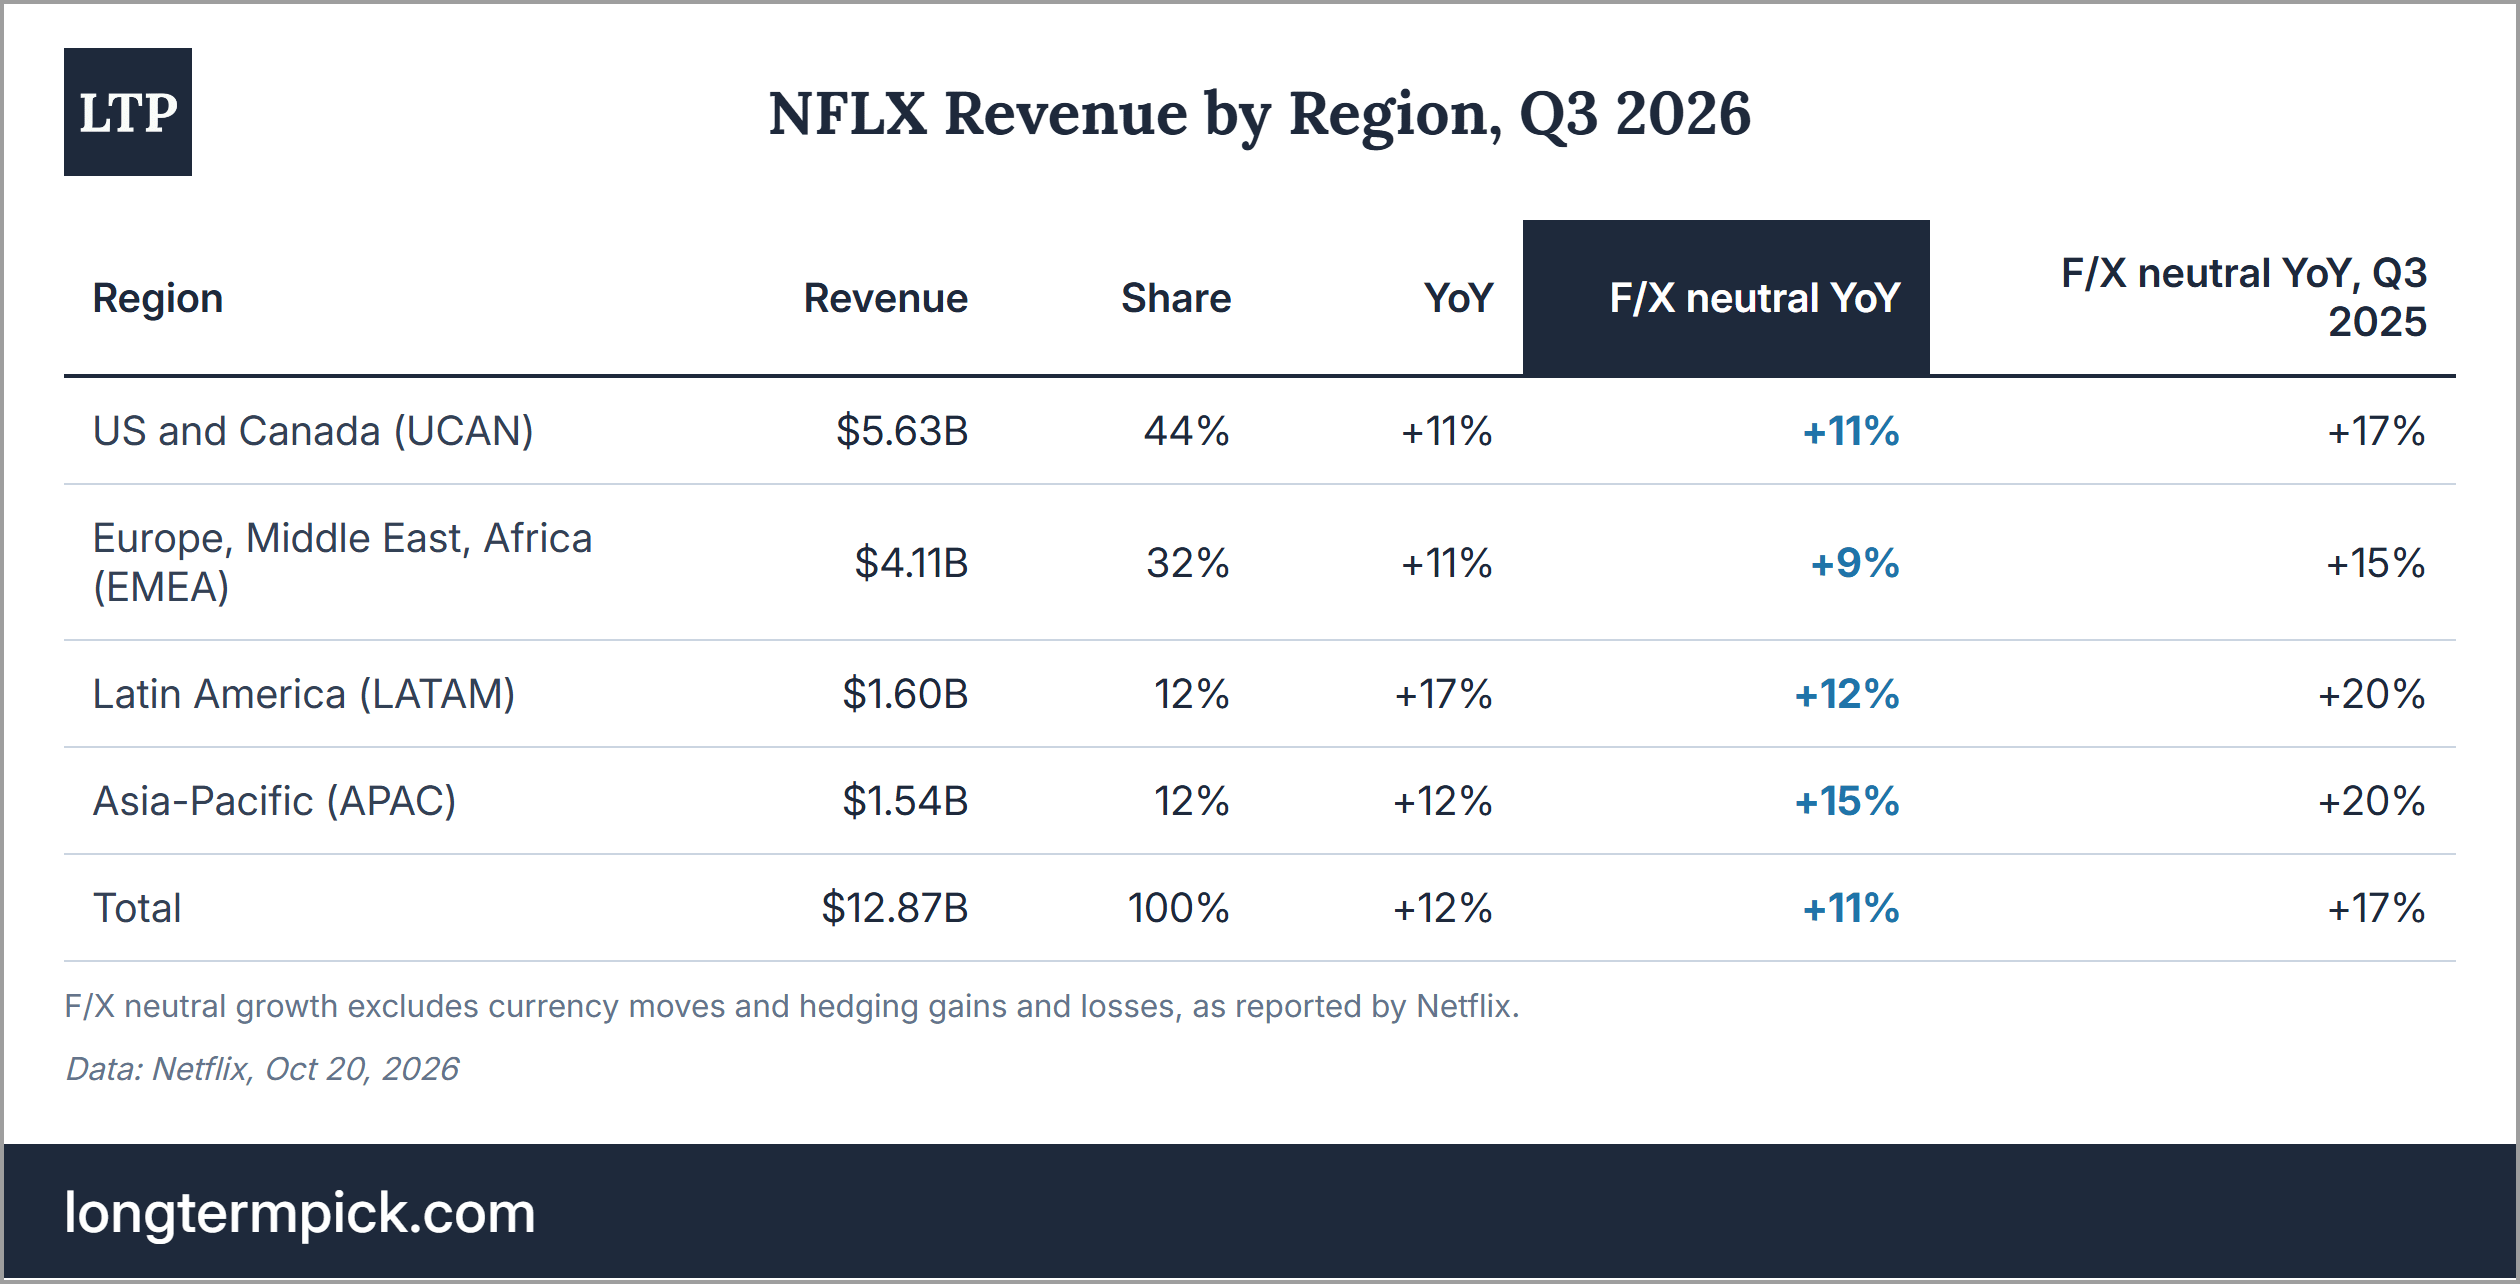
Revenue is spread across four regions, and growth slowed in each of them. The US and Canada brought 44% of Q3 revenue. F/X neutral growth was 9-15% by region, against 15-20% a year ago. India is the example the company highlighted - a strong local slate increased view hours 24% YoY and revenue ~18% F/X neutral.
Market Overview
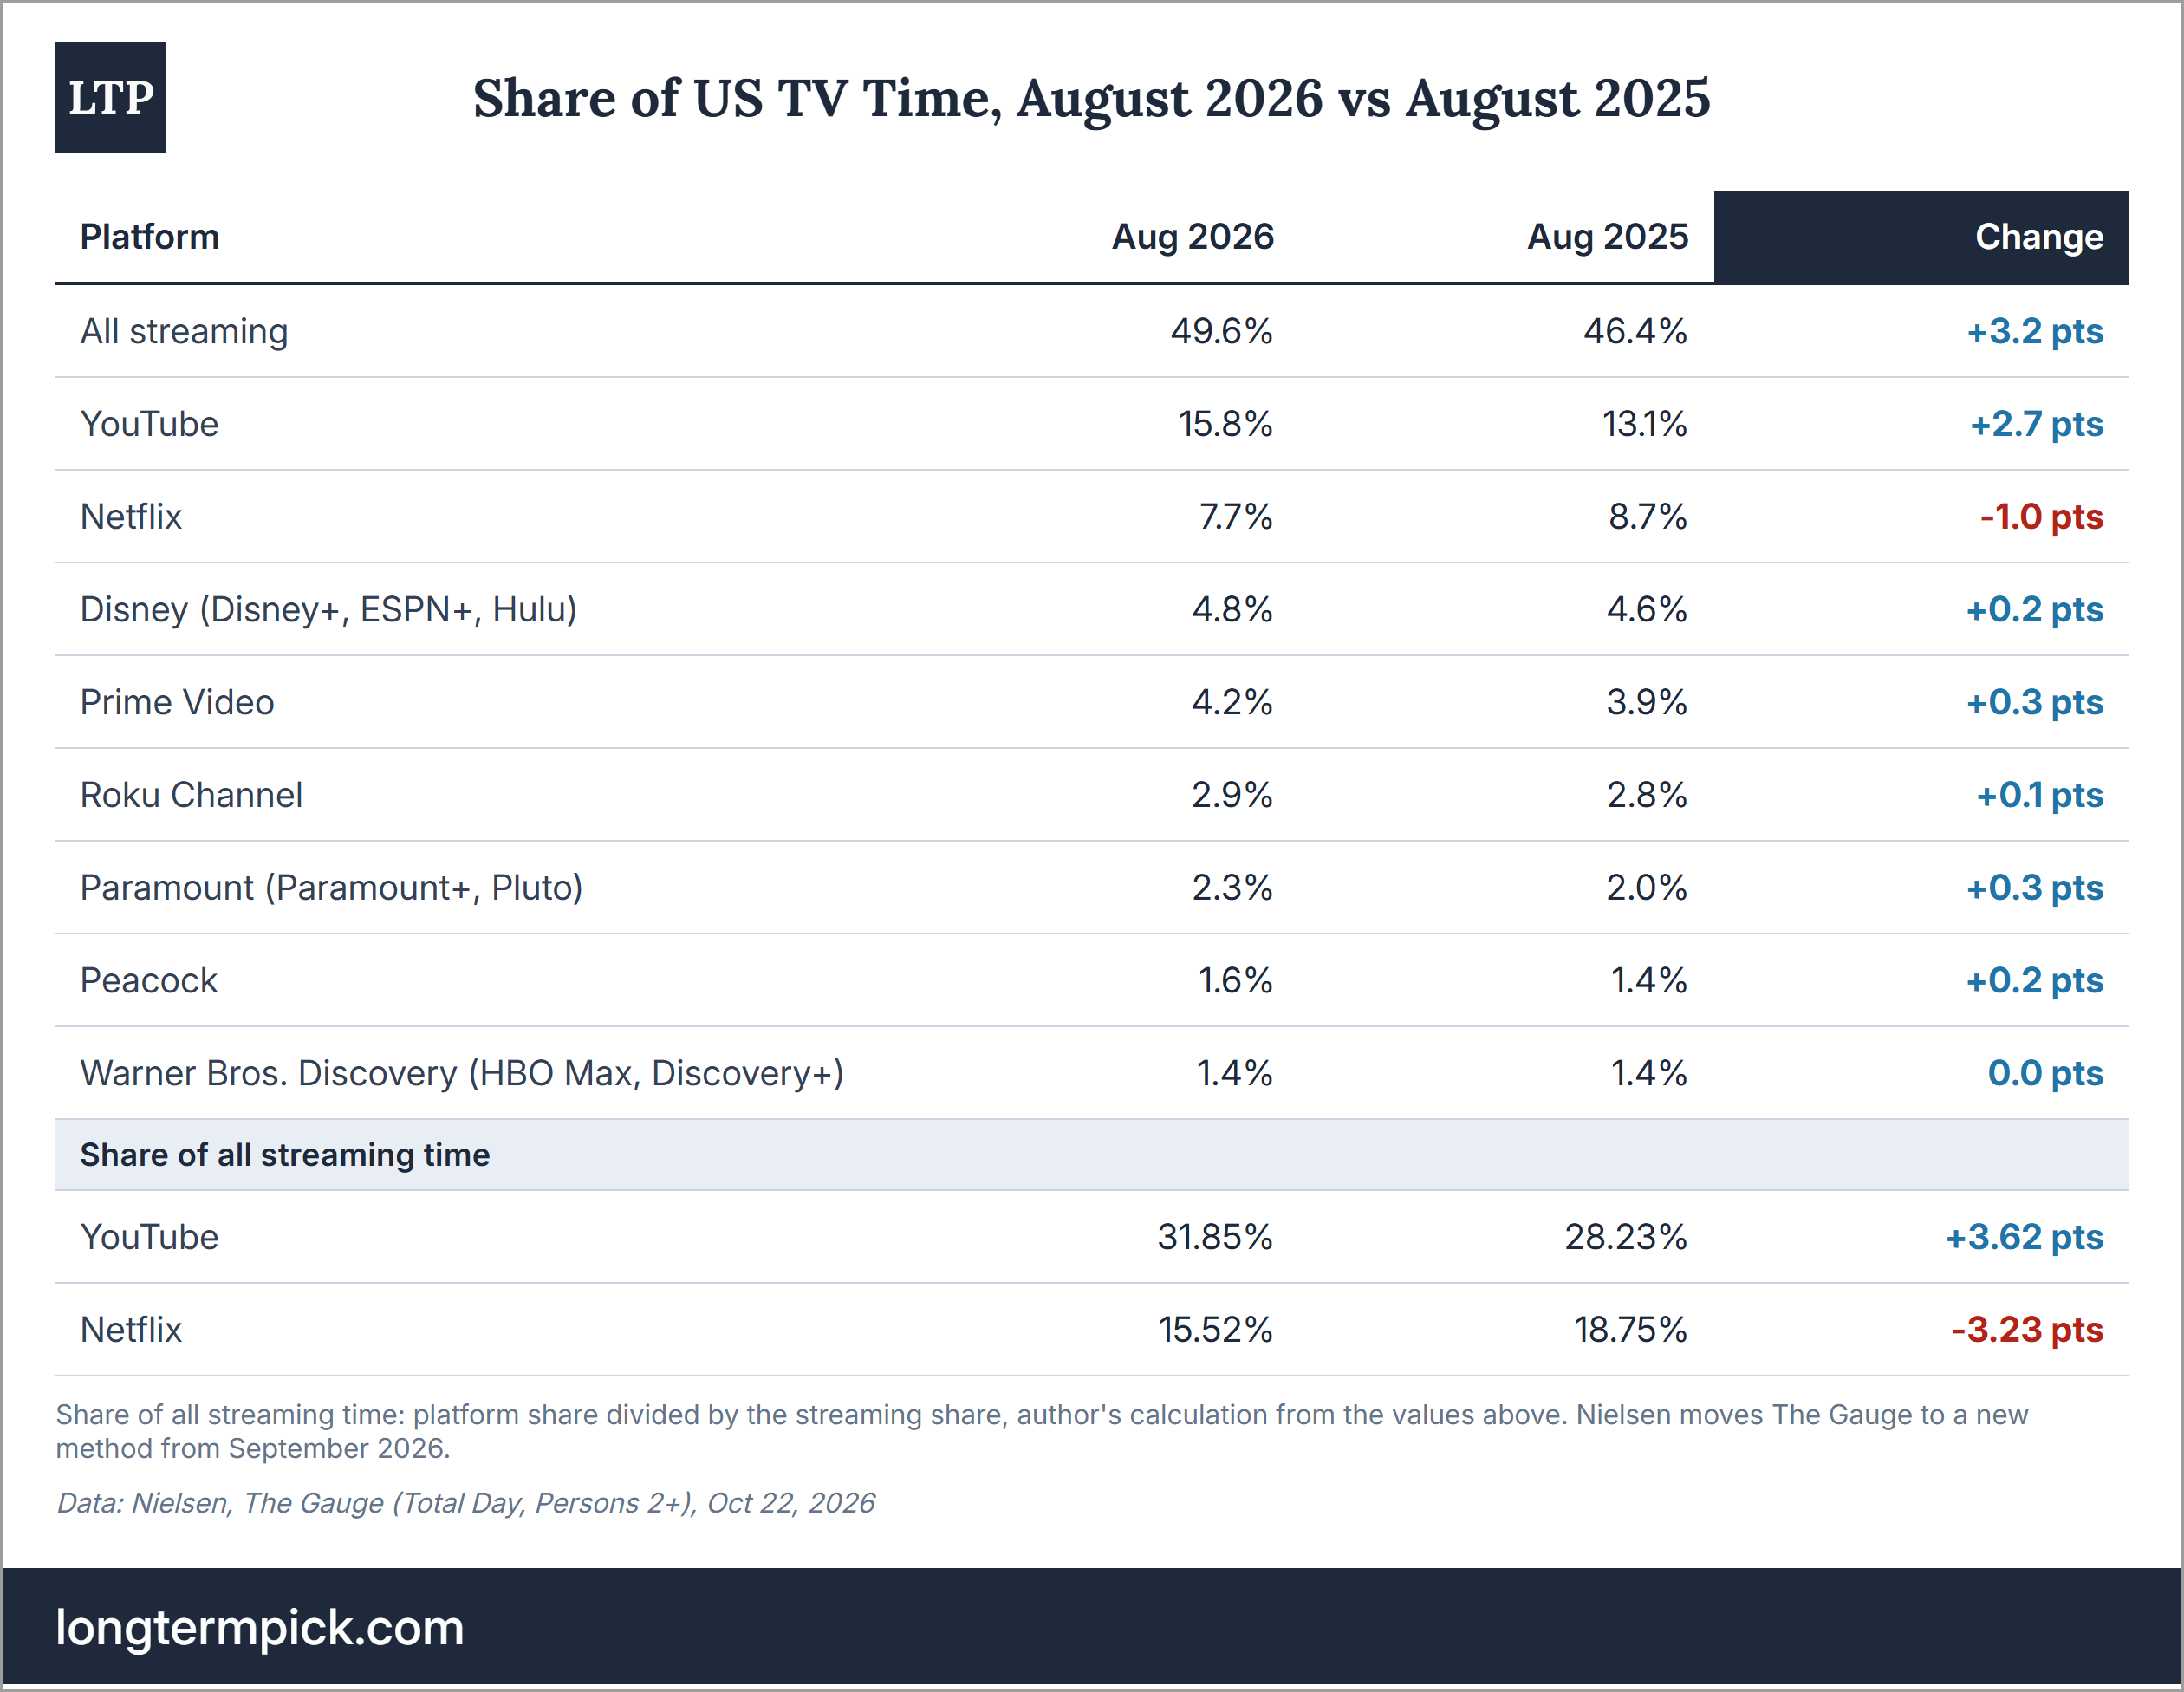
Streaming is now half of US TV time, and most of the new time goes to YouTube. In August 2026, streaming had 49.6% of US TV time, against 46.4% a year earlier, according to Nielsen’s The Gauge. YouTube had a record 15.8% (13.1% a year earlier). Netflix had 7.7%, against 8.7%. As a result, Netflix’s share of all streaming time decreased from 18.8% to 15.5% in 1 year, while YouTube’s increased from 28.2% to 31.9%. August 2025 was a strong base for Netflix, with Wednesday and KPop Demon Hunters at the top of Nielsen’s streaming list. Still, July shows the same 1-point decline, from 8.8% to 7.8%. Nielsen moves The Gauge to a new method from September, so the next comparable data comes later this year.
Netflix’s own engagement data is the weak point. View hours increased 2% YoY in the second half of 2025, when viewing of branded originals grew 9%, and other viewing declined. In the first half of 2026, view hours increased 2% again, against 1.5% growth in 2025. In July, Netflix also said it will publish its engagement report only once a year, starting in Q1 2027, to keep the focus on revenue and operating profit. Management repeats that engagement is not only quantity but also “quality and variety” of viewing. As I see it, reducing the disclosure while the number is weak does not help credibility, even if the reason is real.
The money grows more slowly than Netflix, so Netflix takes a larger share of it. In March 2026, Ampere Analysis estimated global subscription streaming revenue at $157.1B in 2025 (+14%), and $177B with advertising. It expects subscription revenue to pass $200B by 2030, so growth slows from 14% to ~5% a year. To compare, Netflix’s 2025 revenue of $45.2B (+16%) is ~26% of the market with ads. In 2026, Netflix expects 13% growth, and ~11% without ads, about 2x Ampere’s expected pace for subscriptions. Netflix gains this share through price and ads, while its share of viewing time decreases.
Advertising is the growing pool, but ad supply grows faster than demand. US connected TV (CTV) ad spending grows 11% to $29.3B in 2026, according to the July report of the Interactive Advertising Bureau (IAB). At the same time, Disney’s streaming ad revenue grew only 3% in its June quarter, as ad rates decreased 4% on “marketplace supply growth” (Disney’s report). YouTube alone sold $11.1B of ads in Q2 2026 (+13%). So Netflix’s ~$2.7B is still small, and in my view part of its ad cut reflects a market with more inventory, not only its own product delays. Peters said that “general demand remains strong”, so this is my reading of Disney’s data, not Netflix’s explanation. The reach is growing. The Netflix ads plan reached more than 250M monthly active viewers in May, as the company said at its upfront presentation.
The subscription competitors became fewer and more profitable. On Oct 06, Skydance (SKYD), formerly Paramount Skydance, closed its acquisition of Warner Bros. Discovery, the deal Netflix walked away from. The combined company has more than 200M streaming subscribers and will merge Paramount+ and HBO Max into one service over time. It reports a pro forma content spend of more than $30B a year for the whole company, TV networks included, against Netflix’s ~$20B. At the same time, it issued $41.4B of secured notes for the deal and targets 3.0x net leverage only by the end of 2029. Disney’s streaming business earned a 12.9% operating margin in its June quarter, and Peacock was profitable for the second quarter in a row. As I see it, the change works both ways for Netflix. Stronger competitors bid more for content and talent, but they also license more to Netflix. For the thesis, the question is whether Netflix can keep raising prices while its share of viewing time decreases.
Economic Moat
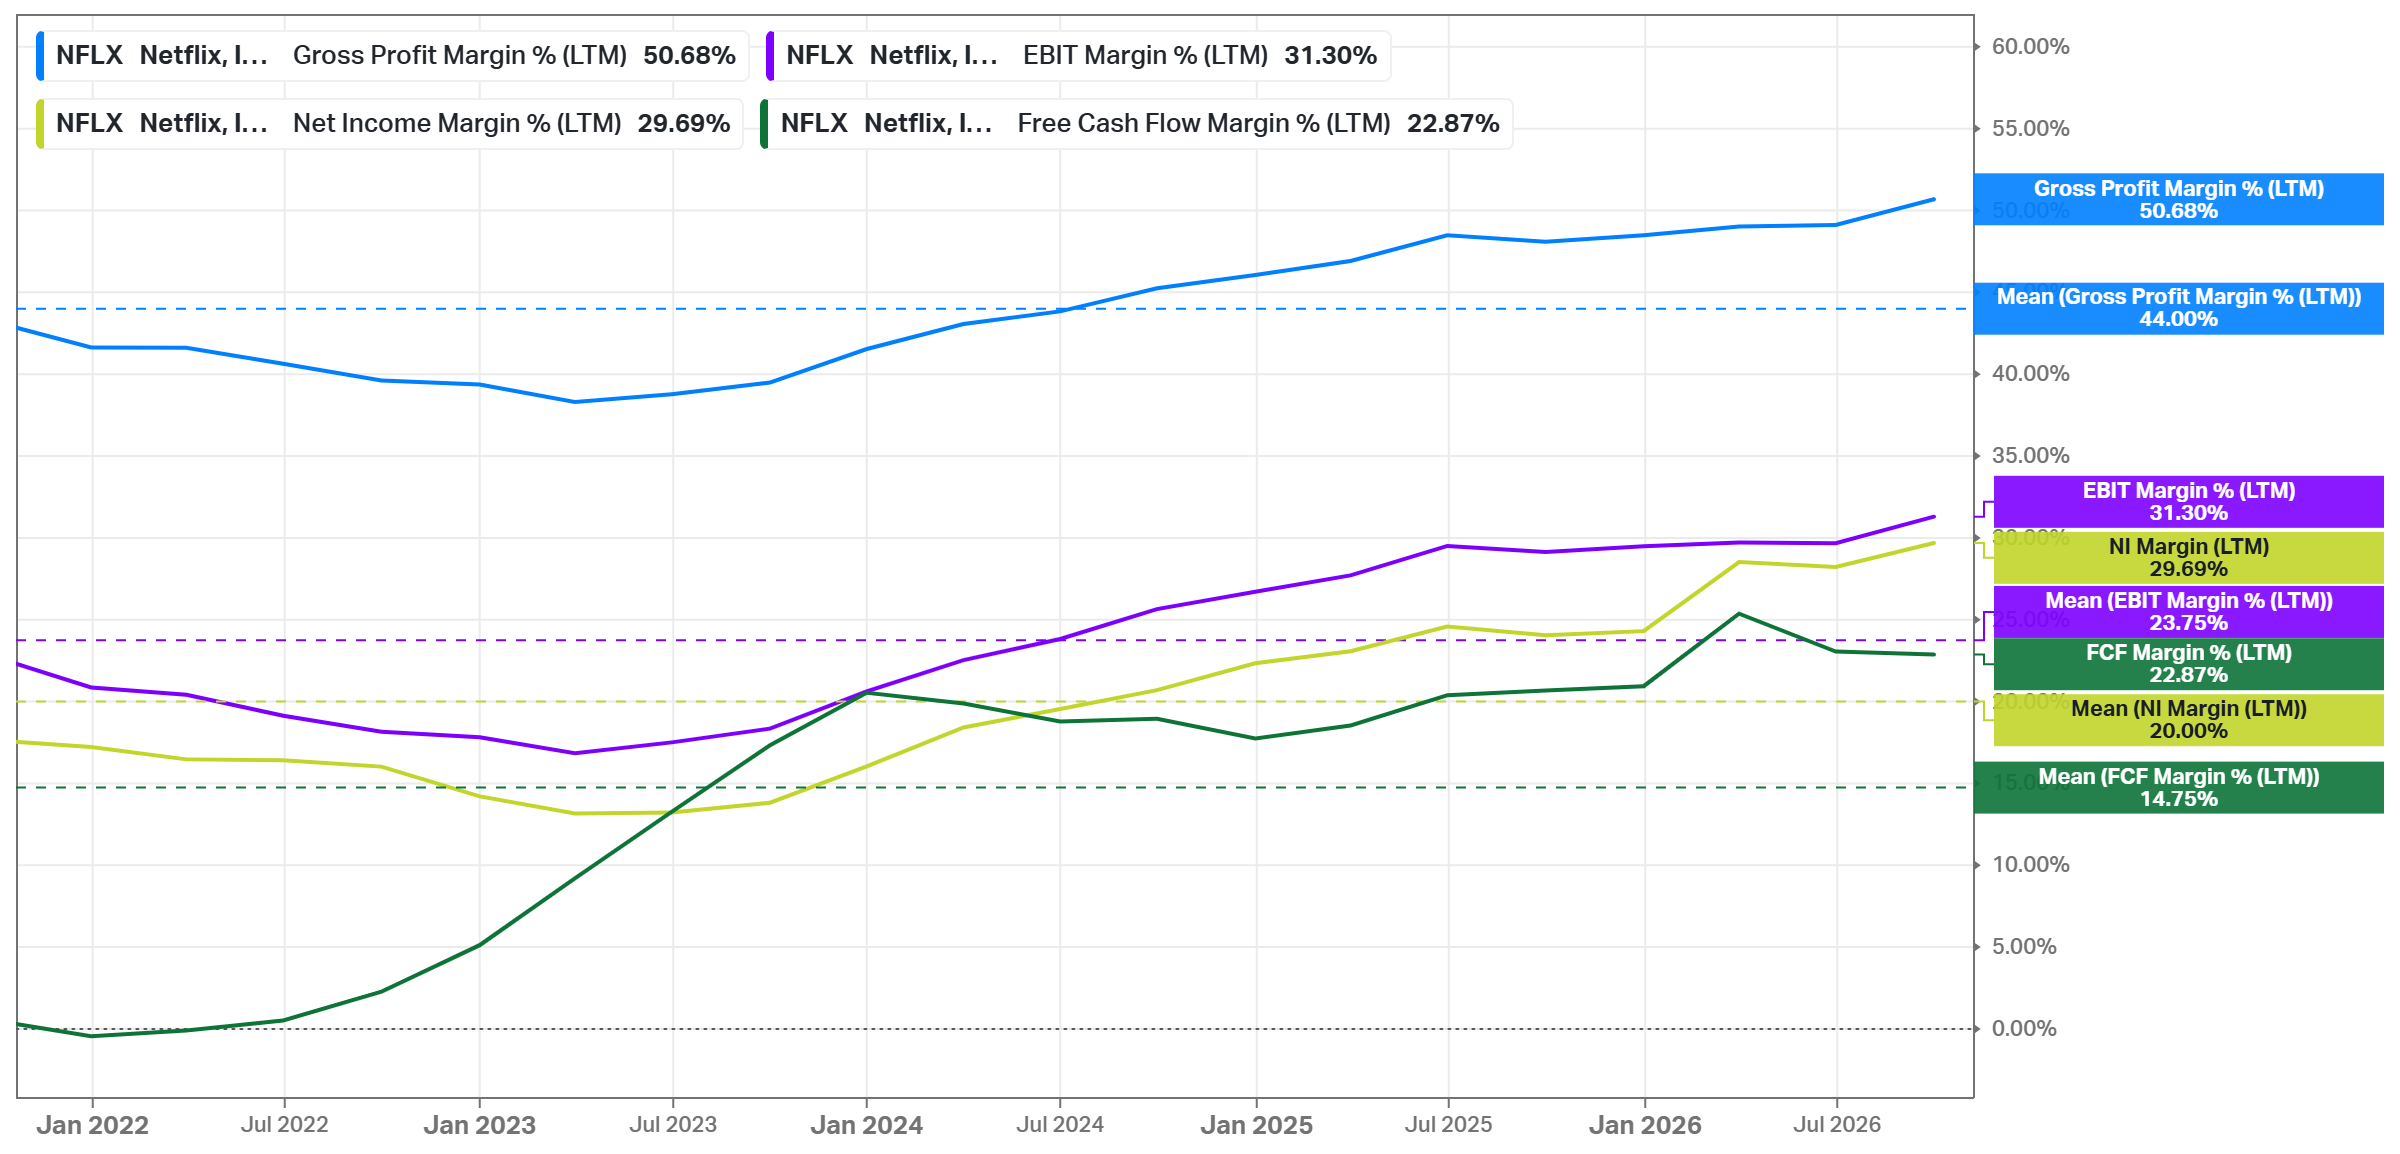
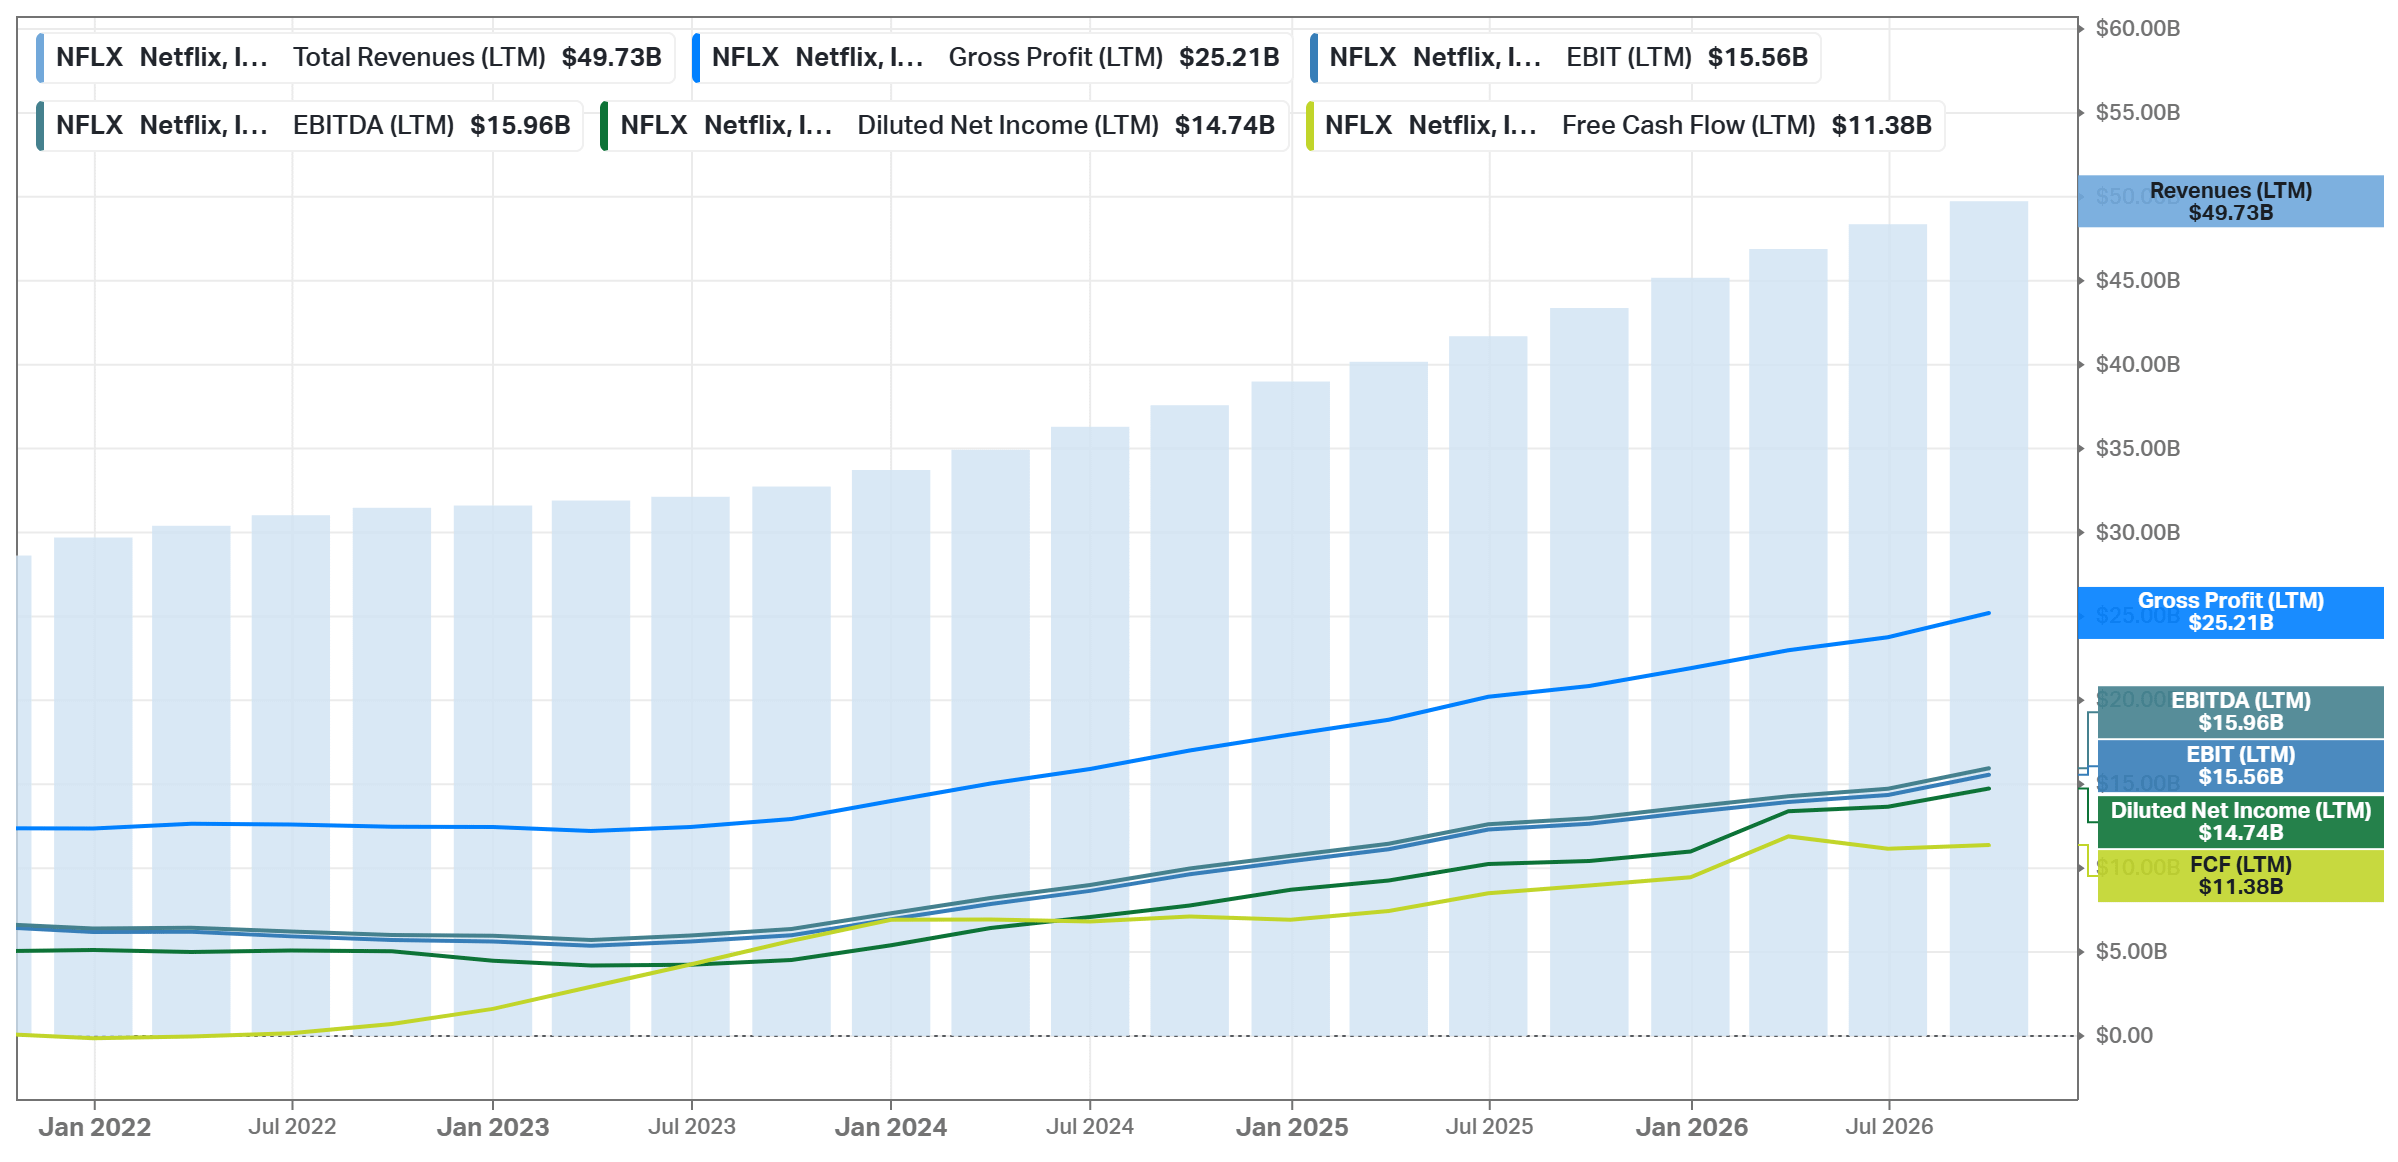
The margins are at record levels. The LTM gross margin is 50.68% (5Y mean: 44.0%), the EBIT margin 31.3% (23.75%), the net margin 29.69% (20.0%), and the FCF margin 22.87% (14.75%). The net and FCF margins include the termination fee. Without it, the net margin is 25.24%.
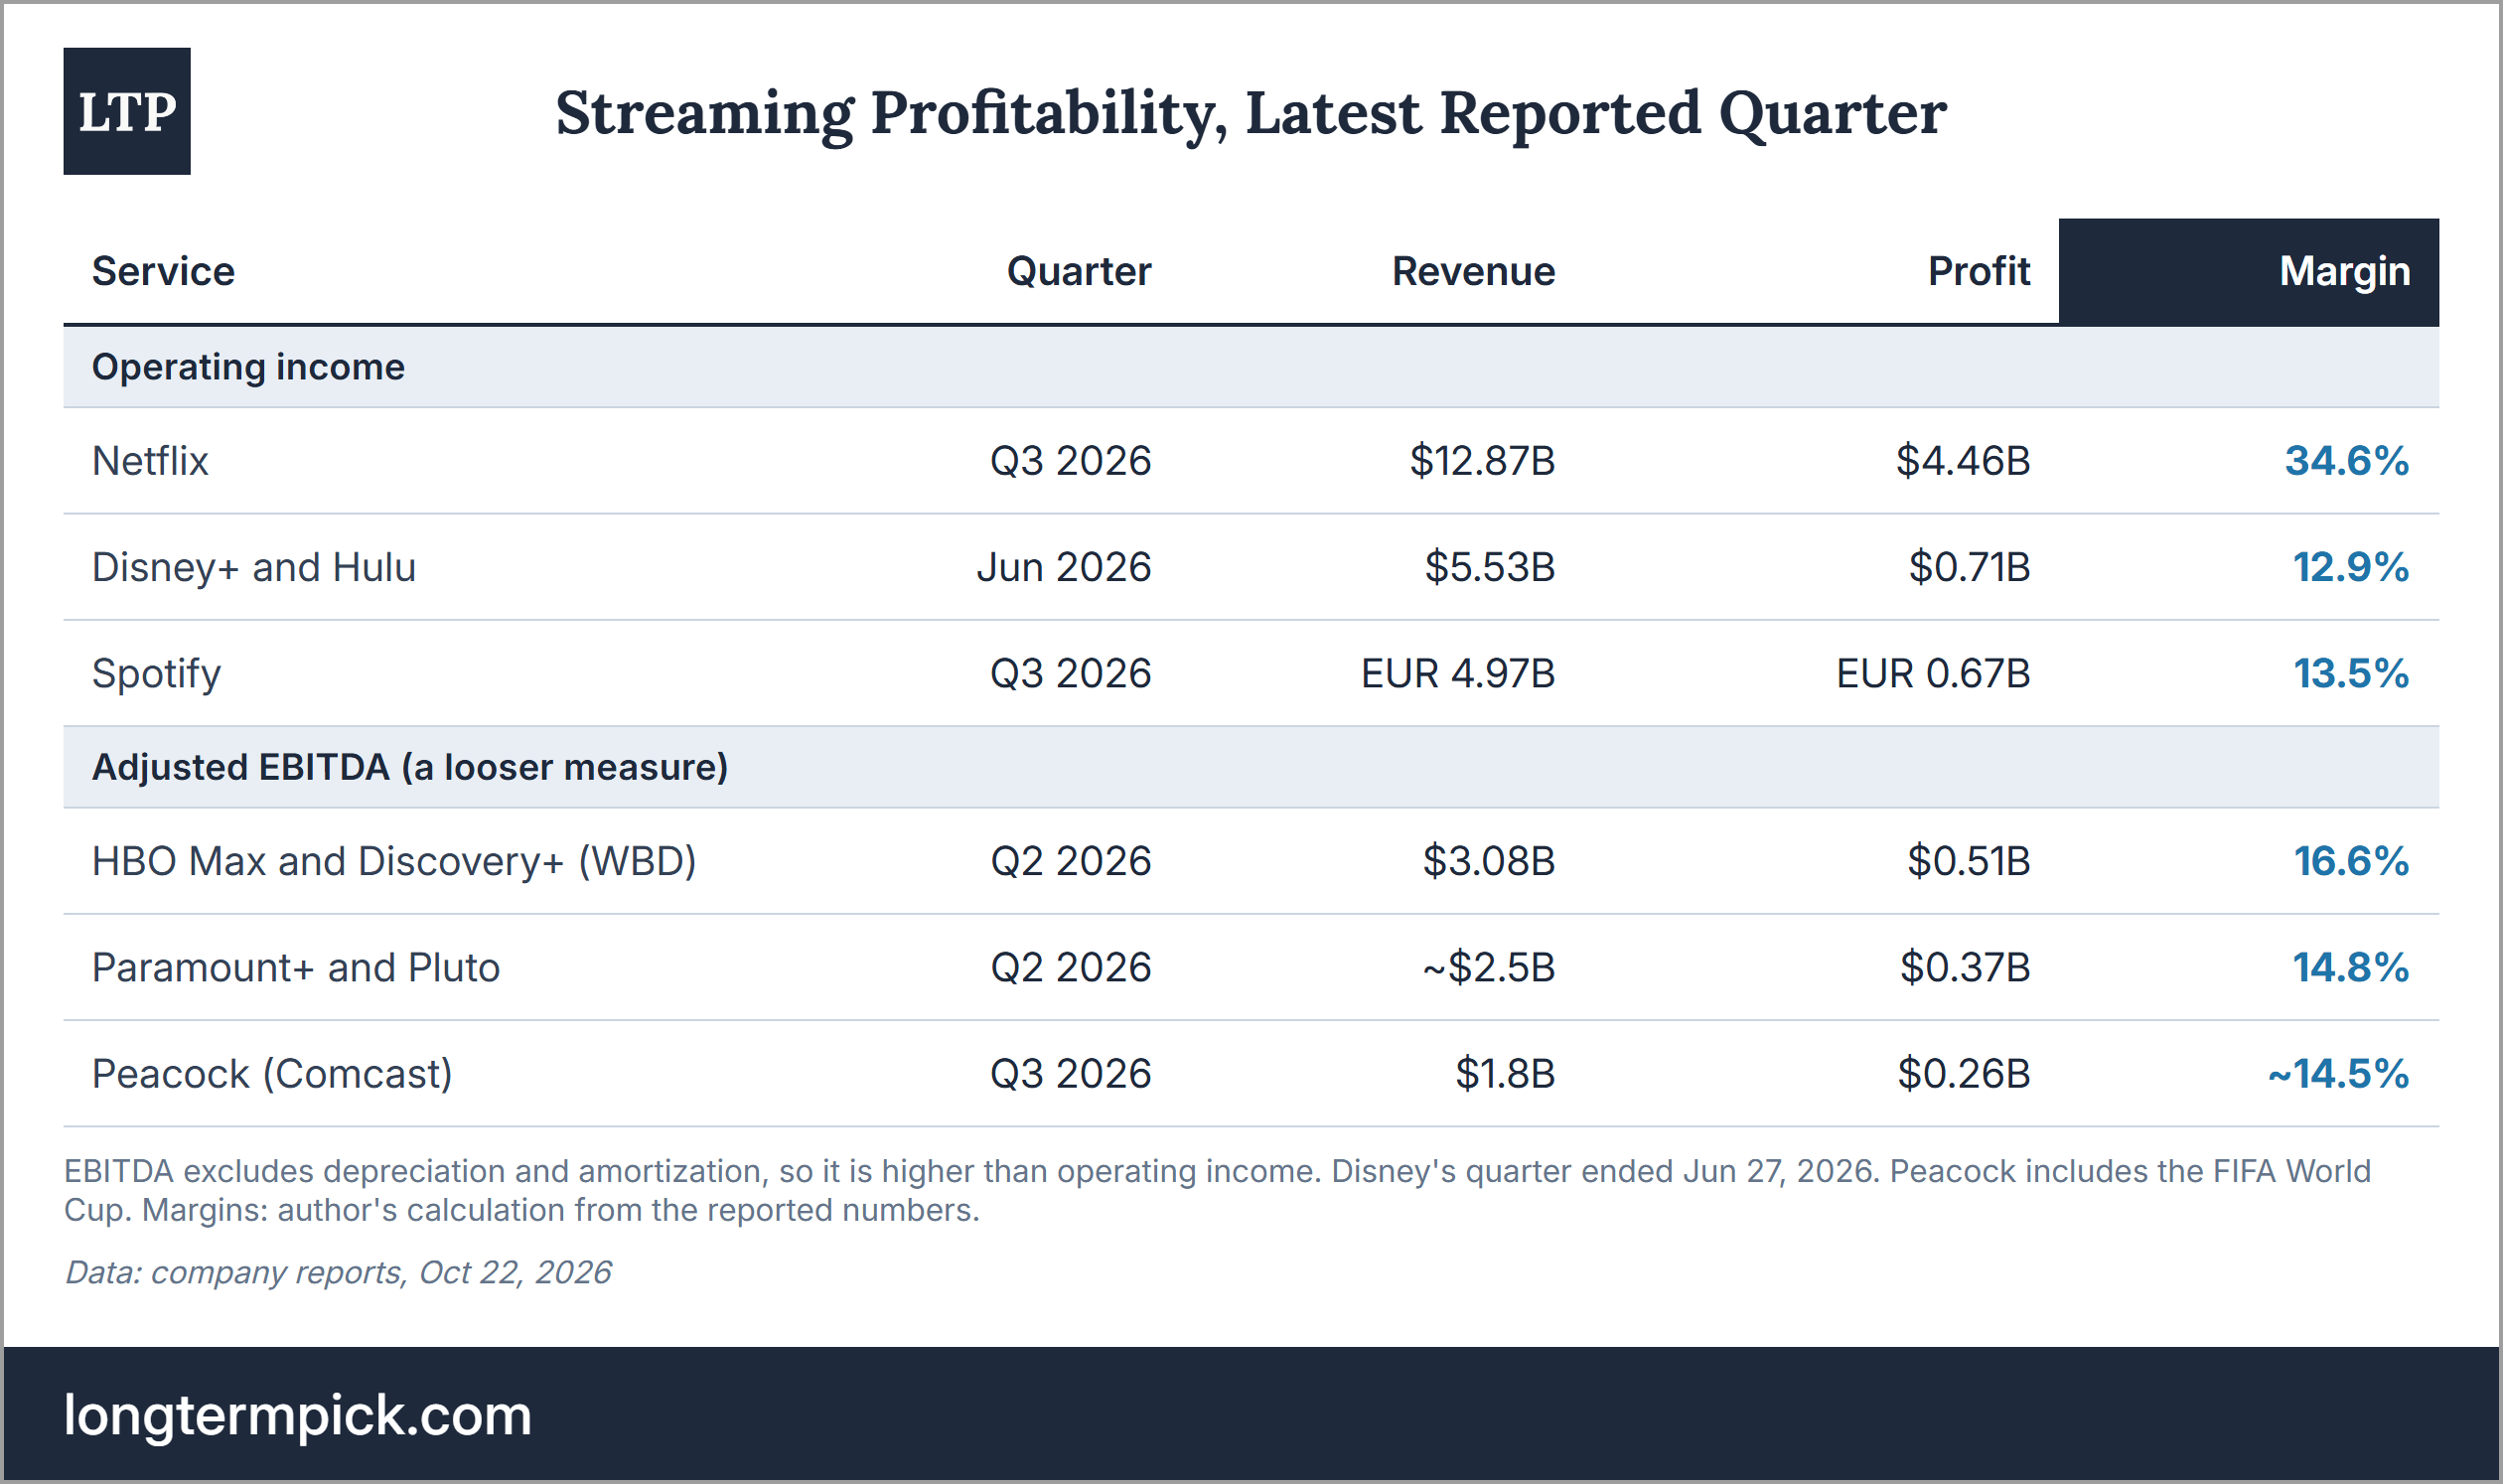
Let’s see what produces these margins. Scale is the main source. A series costs the same whether 50M or 300M members watch it, so the largest service spreads the same content spend over the largest revenue. Netflix spends ~$20B a year in cash on content (in the first 9 months of 2026, $14.98B against $12.76B of amortization), and content amortization grew only ~9% YoY in that period, while revenue grew 14% and cash spent on content 18.5%. This is the operating leverage that took the operating margin from 18.3% in 2020 to 29.5% in 2025. No streaming competitor is close. Netflix’s operating margin (34.6% in Q3) is ~2.7x Disney’s streaming margin and more than twice the margins of HBO Max, Paramount+ and Peacock, which report a looser measure (adjusted EBITDA).
Netflix raises prices without losing members. It raised prices in 2026 in the US, Mexico, Spain, and other markets, and the member response was “consistent with prior price changes and our expectations”. In the US, the ads plan increased from $7.99 to $8.99 in March. Churn improved YoY both globally and in the US. According to Antenna, Netflix’s US churn was 2% in May 2026, after the price increase, against a 4% weighted average for nine premium services (MediaPost’s summary). On the earnings call, Greg Peters said US members pay the least per hour of viewing among subscription services, and for some competitors the price per hour is more than double. Price increases without higher churn are the most direct evidence of a moat that I see here.
Its global reach makes Netflix the natural buyer for competitors’ content. Netflix produces content in more than 50 countries, and local titles travel - non-English viewing is now more than a third of the total. This year’s licensing deals with Disney, Sony, Universal, Globo and TF1 show it.
The weak point is viewing time. Against other subscription services, the moat works. Against YouTube, it does not. YouTube does not fund most of its content upfront (creators make it and share the ad revenue), and it competes for the same TV screen. This is why the moat protects margins and prices, but not engagement.
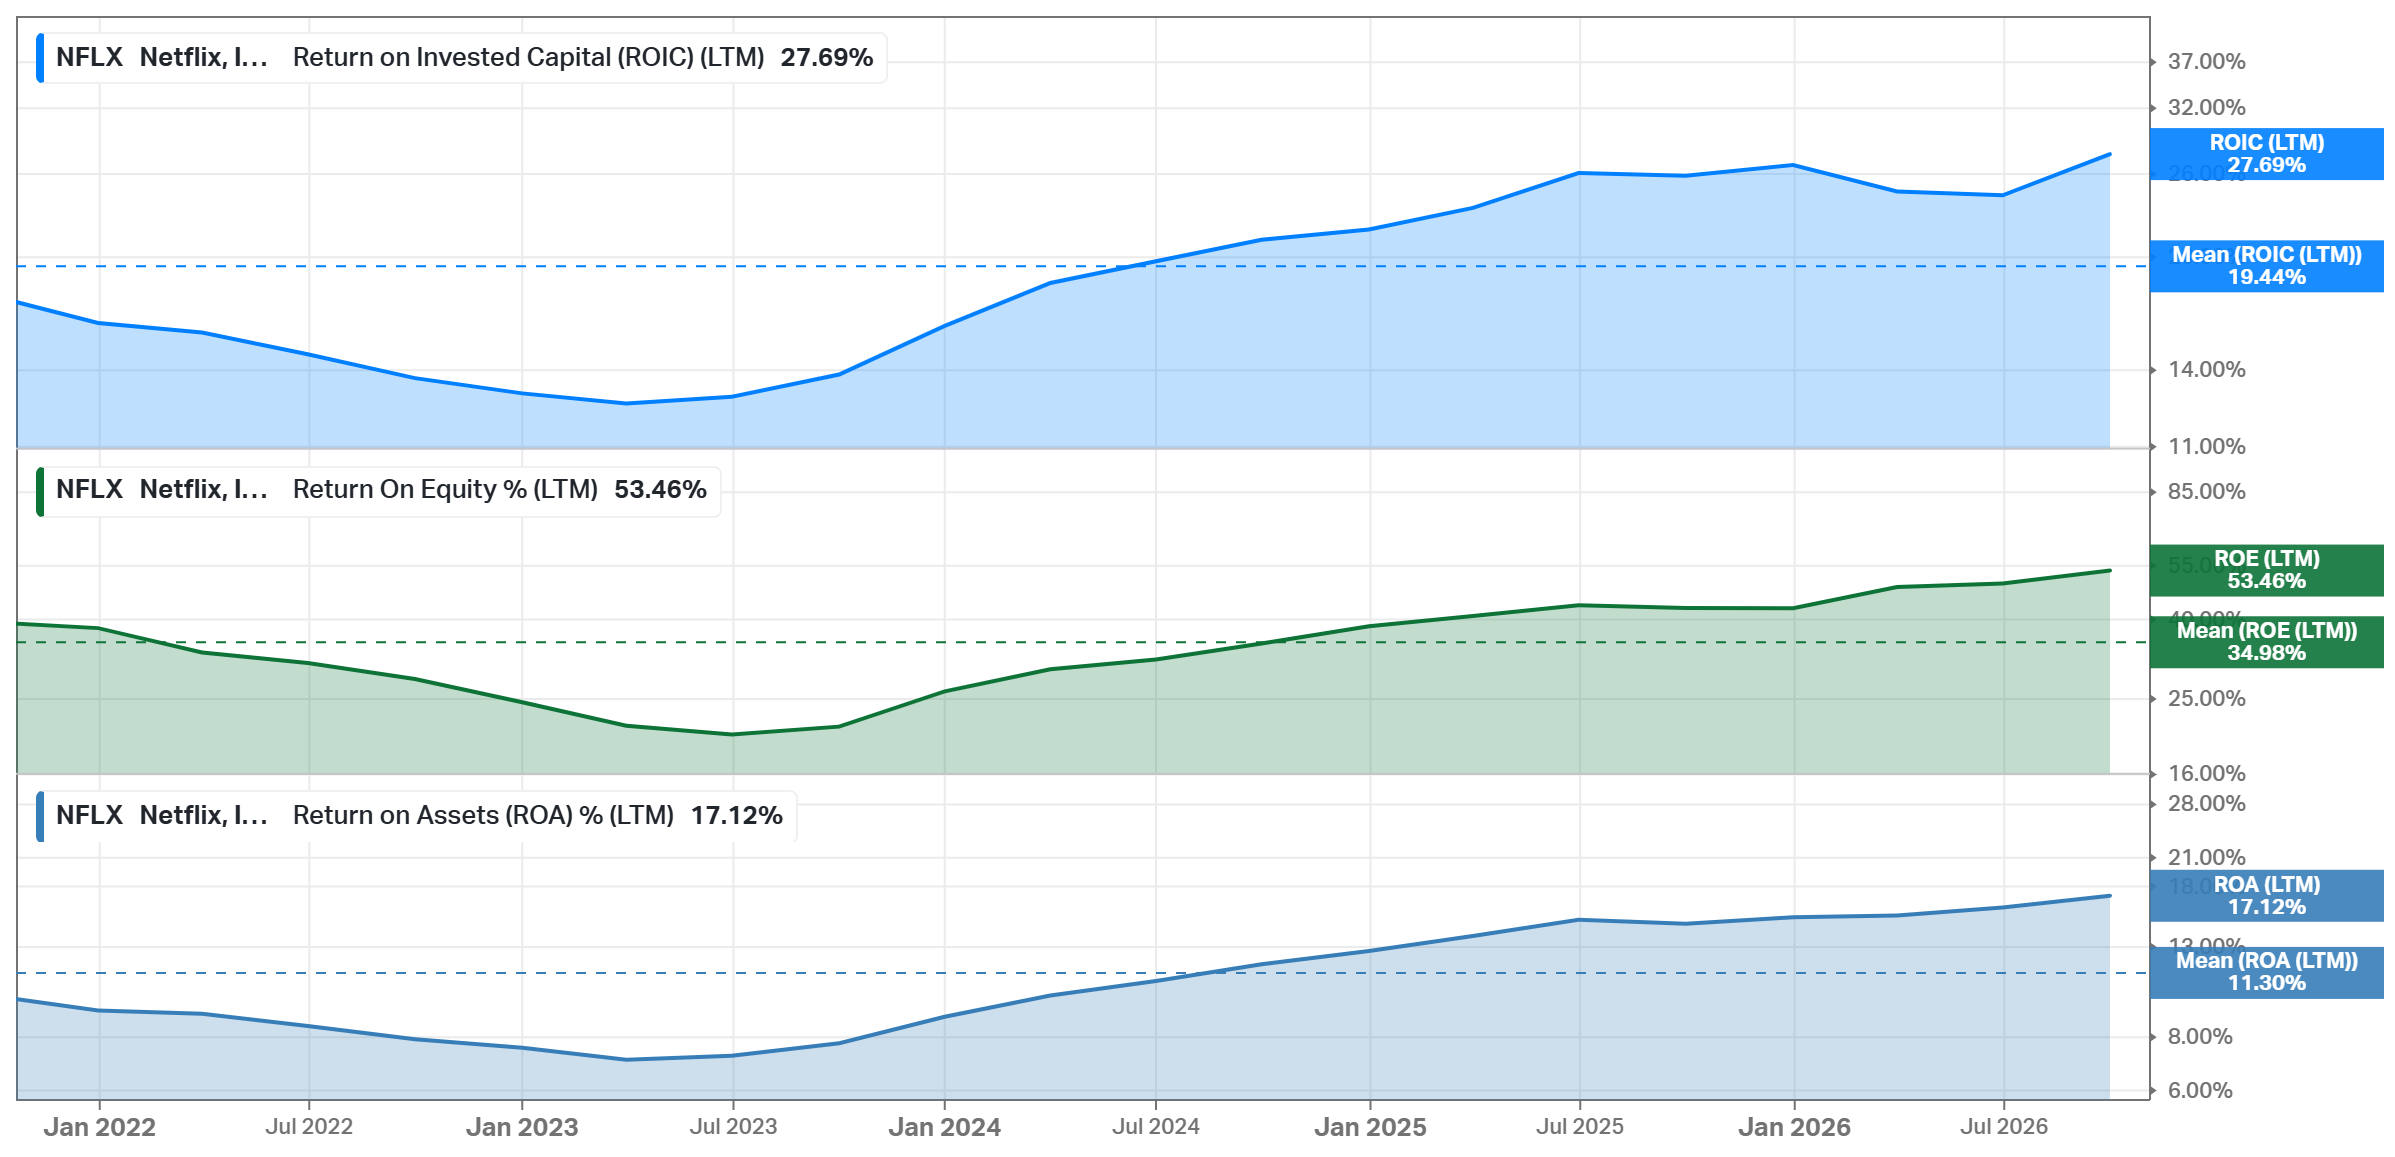
The returns confirm the economics. ROIC is 27.69% (5Y mean: 19.44%), ROE 53.46% (34.98%), and ROA 17.12% (11.3%). Koyfin’s ROA is based on operating income, so the fee does not affect it. ROE includes the fee, and without it, LTM ROE is ~45%, by my calculation. In my view, Netflix has a narrow moat that has become wider against streaming competitors and narrower against free video. The economics are excellent, but the moat does not yet answer the question of who wins the time on the TV screen.
Business Strategy
Fewer people, the same content budget. On Oct 14, Netflix cut ~1,000 jobs, ~6% of its workforce, mostly in product, technology, legal, and human resources. The cost is ~120 basis points (bps) of the Q4 margin. Management did not quantify the savings. The target is visible in the numbers. Technology and development expenses increased 21% YoY in Q3, mostly personnel, against 12% revenue growth. Peters explained the cut as a “forcing function” for the whole organization. In my view, this is cost discipline that should show up in the 2027 margin. The cut is mostly outside content, and the content cash spend target (~1.1x amortization) did not change.
A new content chief for the US slate. Netflix replaced Chief Content Officer Bela Bajaria with Peter Rice, the former chairman of Walt Disney Television, from Oct 26. Film chief Dan Lin also left. Sarandos was direct about the reason. The US “is also working. It’s just not growing as fast as it could or as fast as we’d like.” The awards tell the same story - 16 Primetime Emmys in 2026, against 30 in 2025, according to Variety. Sarandos expects Rice to influence projects that are already in production. In my view, content takes years from approval to release, so a new chief changes the 2028 slate more than the 2027 one.
Ads: behind plan, still growing ~80%. Netflix now expects ~$2.7B of ad revenue in 2026, against ~$3B before. Peters said the business is “a bit behind our aggressive target” because of delays in the rollout of new ad products and in partner integrations. Even so, it still grows “over 80% this year”, as he put it. The ad tier comes to 15 new countries in 2027, the first 12 in March. Peters also said that the gap between the ad tier’s revenue per member and the standard plan’s is narrowing, but Netflix gives no number for it. The gap is also a cost today. The ads plan was over 60% of sign-ups in ads countries in Q1, and Peters said the gap “means underrealized revenue growth for us in the near term”. The 15 new ads countries extend this to more markets in 2027. The cut is small in dollars ($300M, ~0.6% of 2026 revenue), but it affects the fastest-growing revenue line and the credibility of the targets.
Aggregation instead of acquisition. In December 2025, Netflix agreed to buy Warner Bros.’ studios and HBO Max for an enterprise value of $82.7B. When Paramount Skydance offered more, Netflix did not raise its bid, and in February it received the $2.8B termination fee. The new approach is cheaper: license more from competitors and integrate whole services, as with TF1. Peters said that add-on services from partners could follow, with “nothing to announce today”. As I see it, this is a better use of capital than the $82.7B deal. It also shows that Netflix wants more third-party content to grow viewing.
Live events and theaters, selectively. Live programming is just over 5% of the 2026 content spend and ~1% of view hours, but events like the NFL games on Thanksgiving Eve and Christmas Day bring sign-ups and ad revenue. Netflix will release ~30 films in theaters this year, and a few large family films in 2027, Greta Gerwig’s Narnia among them, get a traditional 45-day theatrical window. In my view, both are small changes to a streaming-first model, and they test new revenue without much risk.
Capital Allocation
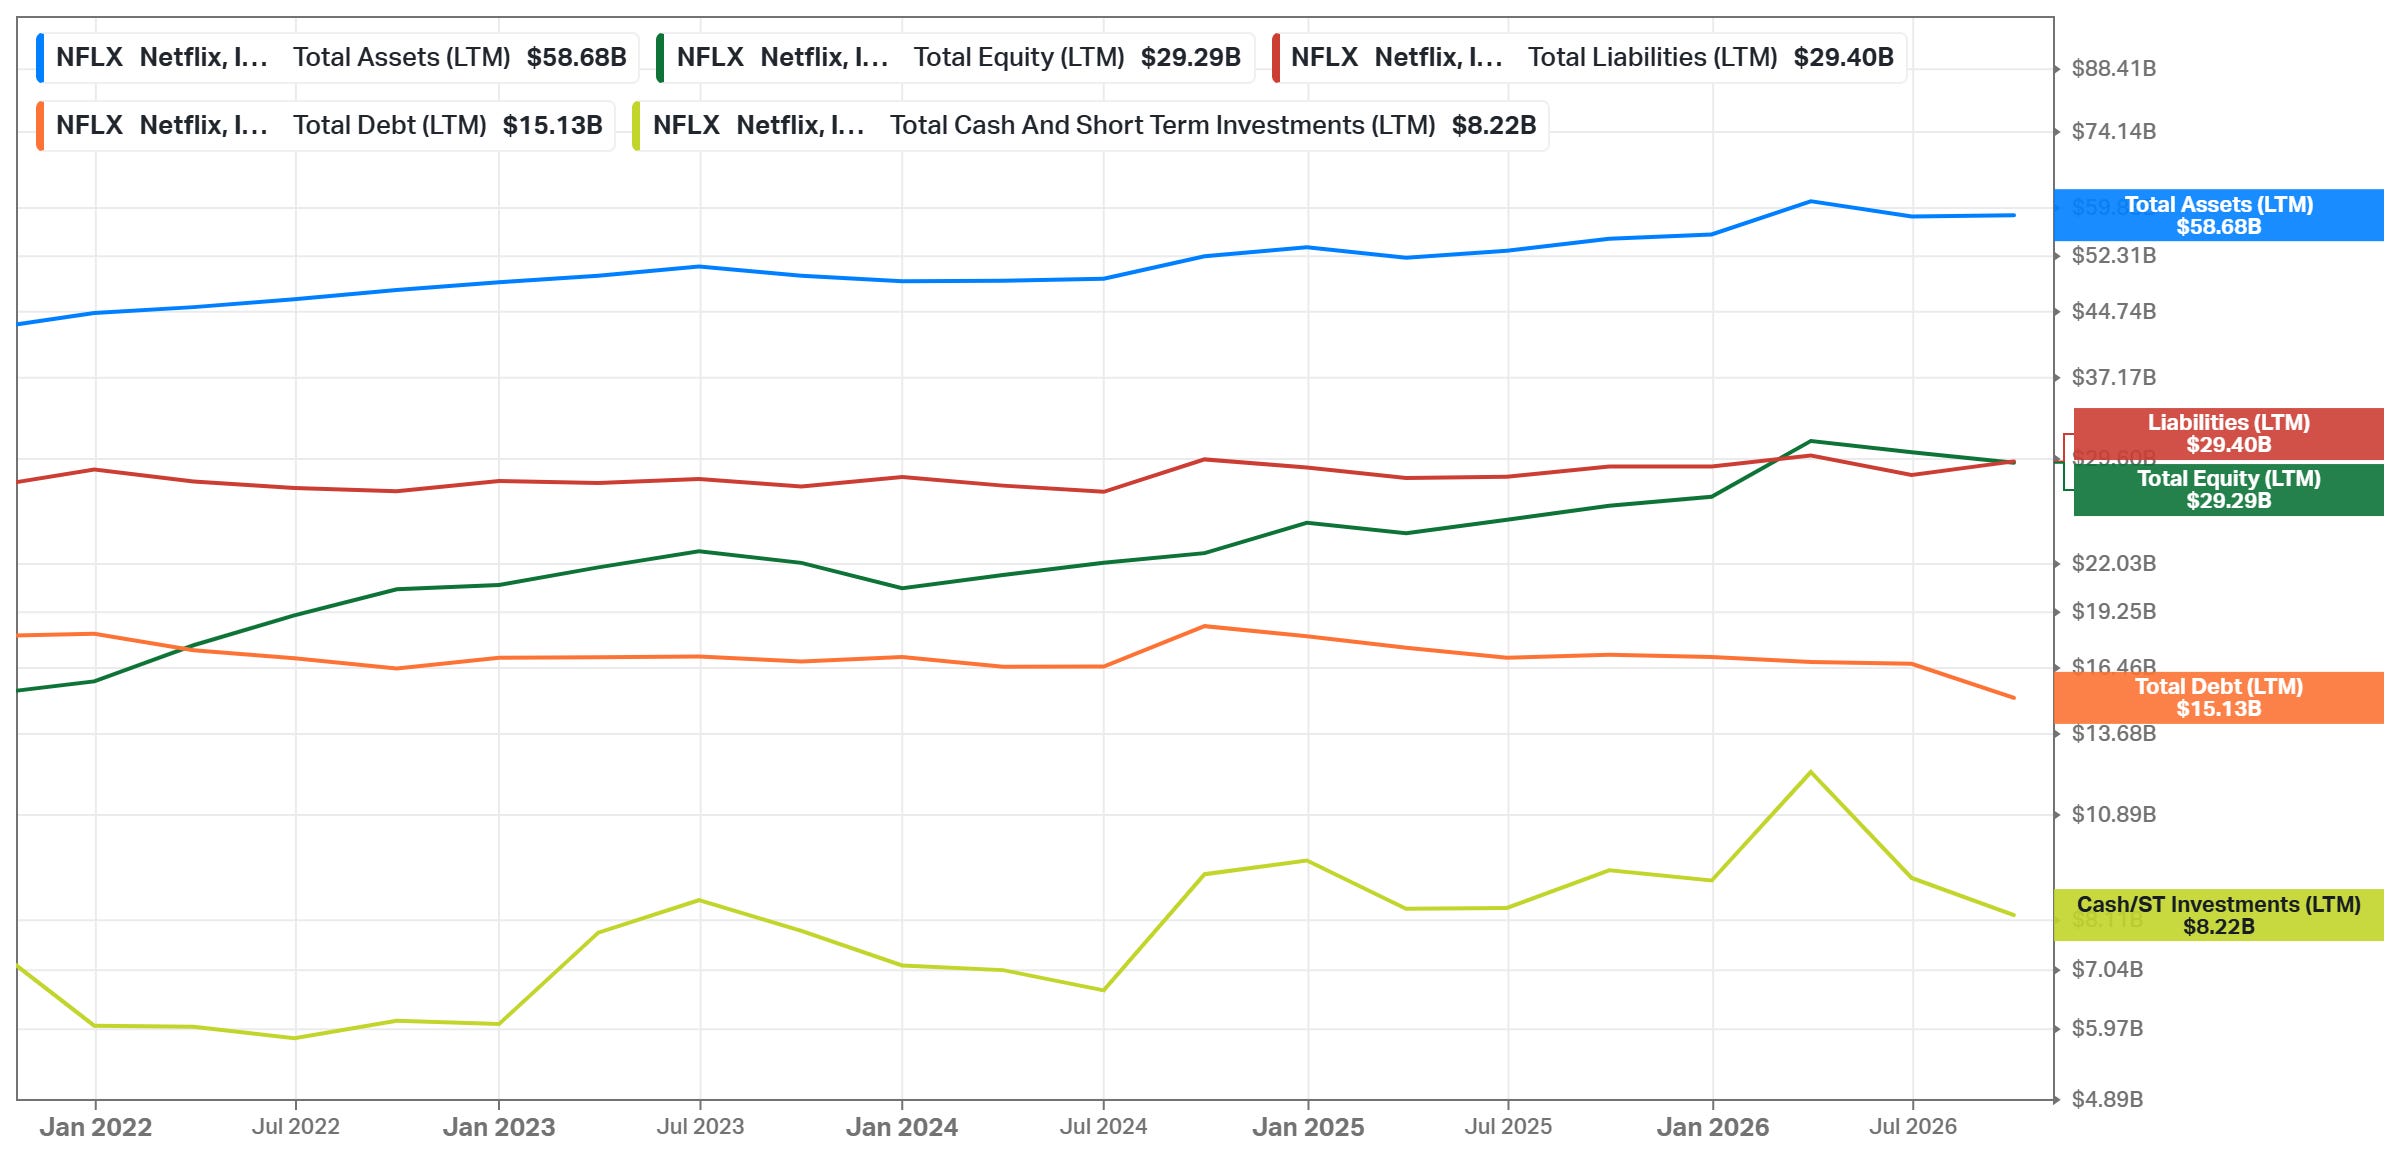
Net debt is only 2.5% of the market cap. At the end of Q3, Netflix had $8.22B of cash and short-term investments and $15.13B of debt, so net debt was $6.91B ($7.11B by Netflix's own measure, which adds back issuance costs and hedging adjustments). In July, it issued $1B of notes to repay the 4.375% notes due in Q4. Debt/Equity is 51.7% (5Y mean: 75.5%), Debt/Capital 34.07% (42.66%), and funds from operations (FFO) cover interest expense 14.4x (8.6x).
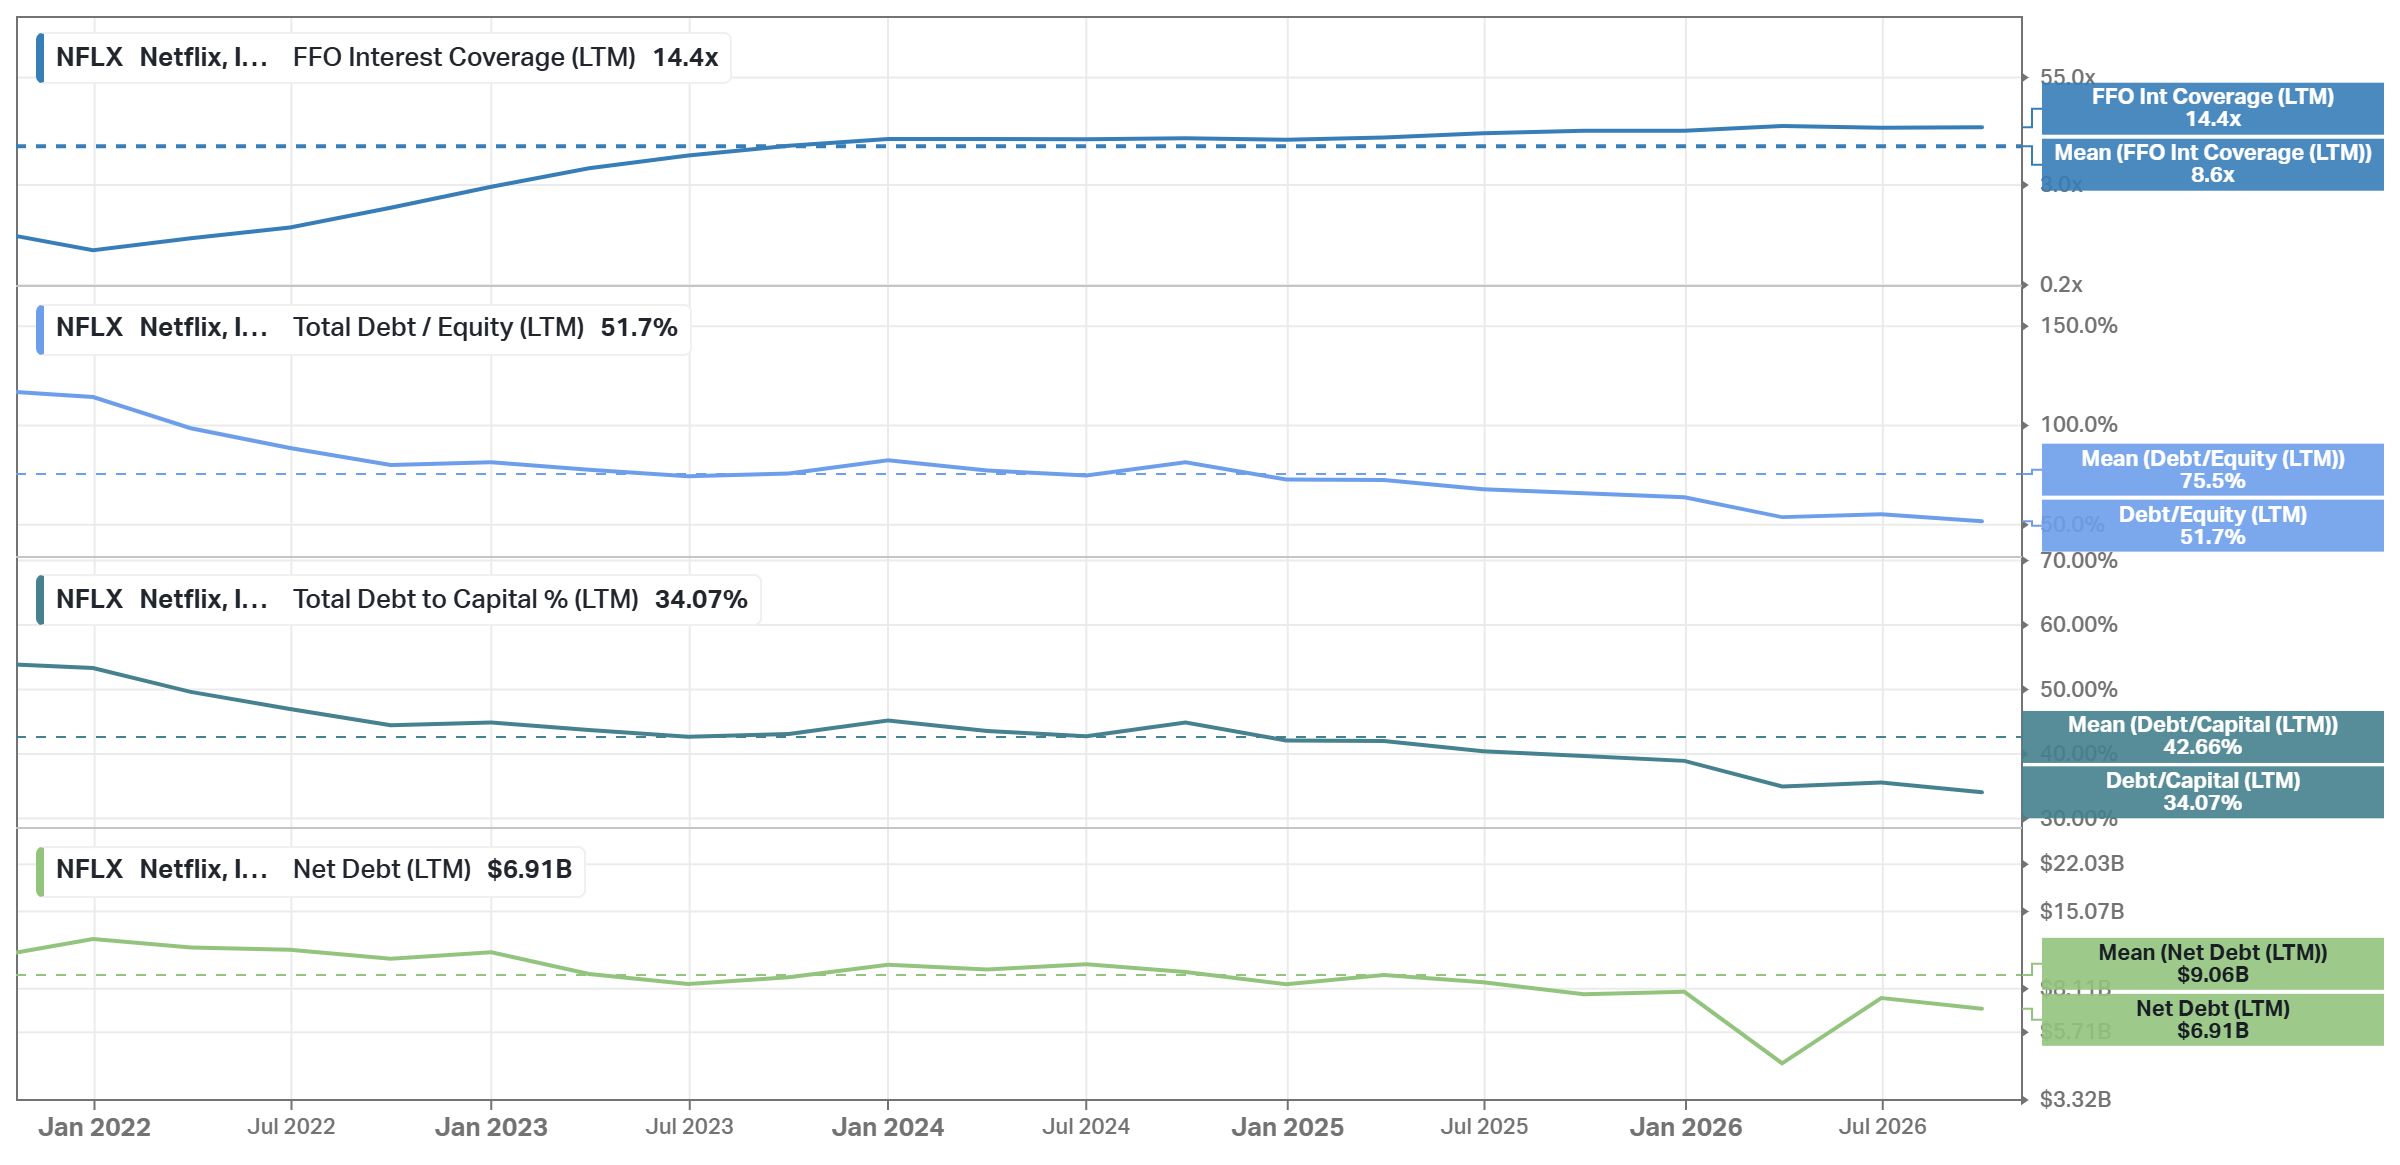
Worth noting that content obligations are larger than the debt. Total streaming content obligations were $25.2B at the end of Q3, ~1.7x the debt, and part of them is not on the balance sheet. They are commitments for future titles, not borrowing, but they are fixed costs that Netflix pays regardless of engagement. In the first 9 months, cash spent on content was 1.17x its amortization, against the ~1.1x that Netflix targets for the full year.
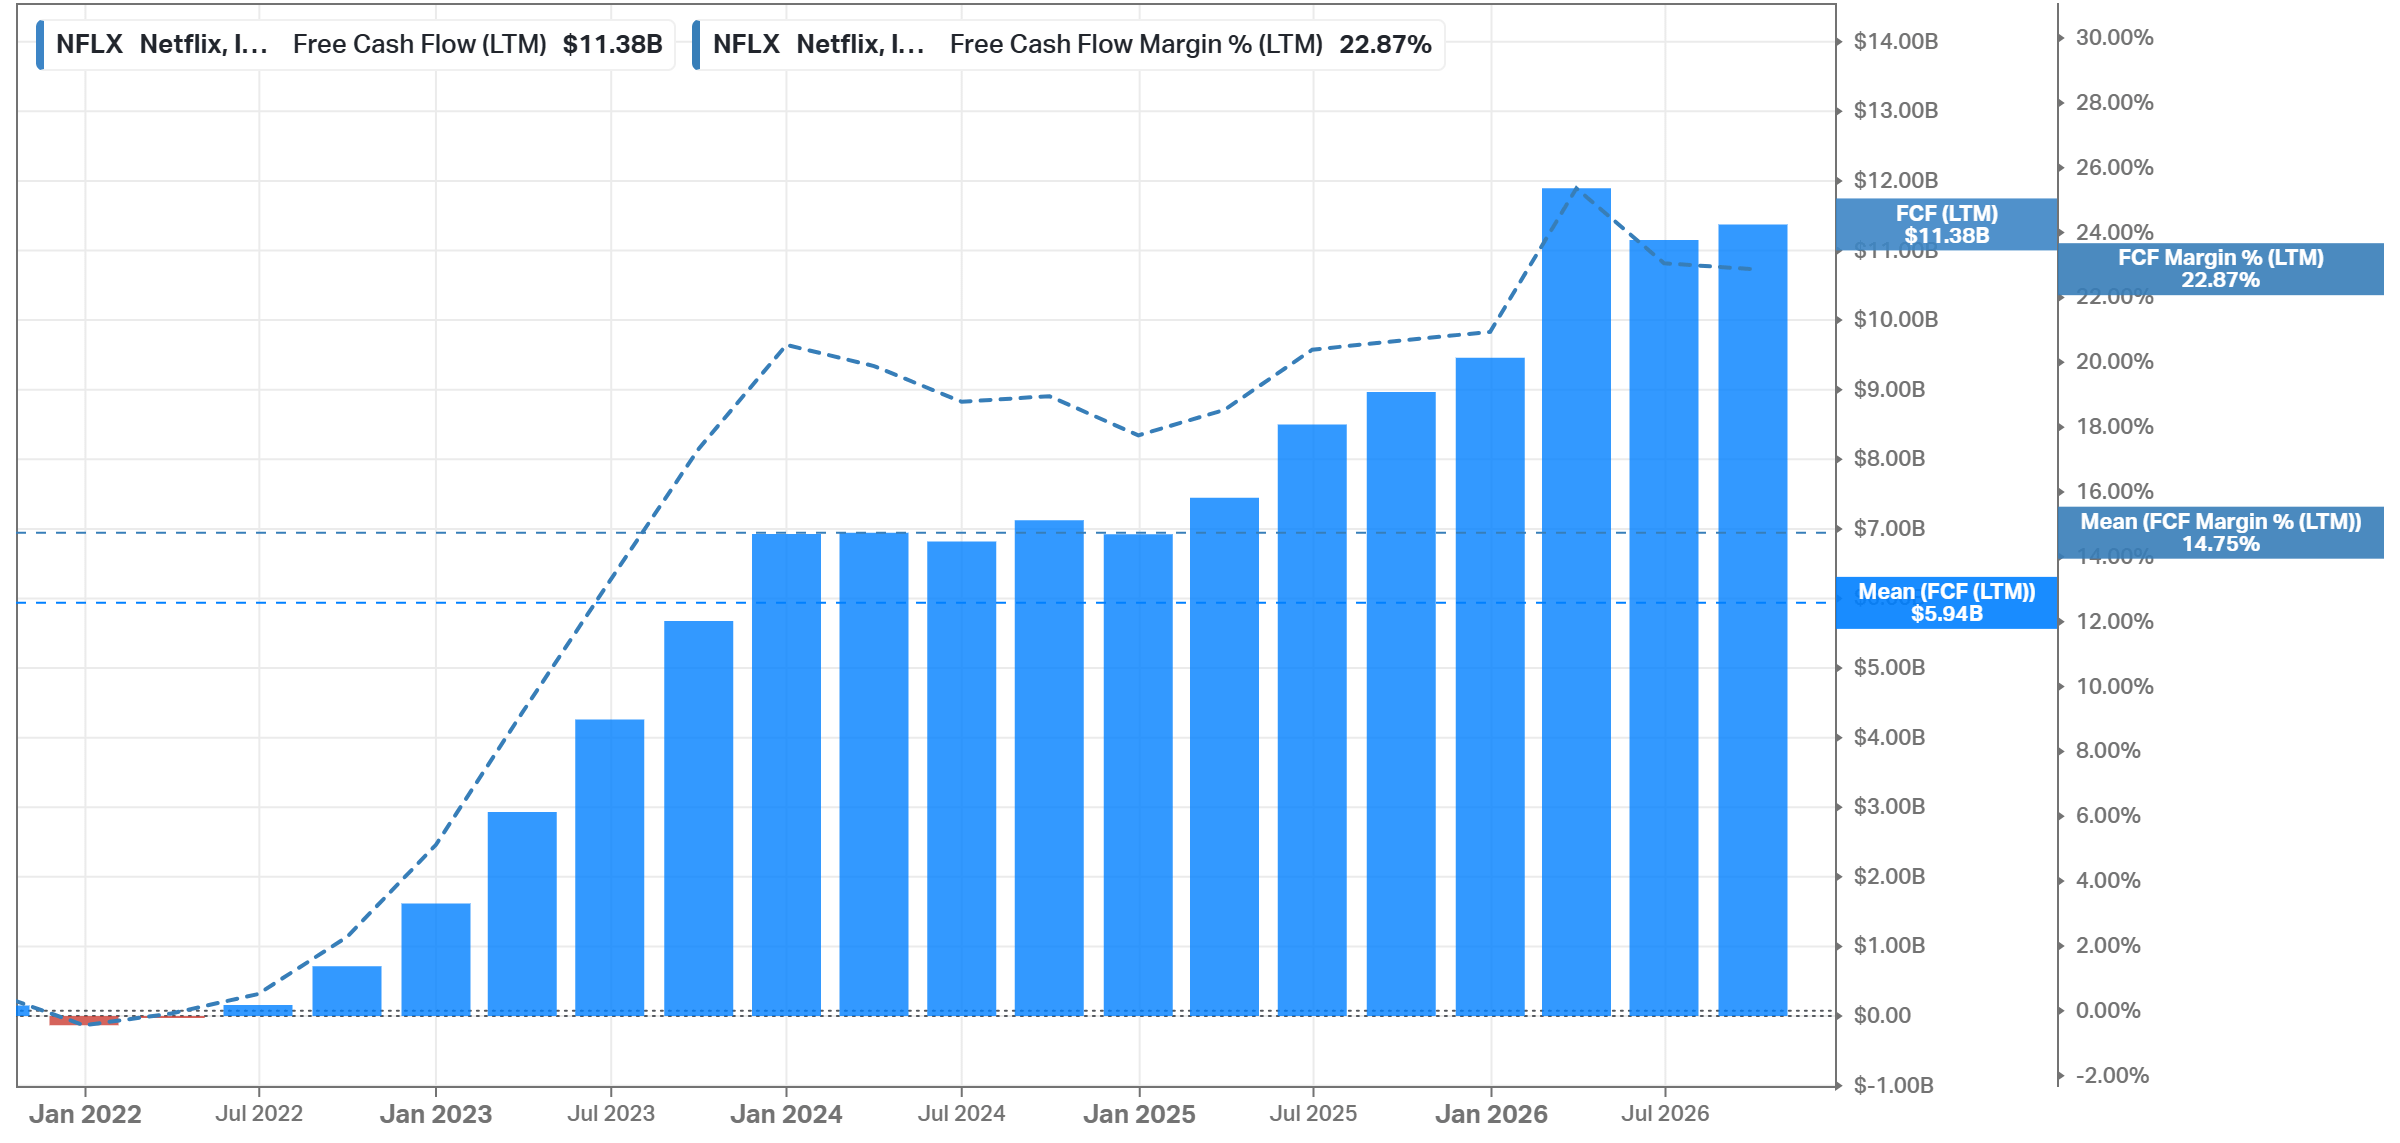
FCF increased from -$0.13B in 2021 to $9.46B in 2025, and to $11.38B over the last 12 months, a 22.87% margin against a 14.75% 5Y mean. For 2026, Netflix expects ~$12.0B, including the fee. In April, the forecast was $12.5B. The cut is mainly a real estate transaction that Netflix expects to close in Q4. 2026 also includes a ~$0.7B deposit in a tax dispute in Brazil, which Netflix expected in 2025 and paid in Q1 2026. So 2025 FCF looks ~$0.7B better than it was, and 2026 ~$0.7B worse.
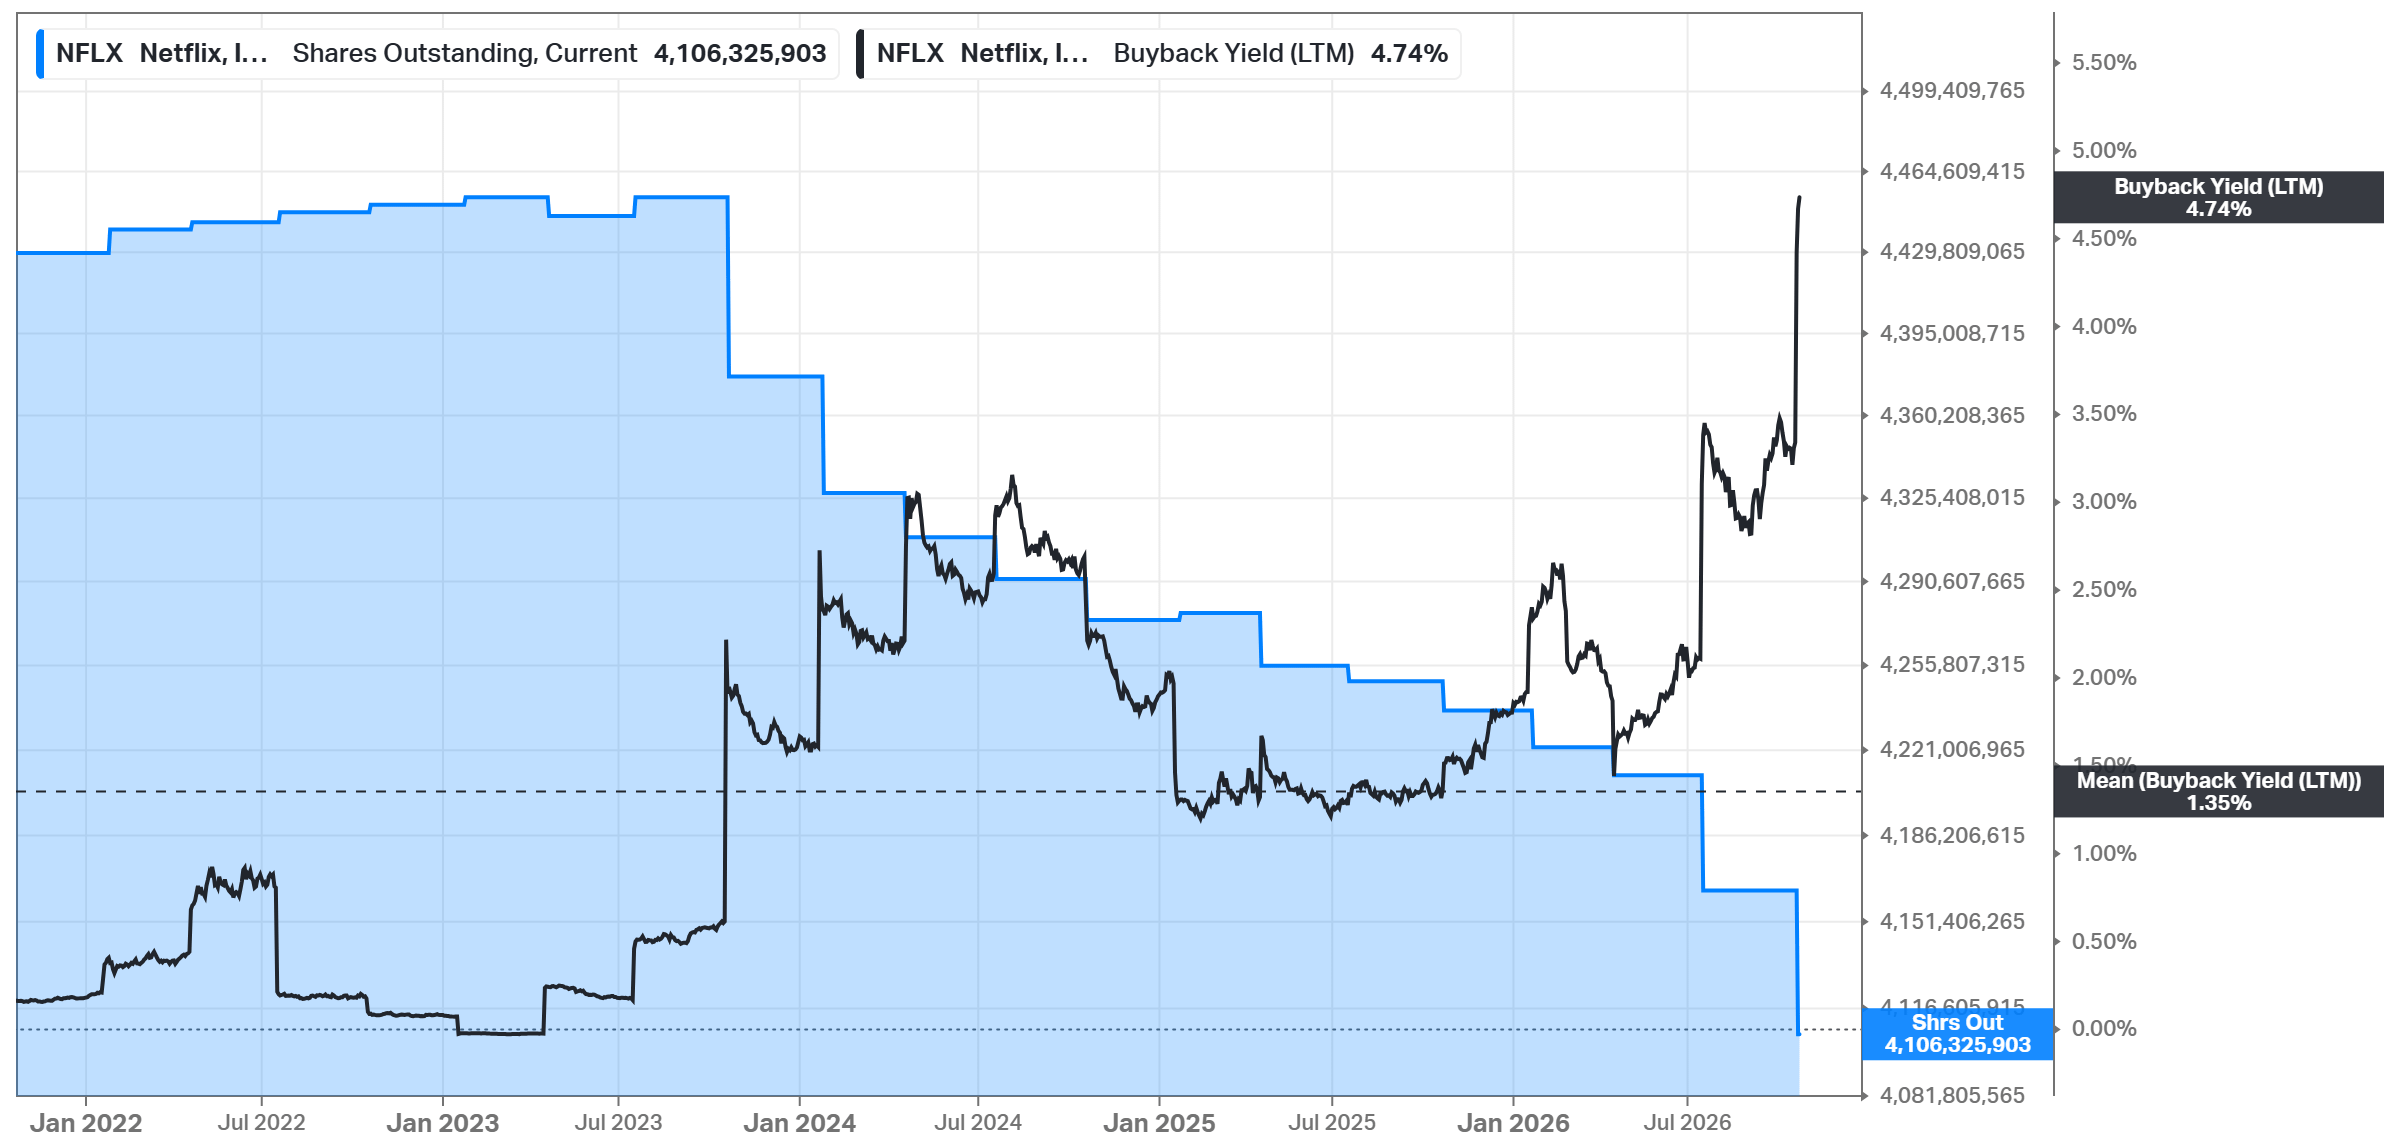
The buybacks are now the main use of cash. Netflix paused them during the Warner Bros. deal and restarted them after it walked away. In the first 9 months of 2026, it bought 130.3M shares for $10.78B (3.2% of the shares outstanding) at an average of ~$83. The price paid decreased each quarter: ~$94 in Q1, ~$89 in Q2, and ~$75 in Q3. In April, the board authorized another $25B, and $22.3B is still available, 8.1% of the market cap. The diluted share count decreased 3.3% YoY, and the LTM buyback yield is 4.74%, against a 1.35% 5Y mean. Netflix pays no dividend.
Over the last 12 months, buybacks of $12.86B were 113% of FCF, and Netflix financed the difference with cash. Cash decreased from $12.26B at the end of March to $8.19B. In my view, this is fine at today’s leverage, but the pace cannot continue without more debt. At ~$11-12B of yearly FCF without the fee and the deposit, the sustainable buyback is ~4% of today’s market cap per year.
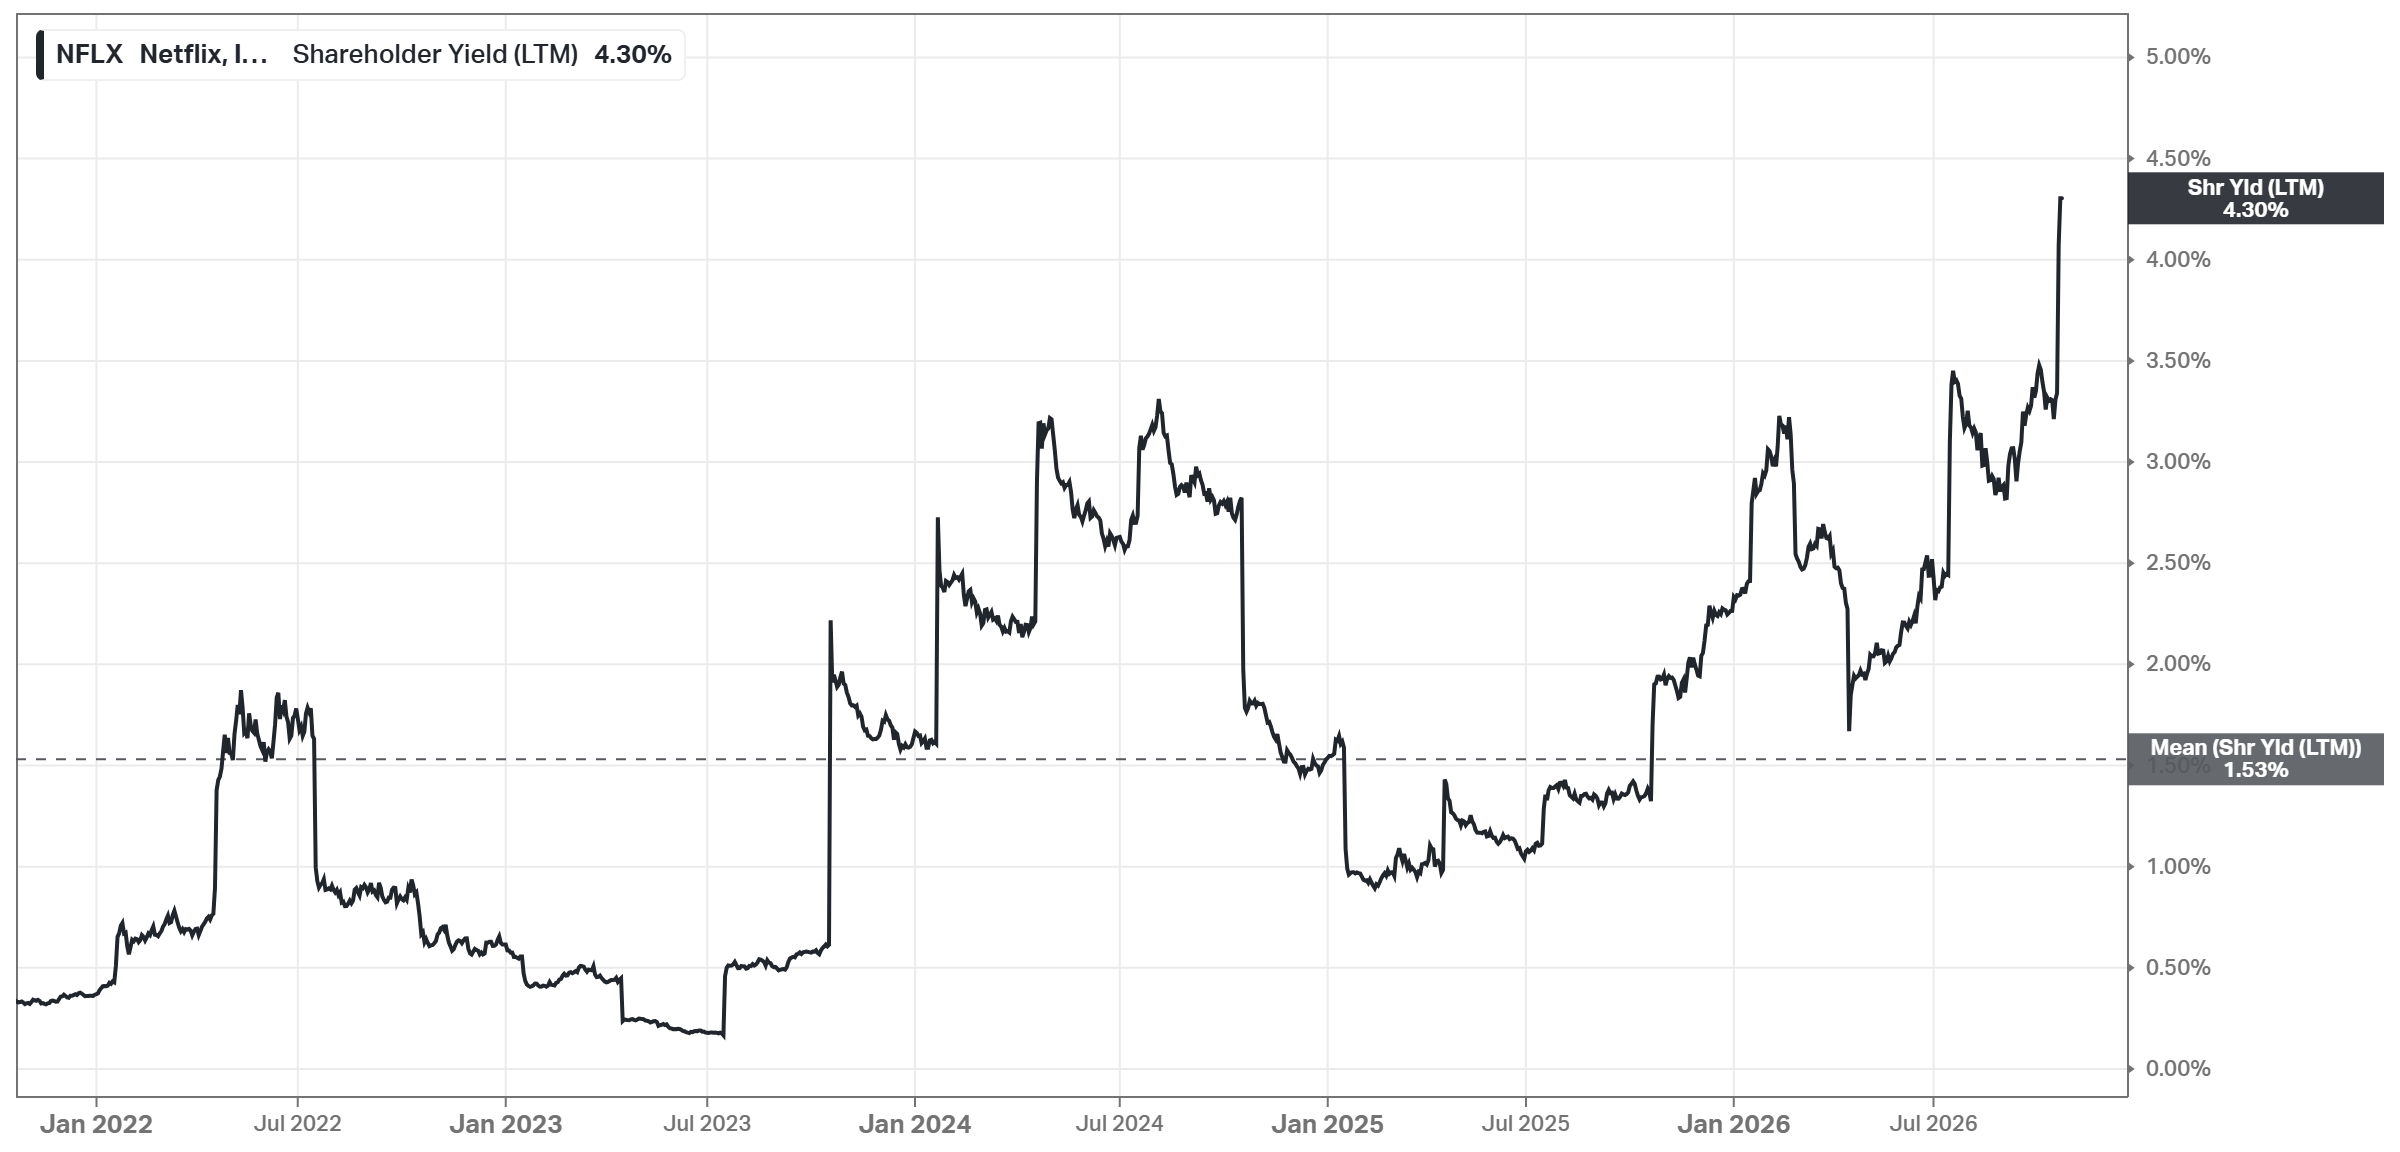
The shareholder yield, which also counts debt, is 4.3% (5Y mean: 1.53%). It is below the buyback yield, mostly because the $1B of July notes counts as new debt.
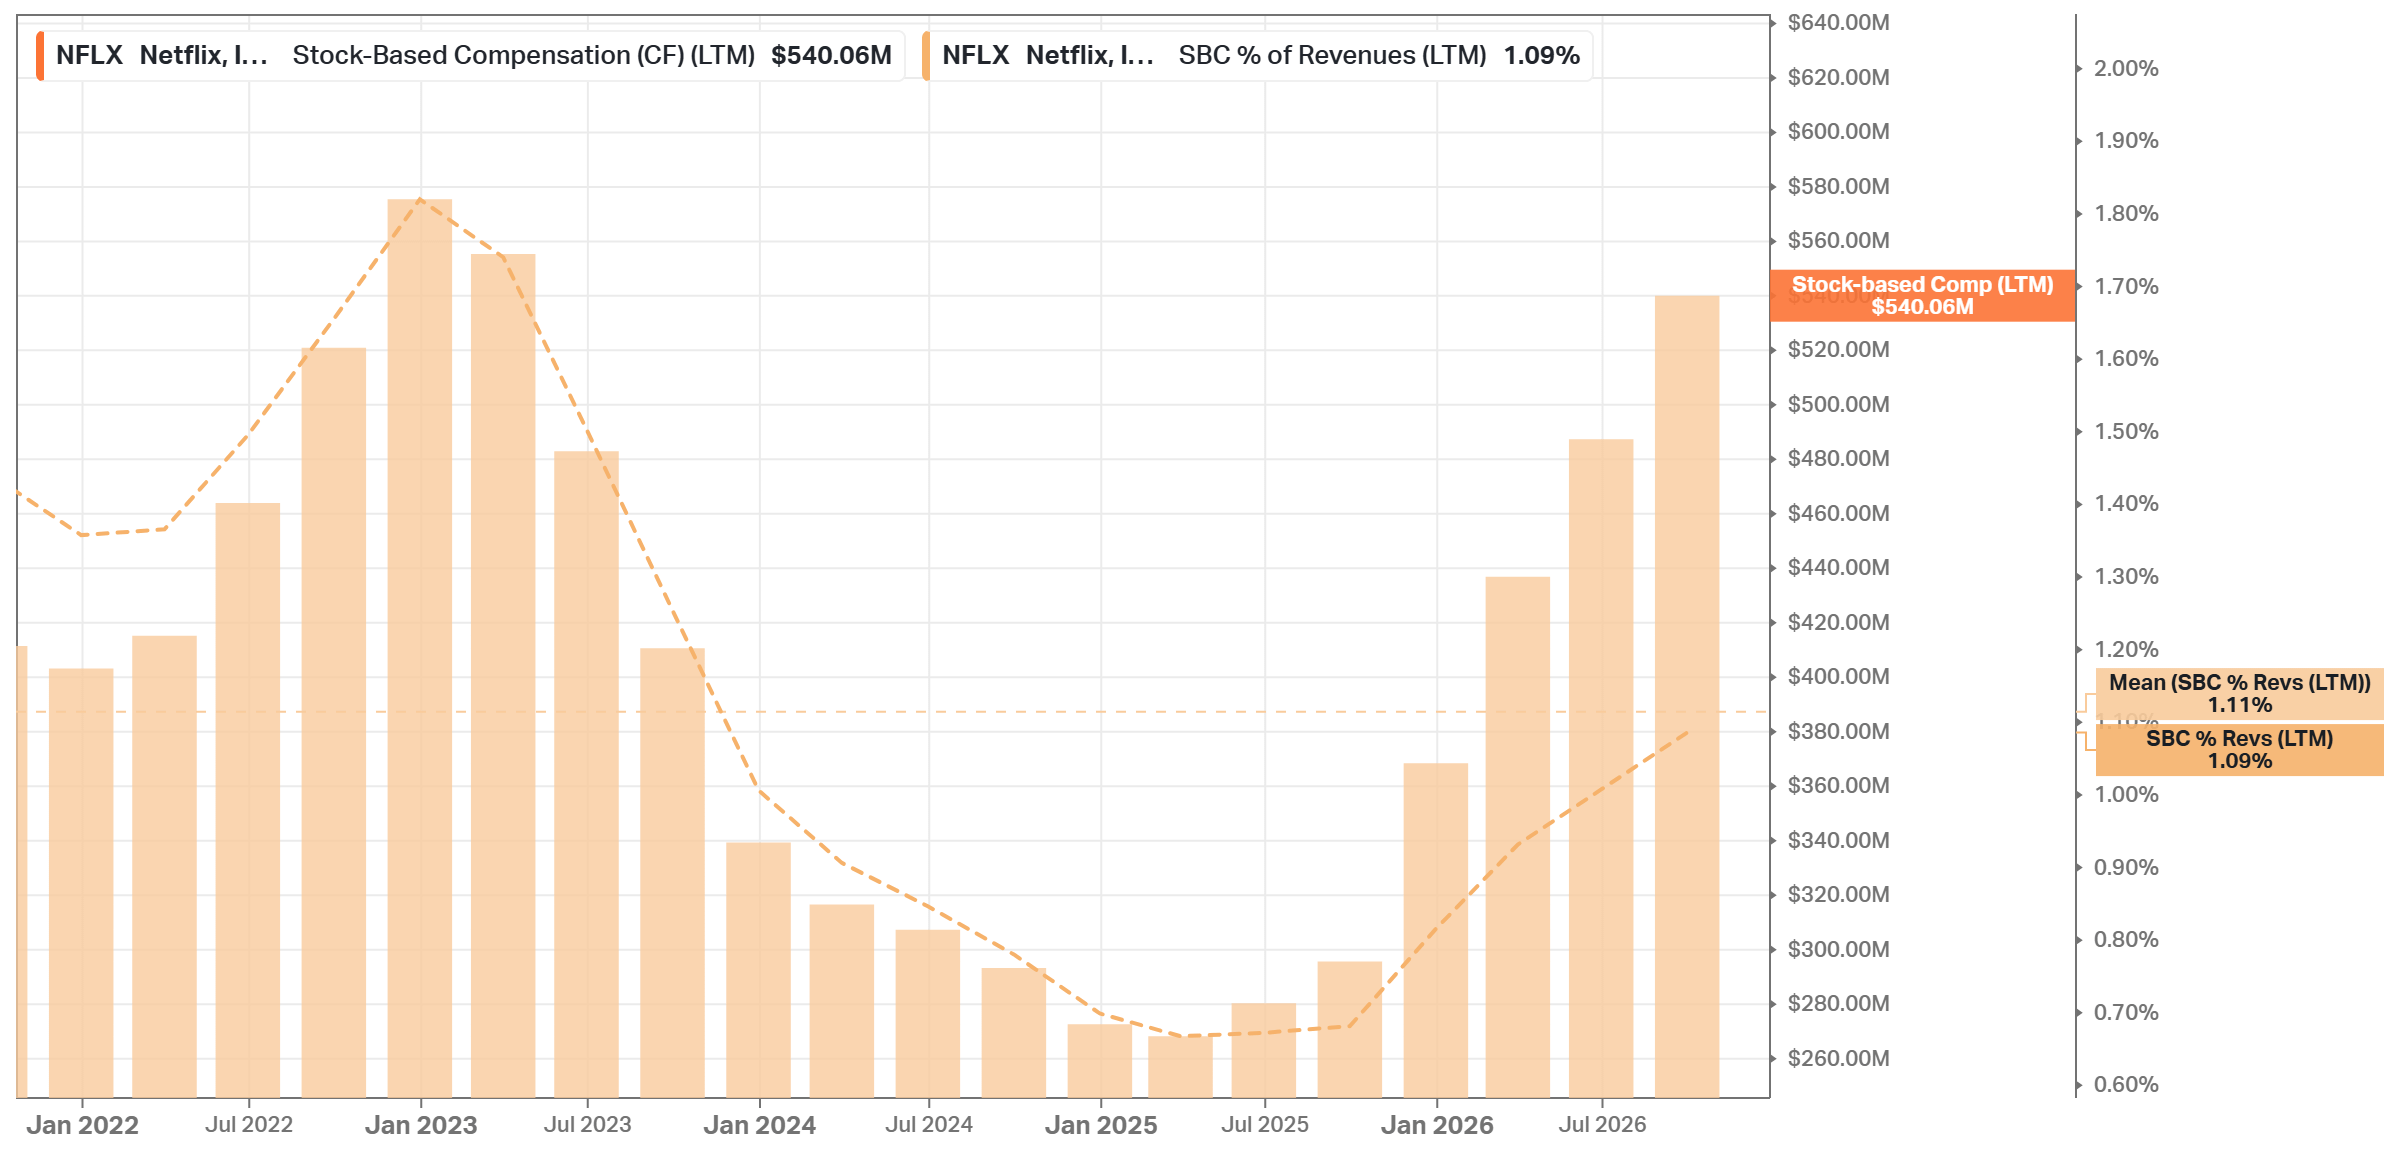
Stock-based compensation (SBC) is low, $540M over the last 12 months, or 1.09% of revenue, in line with its 1.11% 5Y mean. In the first 9 months of 2026, it increased 73% YoY, though, so it is a number to watch. Capex is small too, $933M over the last 12 months, or 1.9% of revenue, and it increased 55% in the first 9 months of 2026. Content is the real investment, and it goes through operating cash flow.
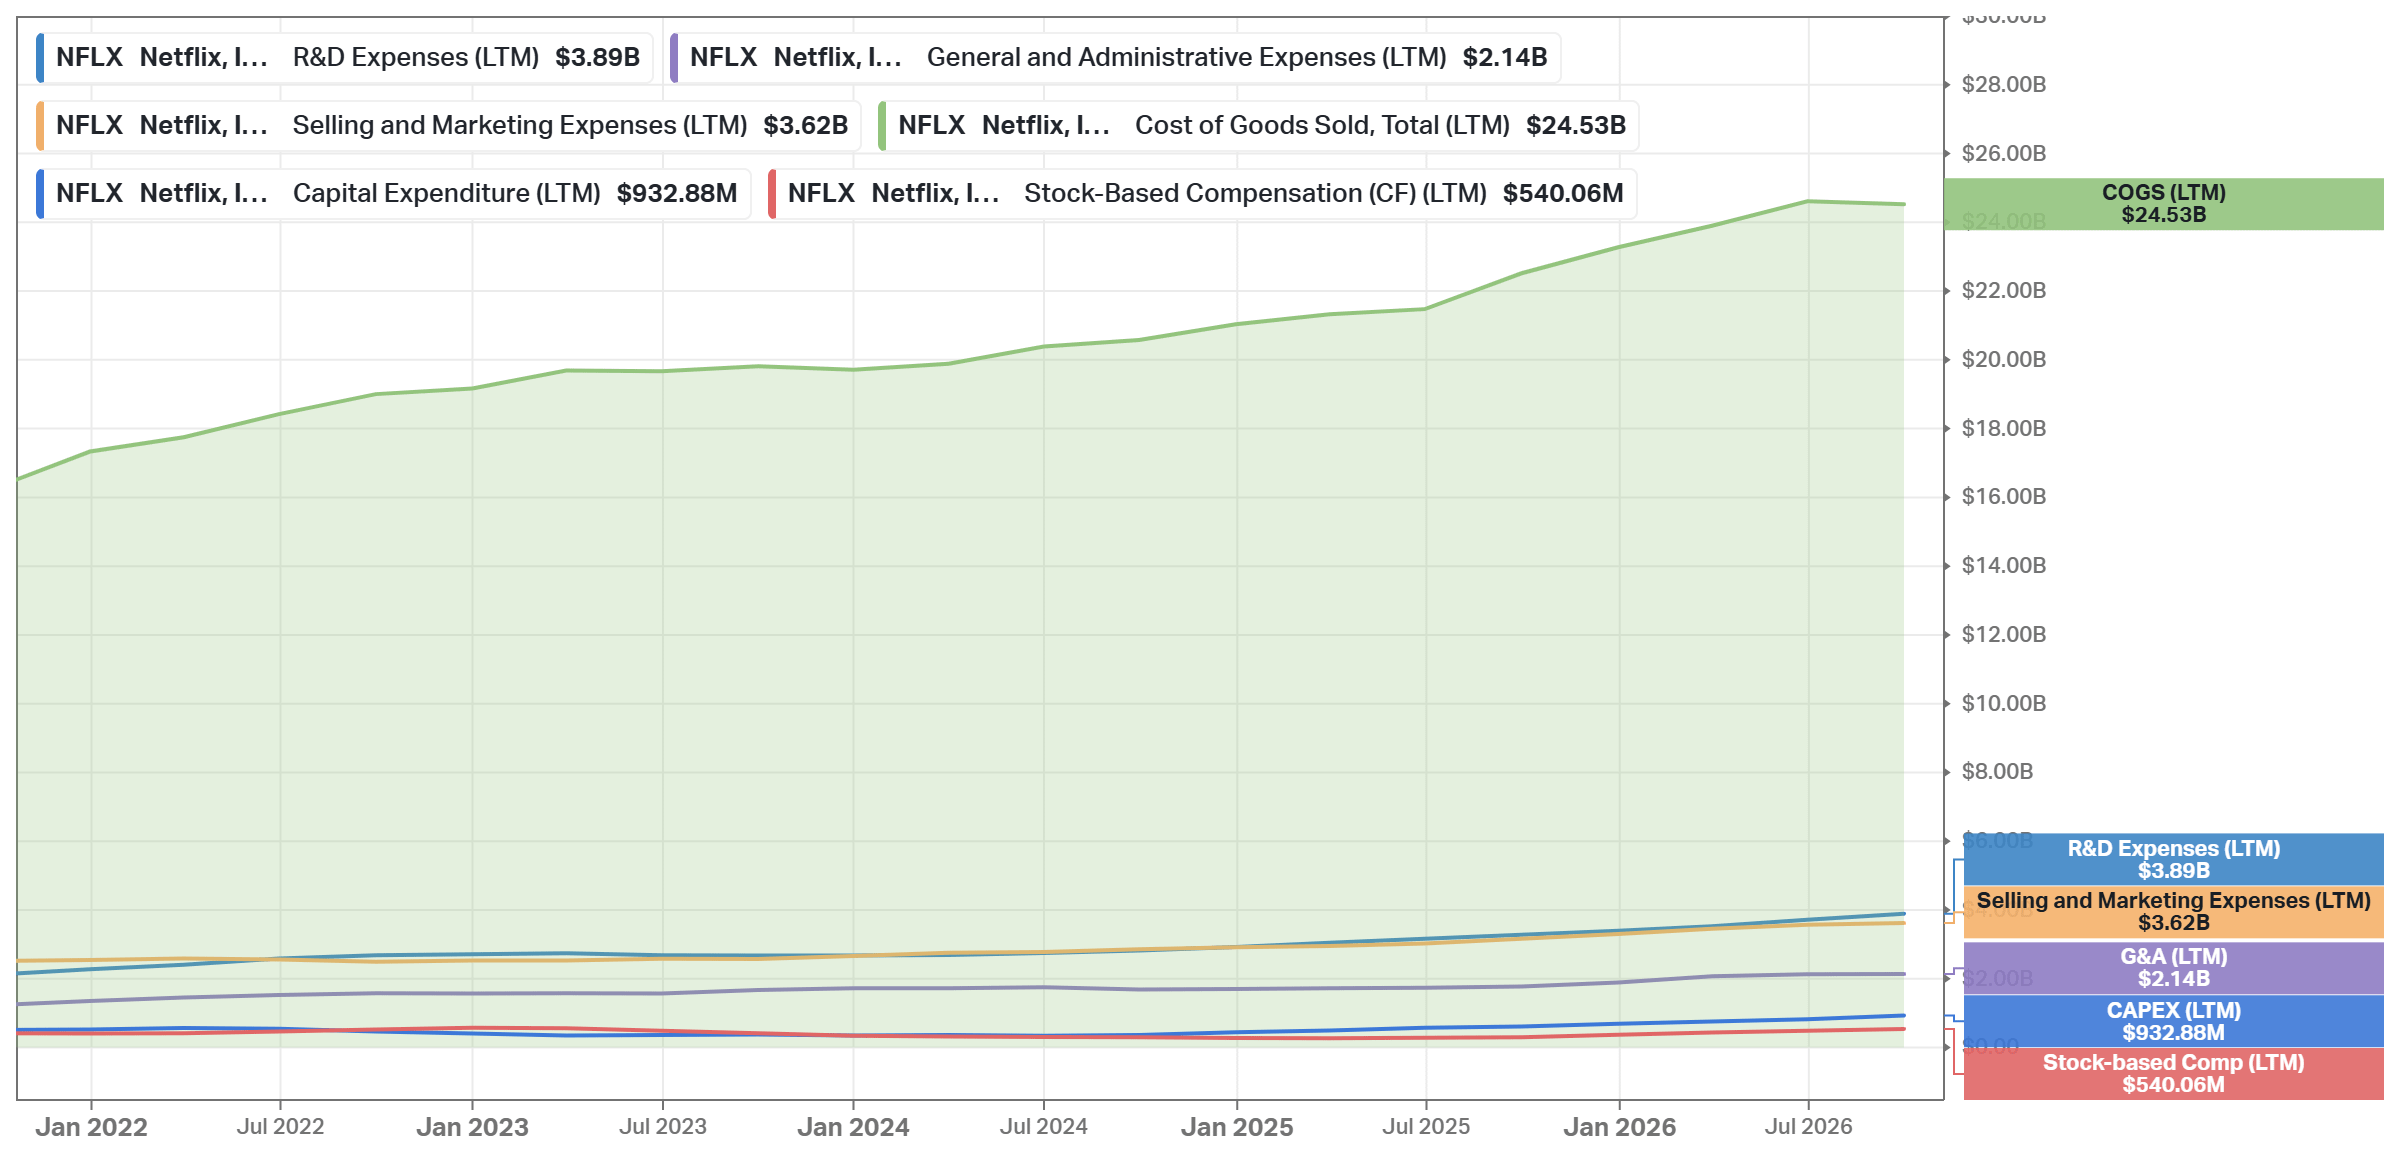
Technology and development is now the largest operating expense after content, $3.89B over the last 12 months (Koyfin shows it as R&D), against $3.62B for marketing and $2.14B for general and administrative costs. This is the line the October layoffs target.
In my view, the capital allocation in 2026 was disciplined on M&A, but the buybacks have not paid off yet. Netflix did not overpay for Warner Bros., collected $2.8B for the attempt, and kept leverage low. At the same time, the shares it bought this year at an average of ~$83 are worth ~$2.0B less at $67, and part of the money came from cash, not FCF. The guidance is credible - in each of the last 4 quarters, revenue matched or beat Netflix’s own forecast. The ad target is the exception. The question for 2027 is whether the buybacks continue at ~$67, where each dollar buys ~40% more shares than in Q1.

Advantages
Scale no streaming competitor matches. Over 325M paid memberships, ~$51B of revenue in 2026, and a ~$20B content budget spread across ~190 countries. The LTM operating margin is 31.3%.
Pricing power with lower churn. The 2026 price increases in the US, Mexico, Spain, and other markets went as Netflix expected, and churn improved YoY globally and in the US.
FCF that pays for large buybacks. LTM FCF of $11.38B, $12.86B of buybacks in 12 months, and net debt of only 2.5% of the market cap.
Local content that travels. More than a third of viewing is non-English. In India, a strong slate increased view hours 24% and revenue ~18% F/X neutral, with the largest quarter of paid net additions there ever.
Ads as a second growth line. ~$2.7B in 2026 (~80% growth), 15 new ad countries in 2027, and, as management says, a narrowing gap between the revenue per member of the ad tier and of the standard plan.
Disadvantages
Engagement barely grows. View hours increased 2% in H2 2025 and 2% in H1 2026. From 2027, Netflix will report them only once a year.
US growth is now mostly price. Revenue in the US and Canada grew 18% in Q4 2025, then 14%, 10%, and 11% in Q3 2026. Q3 was the first full quarter of the March price increase (+8-12.5% by plan), so most of the 11% is price, by my estimate. It is the largest region (44% of revenue) and the most penetrated one.
The ad business misses its own targets. The 2026 forecast decreased from ~$3B to ~$2.7B, and management explains it by delays in its own product rollout.
Leadership turnover. The co-founder left the board, the content chief and the film chief were replaced, and ~1,000 employees were let go, all within 6 months.
The margin expansion slowed. Without one-offs, the 2026 operating margin increases ~0.9 points, against ~2.5 points a year in 2020-2025. Live programming takes just over 5% of the content spend for ~1% of view hours.
What the bears get right: Netflix now grows mostly by price, ads, and new members outside the US, not by more viewing. In the US, the March price increase explains most of the 11% growth in Q3. If view hours stay flat, every price increase has to be justified by better content, and the US slate is exactly what management wants to fix. YouTube competes for the same screen with content it does not fund upfront. And the 2027 consensus (+24% EPS without the fee) needs the margin expansion to return to ~2 points or more, while the content that will be amortized in 2027 is already growing faster than revenue. If it stays at ~1 point a year, EPS grows ~17% a year, not 20%.
Competitors
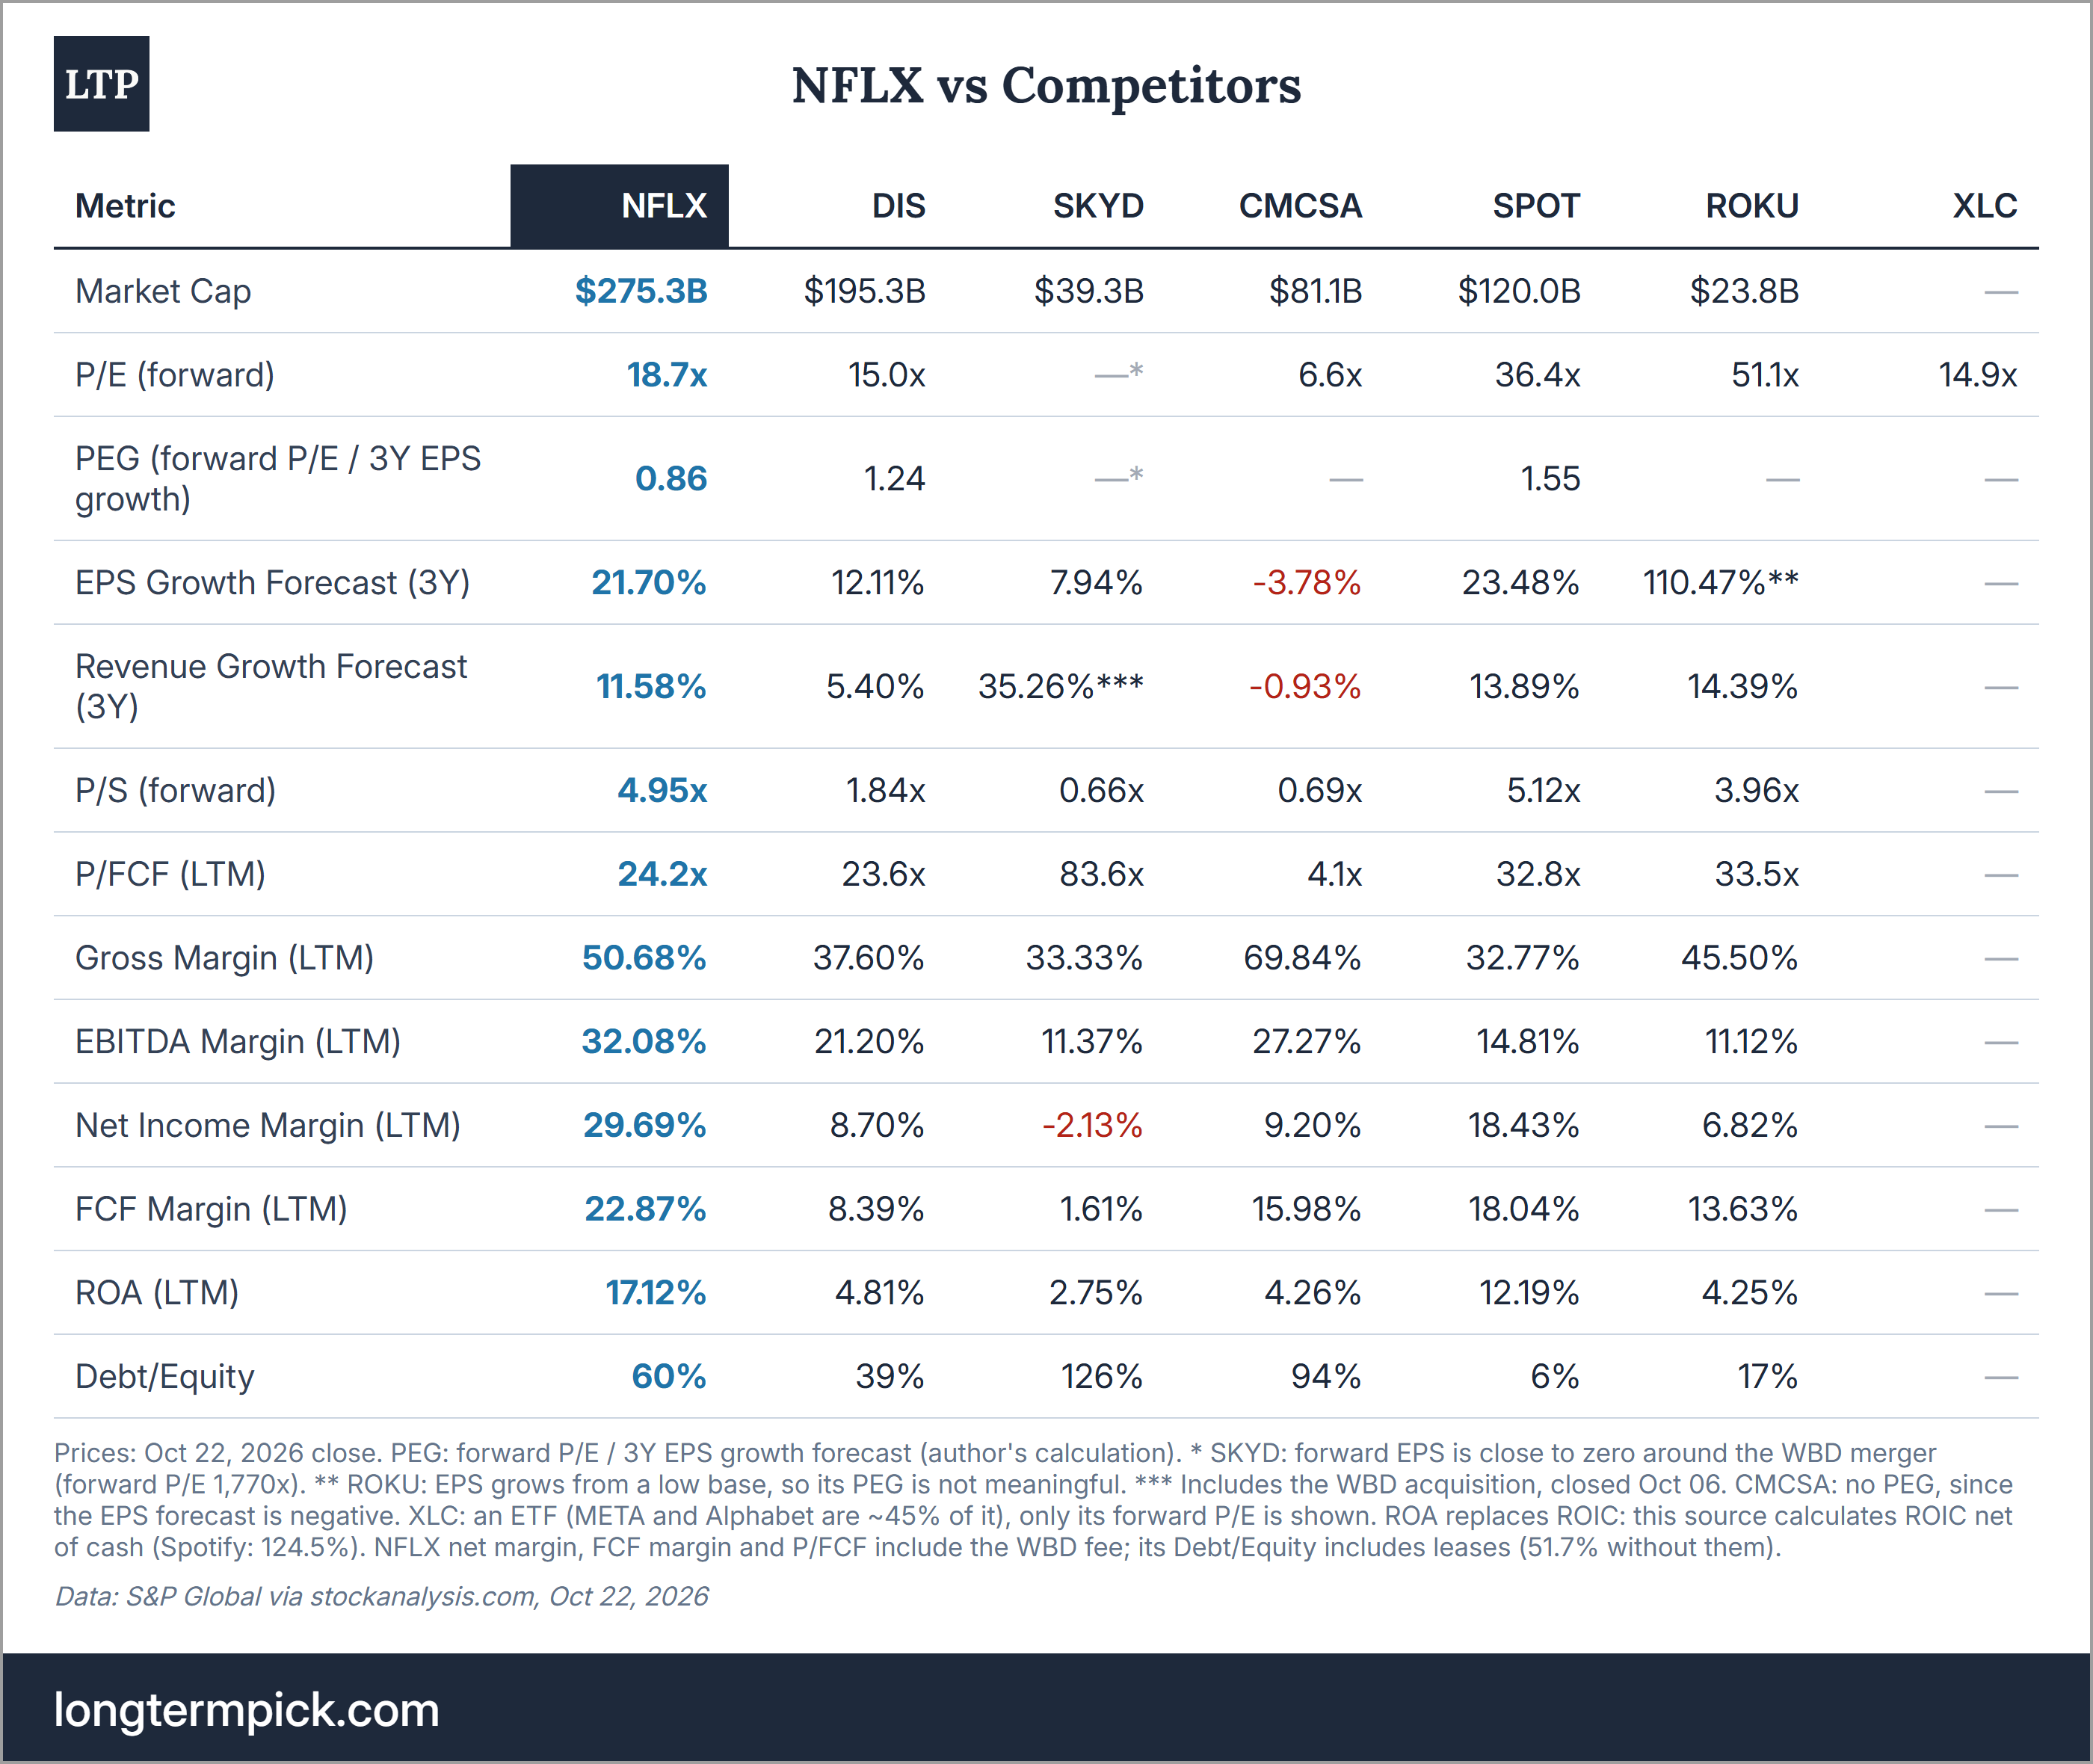
I compare Netflix with 5 companies. Disney (DIS) has the closest streaming business (Disney+ and Hulu) plus parks and TV networks. Skydance (SKYD) owns Paramount+ and, since Oct 06, HBO Max. Comcast (CMCSA) owns Peacock. Spotify (SPOT) is the other large subscription platform that grows through price and ads. Roku (ROKU) sells TV streaming platforms and CTV advertising, so it competes with Netflix for the same ad budgets. YouTube is the main competitor for time, but Alphabet (GOOGL) is valued for search and cloud, so it is not in the table.
NFLX is not the cheapest stock here, but it is the cheapest for its growth. On the same S&P Global data and the Oct 22 close, NFLX trades at 18.7x forward earnings, above DIS, CMCSA, and XLC (14.9x), the sector benchmark, and far below SPOT (36.4x) and ROKU. The SKYD P/E is not meaningful, since Skydance has almost no forward EPS around the WBD merger. Growth explains most of the gap. Consensus expects 21.7% EPS growth per year for Netflix over the next 3 years, almost twice Disney’s rate, while Comcast’s EPS is expected to decline. Only Spotify and Roku, from a low base, are expected to grow faster. As a result, the PEG ratio is 0.86 for NFLX, against 1.24 for DIS and 1.55 for SPOT. Revenue is a different picture. Netflix’s 3Y revenue forecast (11.58% per year) is below Spotify’s and Roku’s, so more of its EPS growth has to come from the margin.
On margins and returns, Netflix leads every competitor. The LTM net margin is 29.69% (25.24% without the fee), against 18.43% for Spotify and 7-9% for Roku, Disney and Comcast. Netflix also has the highest EBITDA margin (32.08%) and ROA (17.12%) of the 6. Its FCF margin (22.87%) is the highest too, but it includes the fee, and without it, it is 17-20%, close to Spotify’s 18.04%. Only Comcast has a higher gross margin, but its EBITDA margin (27.27%) is lower. Debt/Equity of 60% (with leases) is higher than at Disney, Spotify and Roku, and lower than at Comcast (94%) and Skydance (126%). In streaming itself, the gap is clear from the companies’ own reports: Netflix’s 34.6% operating margin in Q3 against 12.9% for Disney’s streaming business and 13.5% for Spotify, while HBO Max, Paramount+, and Peacock report 14.5-16.6% on adjusted EBITDA.
In my view, Spotify is the next-best alternative. It is the only company here with similar expected growth, the same model (subscriptions plus an ad tier), and almost no debt (Debt/Equity 6%). At the same time, SPOT trades at ~2x the NFLX multiple (36.4x against 18.7x), and Netflix has higher margins and returns. DIS and CMCSA are cheaper, but Disney and Comcast are expected to grow EPS at about half the Netflix rate or less, and most of their profit comes from parks, TV networks, and broadband, not from streaming. As I see it, NFLX is the better choice of the two growth stocks at today’s prices. The discount reflects, in my view, the slower growth of Netflix’s viewing time, not weaker economics.
Past
Q3 2026 (ended Sep 30, all USD, YoY):
Revenue +12% to $12.87B (+11% F/X neutral), in line with consensus and with Netflix’s own forecast
Operating income +37% to $4.46B, and the operating margin 34.6% against 28.2%; without the Brazil tax charge in Q3 2025, +15% and +1.0 point
Net income +44% to $3.66B; diluted EPS +49% to $0.87, against the $0.82 consensus
Ad revenue +$256M YoY; FCF +8% to $2.88B
63.9M shares repurchased for $4.8B, the largest quarter of buybacks in Netflix’s history
LTM: revenue $49.73B (+14.65%), net income $14.77B ($12.55B without the fee), FCF $11.38B, and ROIC 27.69%
Why did NFLX fall after the report? In my order of importance:
The ad forecast. ~$2.7B instead of ~$3B for 2026. It is the largest miss against Netflix’s own plan, and it is the part the market pays for as future growth. Seaport Research cut its target over “delayed gratification” on ads (TheWrap’s summary).
The Q4 guidance. Revenue of $13.44B (+11.5%) against ~$13.5B expected, and EPS of $0.67, 8% below the S&P Global consensus of $0.73, partly because of the layoff costs. The 2026 revenue forecast of $51.1B is 0.2% below the midpoint of the earlier range.
Engagement. There was no new view hours number, and management said it is “not satisfied” with view hour growth.
At the same time, the quarter itself was solid. EPS beat consensus by 6%, revenue was in line, churn improved, and the full-year margin target held, including the layoff costs. Most analysts kept their ratings and cut their targets. The report reduced 2026 ad revenue by ~$300M (~0.6% of revenue) and the 2027 EPS consensus by 1-2%, while the stock lost ~5% of its value.
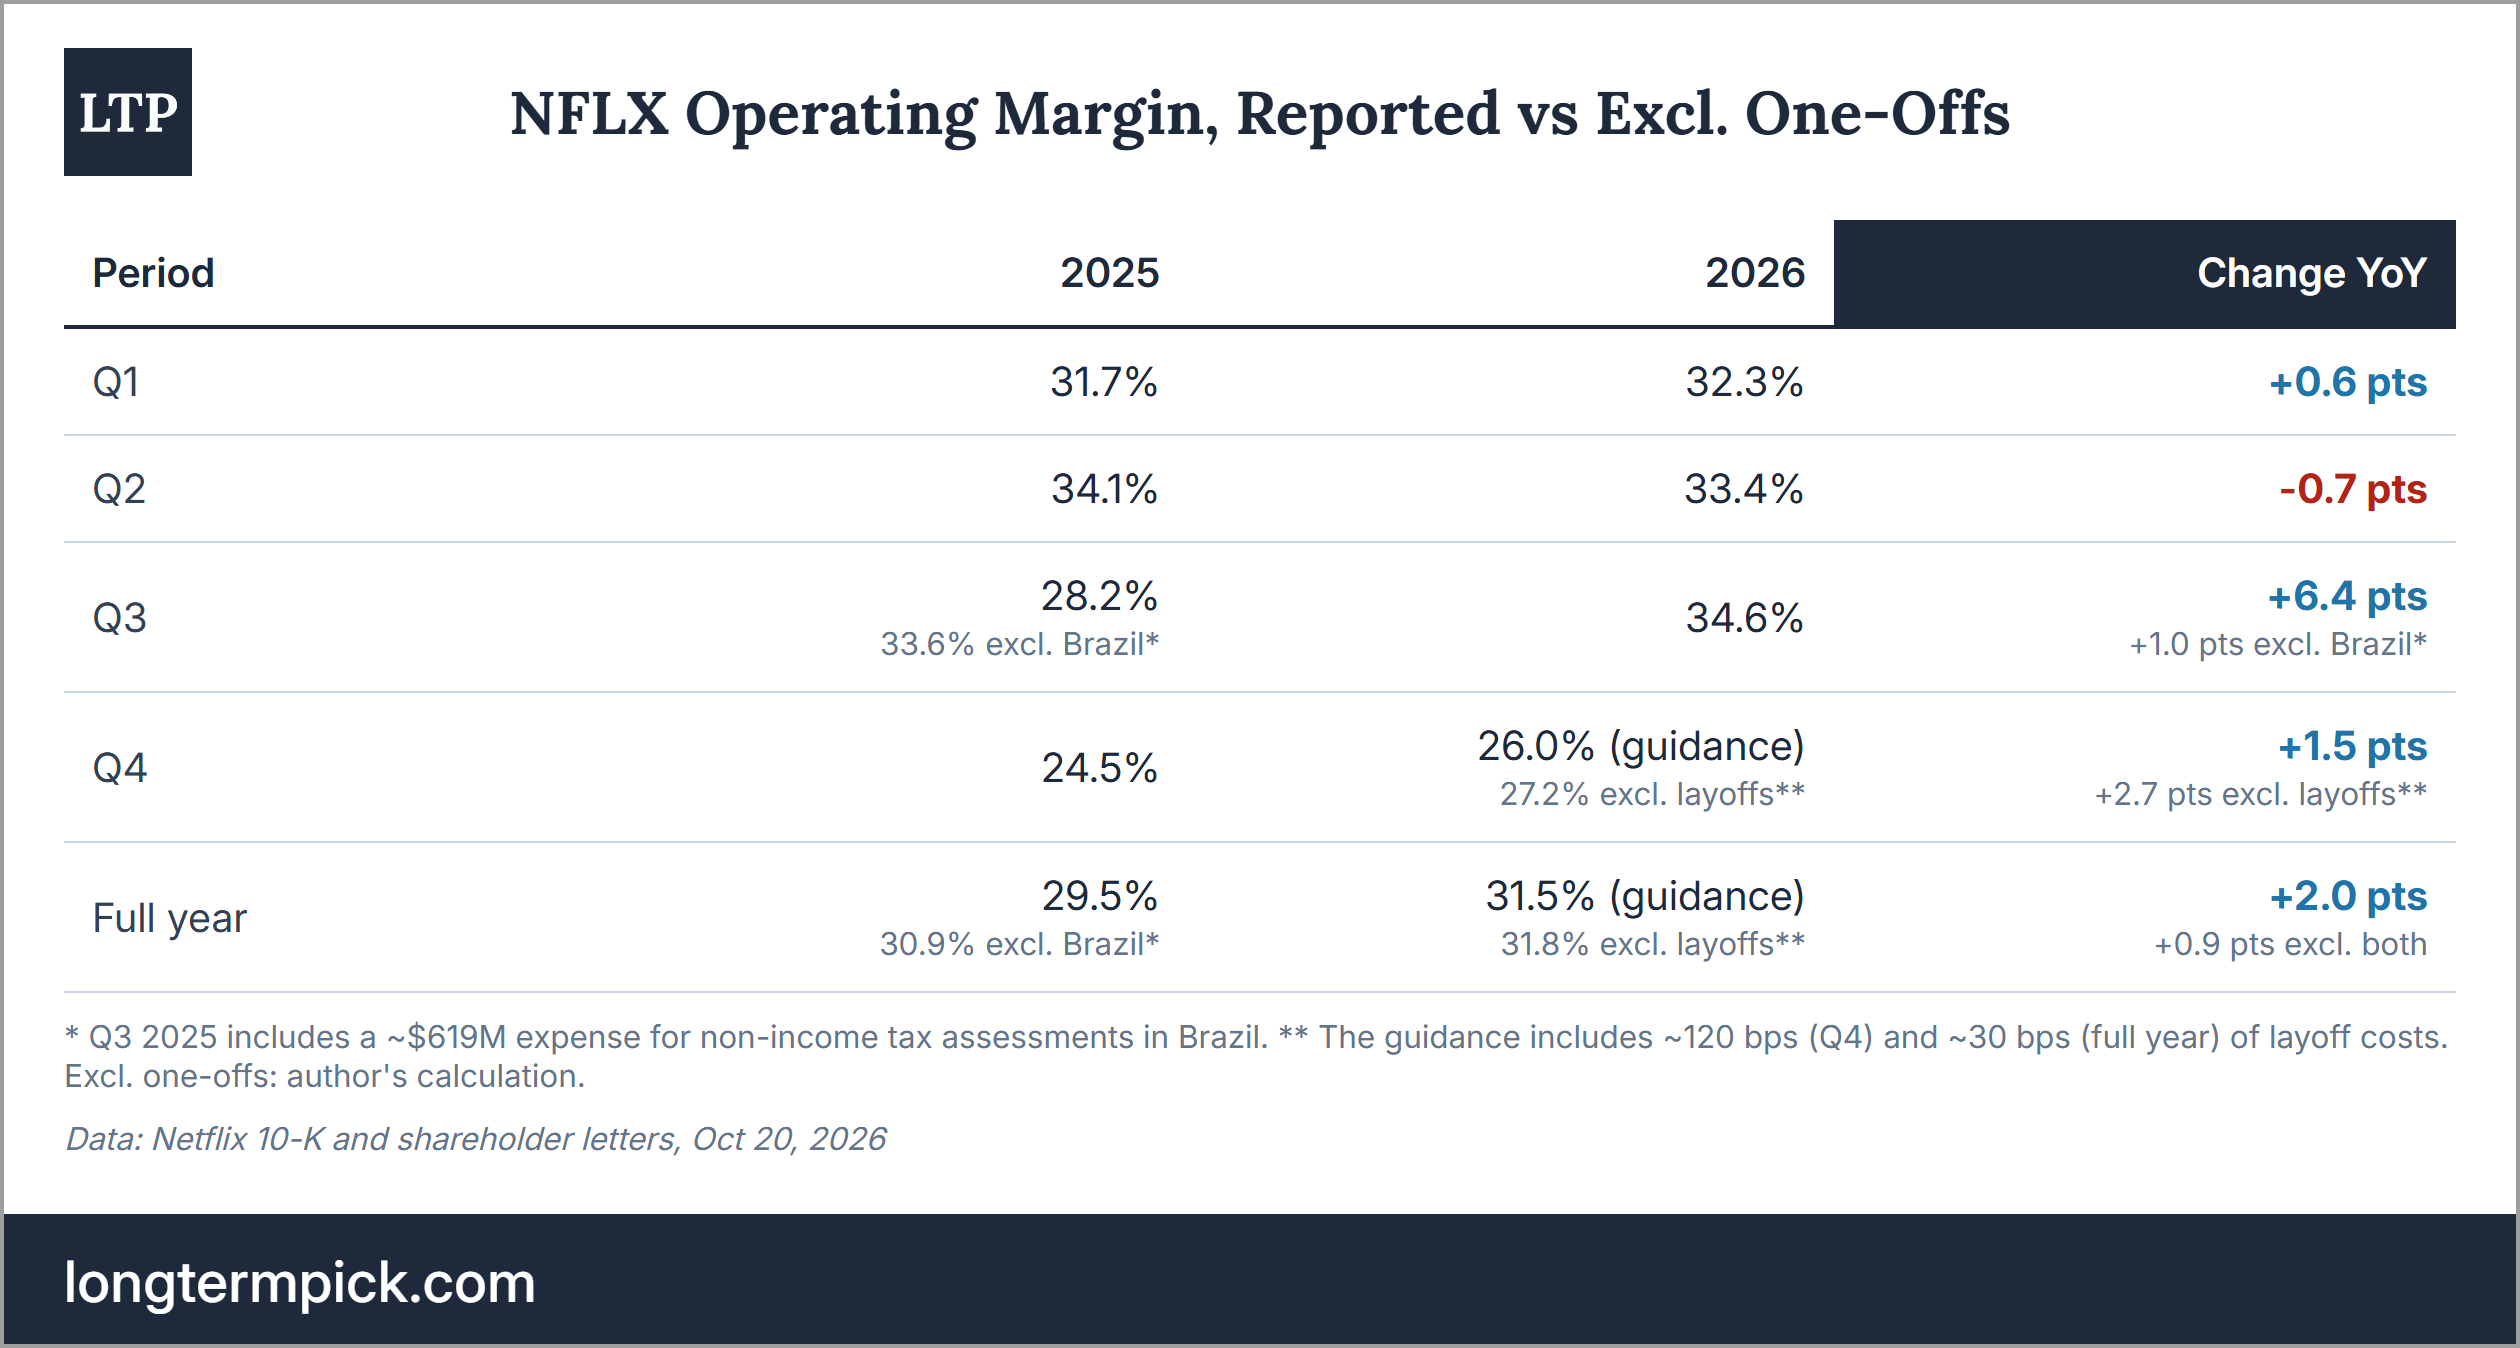
The table explains the +37%. For the full year, Netflix’s guidance gives ~0.9 points of margin expansion without one-offs, against the 2.0 points that the reported numbers show.
It was the third time this year. After the Q1 report, NFLX fell 9.7%, as the Q2 guidance was below expectations and Reed Hastings announced his exit from the board. After the Q2 report, it fell 7.3%, as the Q3 guidance was below expectations and Netflix moved its engagement report to once a year. Each time, revenue matched or beat Netflix’s own forecast, and each time, the outlook disappointed. Without the fee, Q1 EPS was ~$0.71, below the $0.76 consensus. Since the April 16 close, NFLX is down 38%. To compare, on Feb 27, after Netflix walked away from Warner Bros., NFLX gained 13.8%.
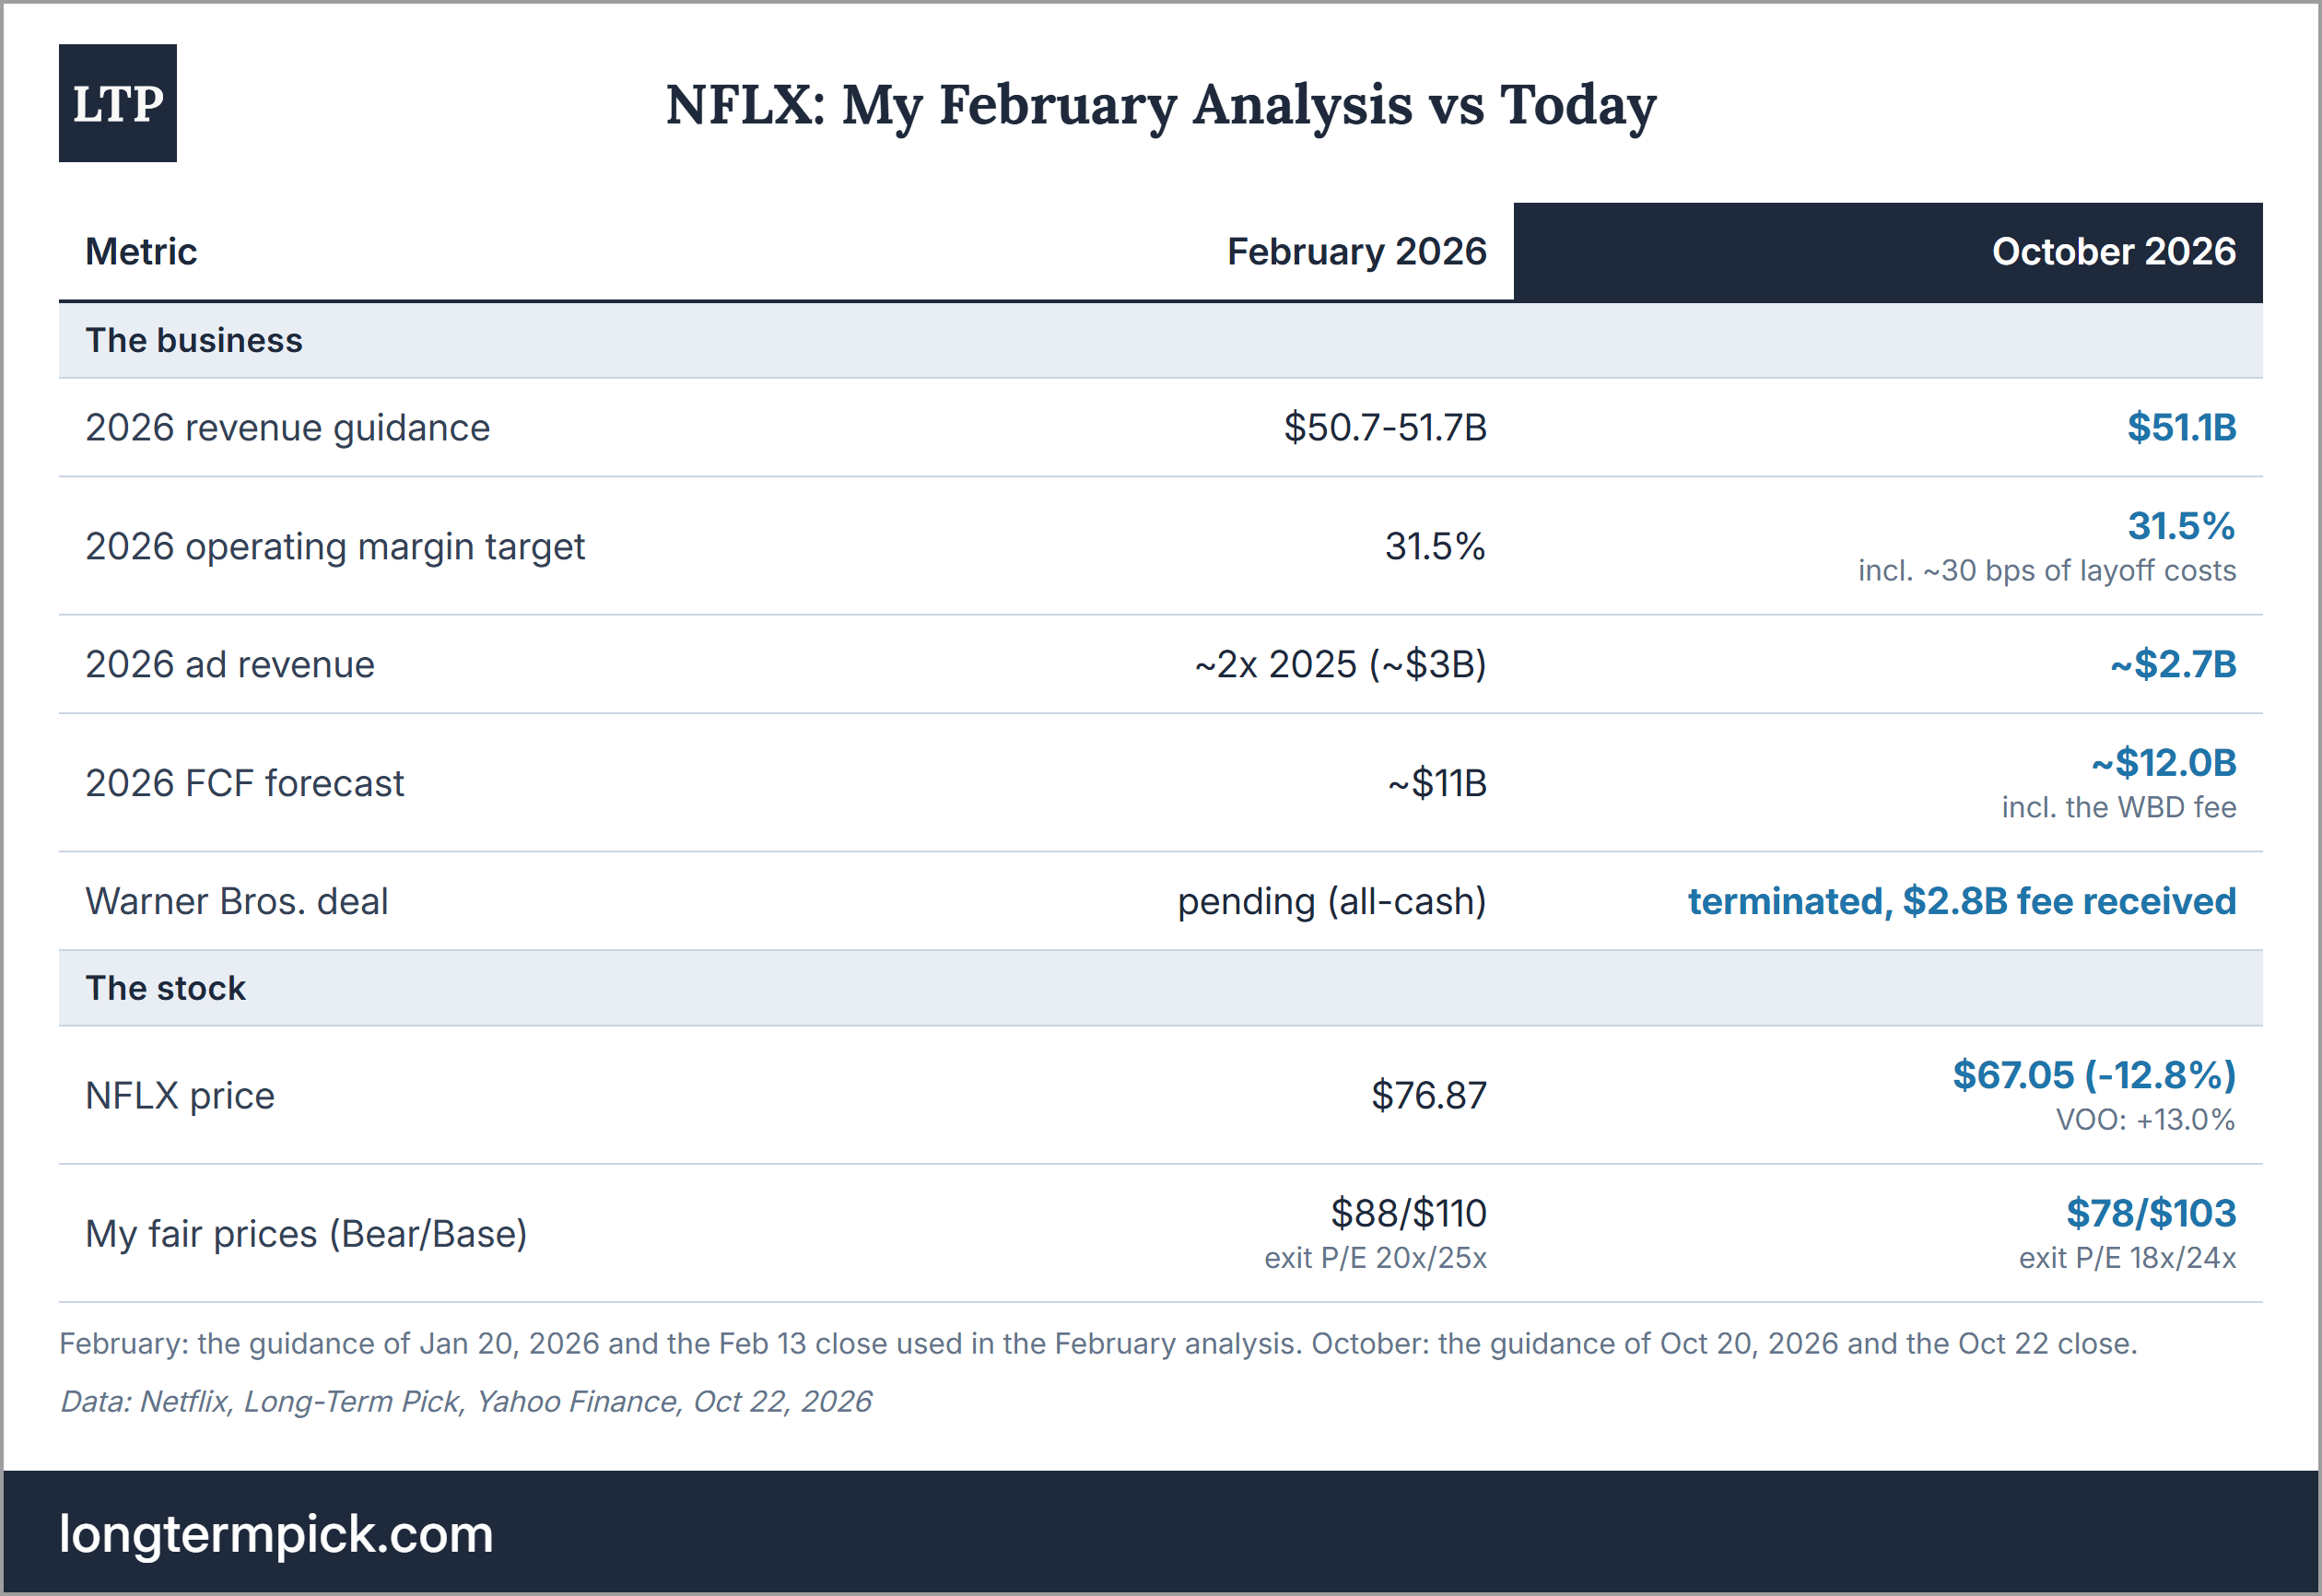
Has Netflix done what I bet on in February? Mostly yes. Revenue and the operating margin target are where Netflix guided in January. FCF is higher only because of the fee. Netflix raised the forecast by $1.5B in April, “due primarily to the after-tax impact” of the fee, and cut it by $0.5B in October for a real estate transaction. Without both, it is ~$11B, as in January. The ad business missed, and the margin expansion behind the 31.5% target is smaller than it looks. The stock went the other way. It fell 12.8%, while the S&P 500 (VOO) gained 13.0%.
The longer history is strong. Revenue increased from $25.0B in 2020 to $45.2B in 2025 (12.6% per year), the operating margin from 18.3% to 29.5%, and EPS from $0.61 to $2.53 (33% per year). EPS decreased only once in 5 years, by 11.5% in 2022. LTM EPS without the fee is $2.93 (the $3.45 on the Koyfin chart includes the fee), 2.6x the $1.12 of 2021.
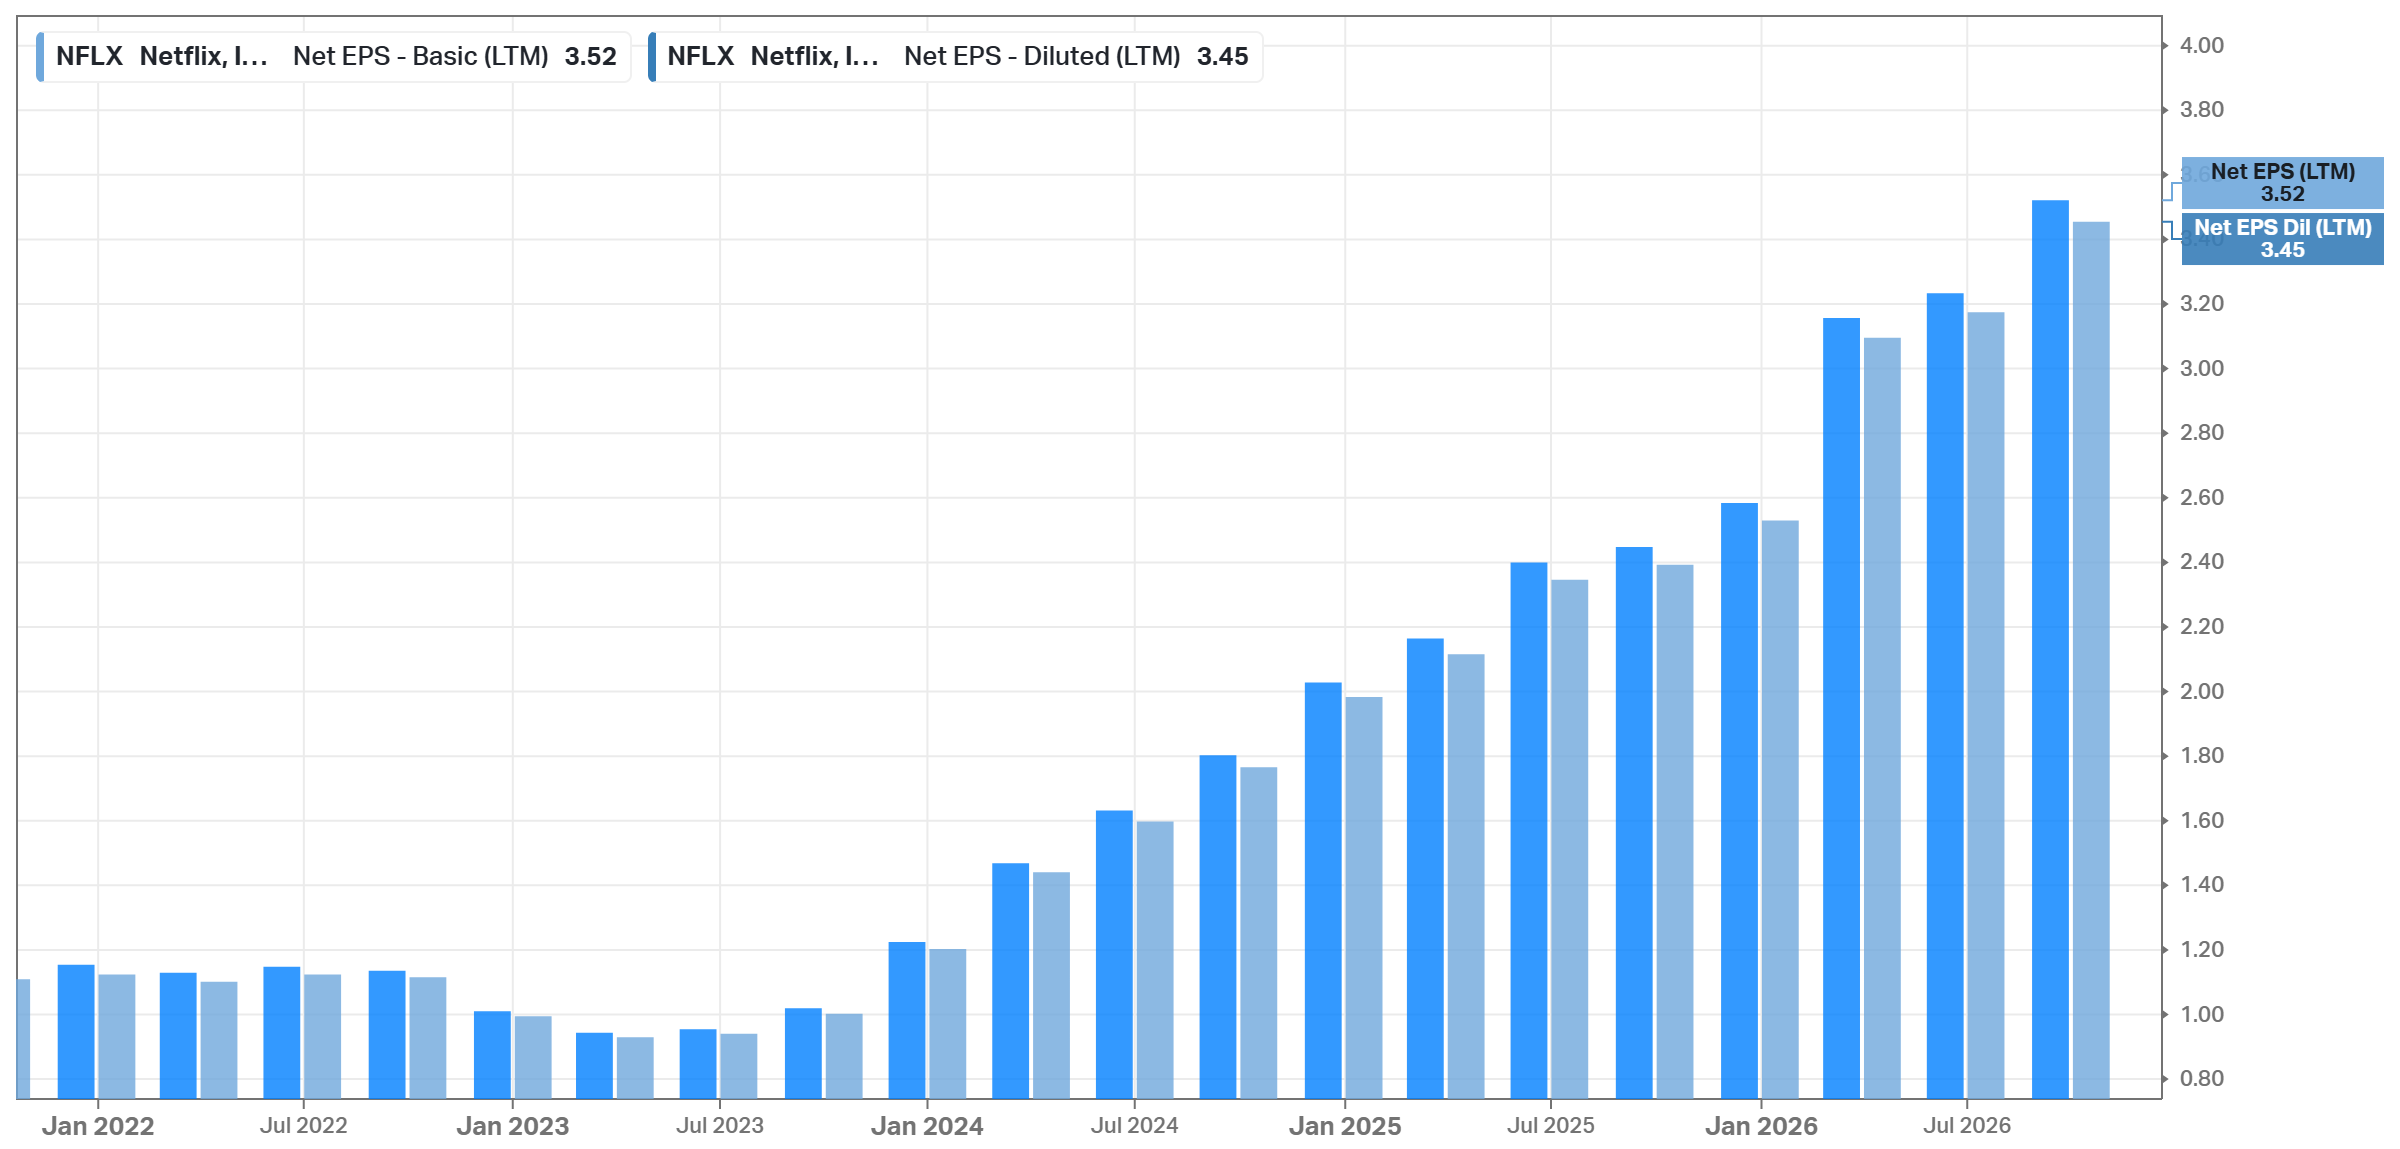
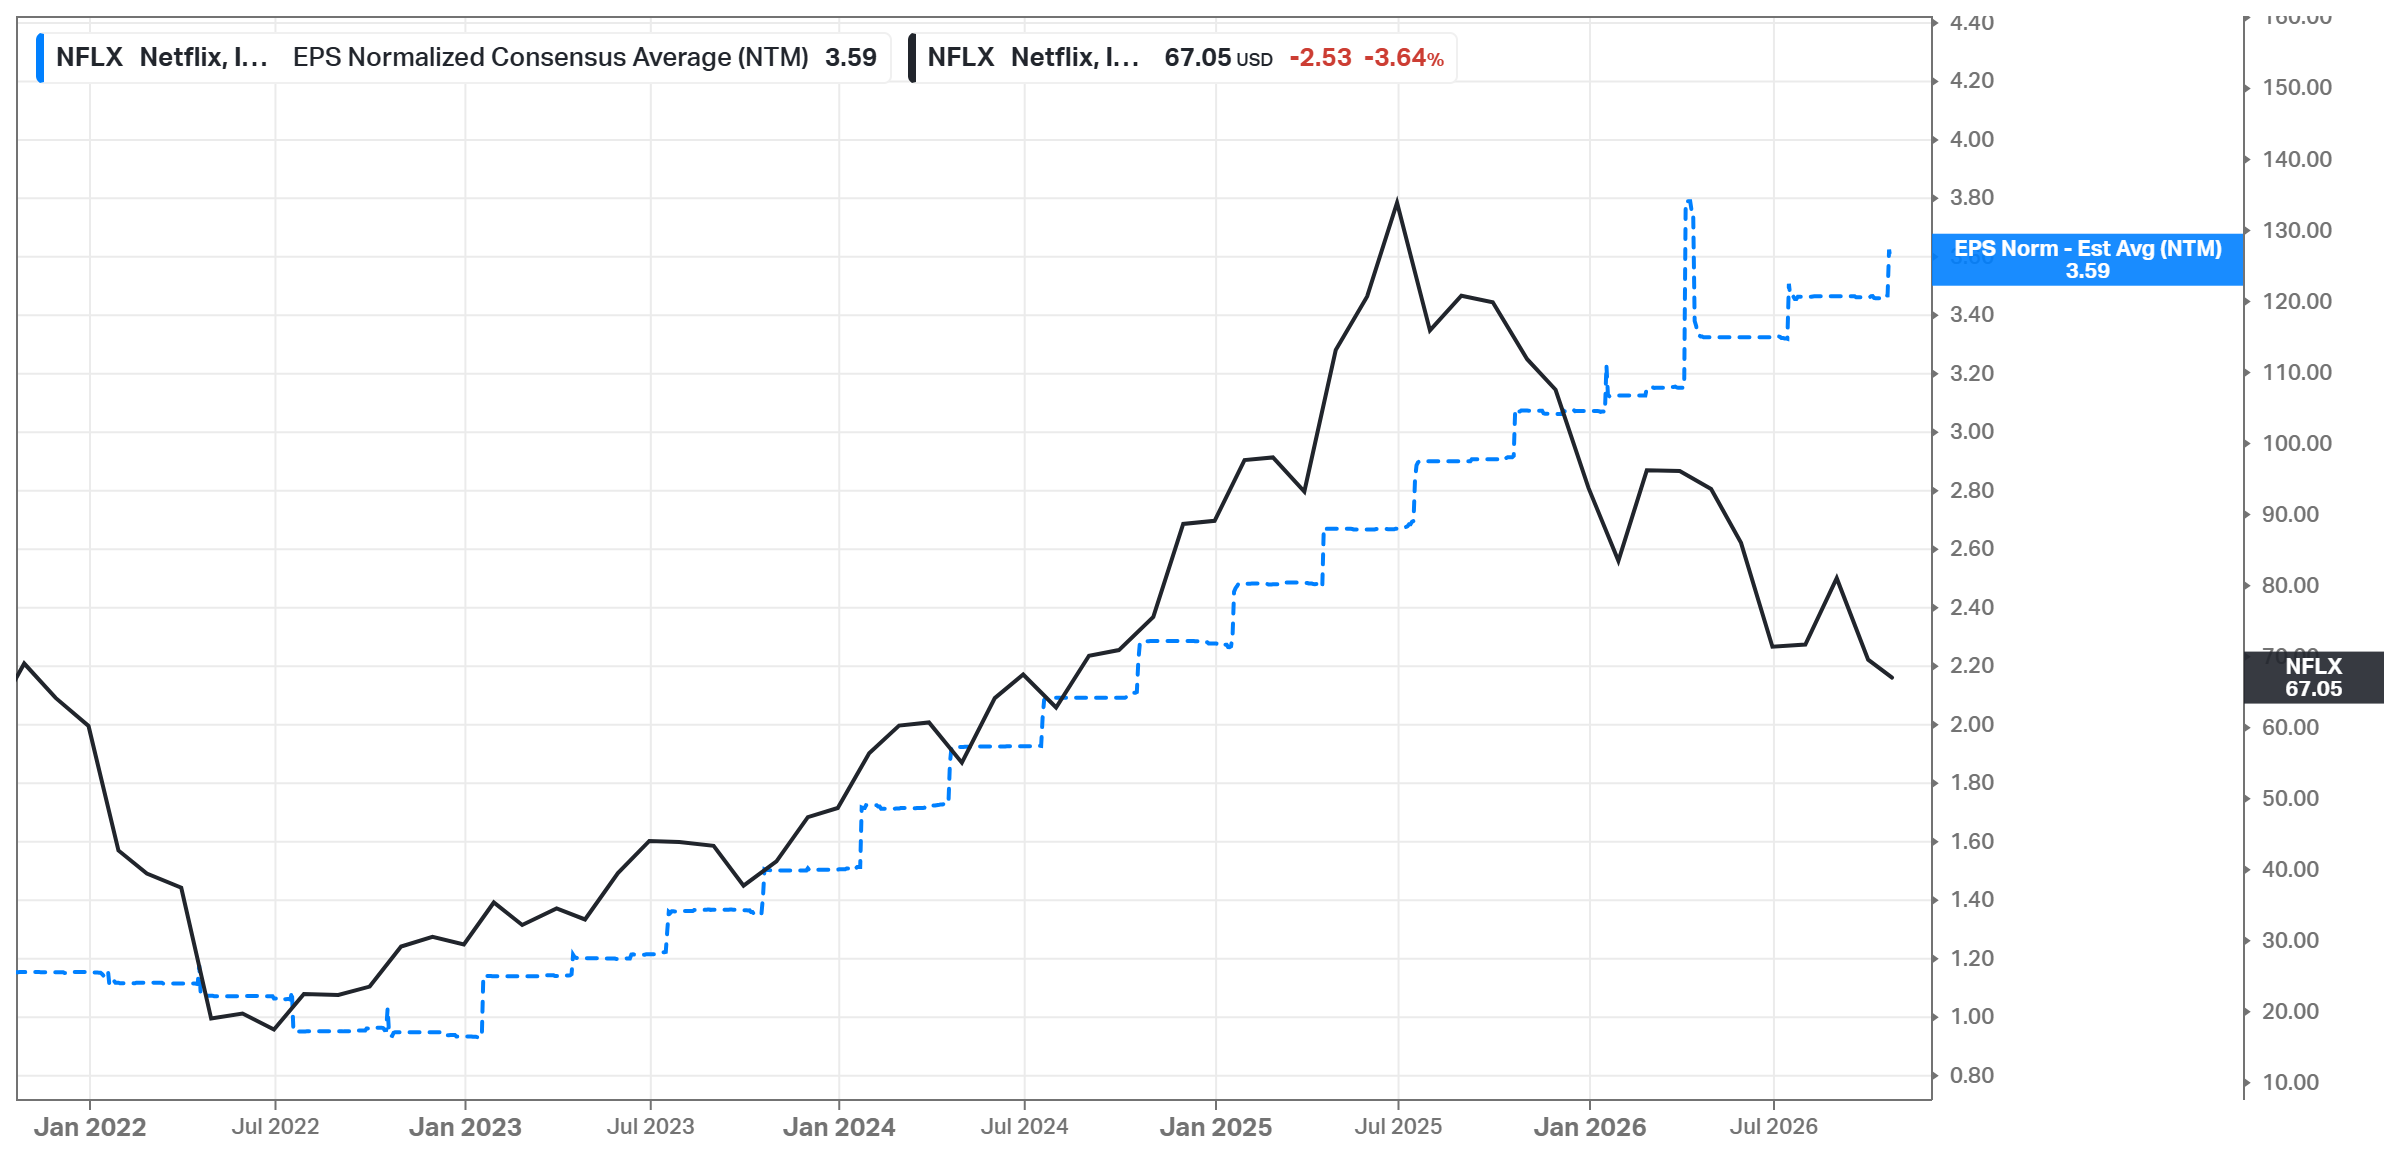
Since the June 2025 peak, LTM EPS without the fee increased 25% (from $2.35 to $2.93), and the consensus for the next 12 months reached $3.59, while NFLX fell 50%.
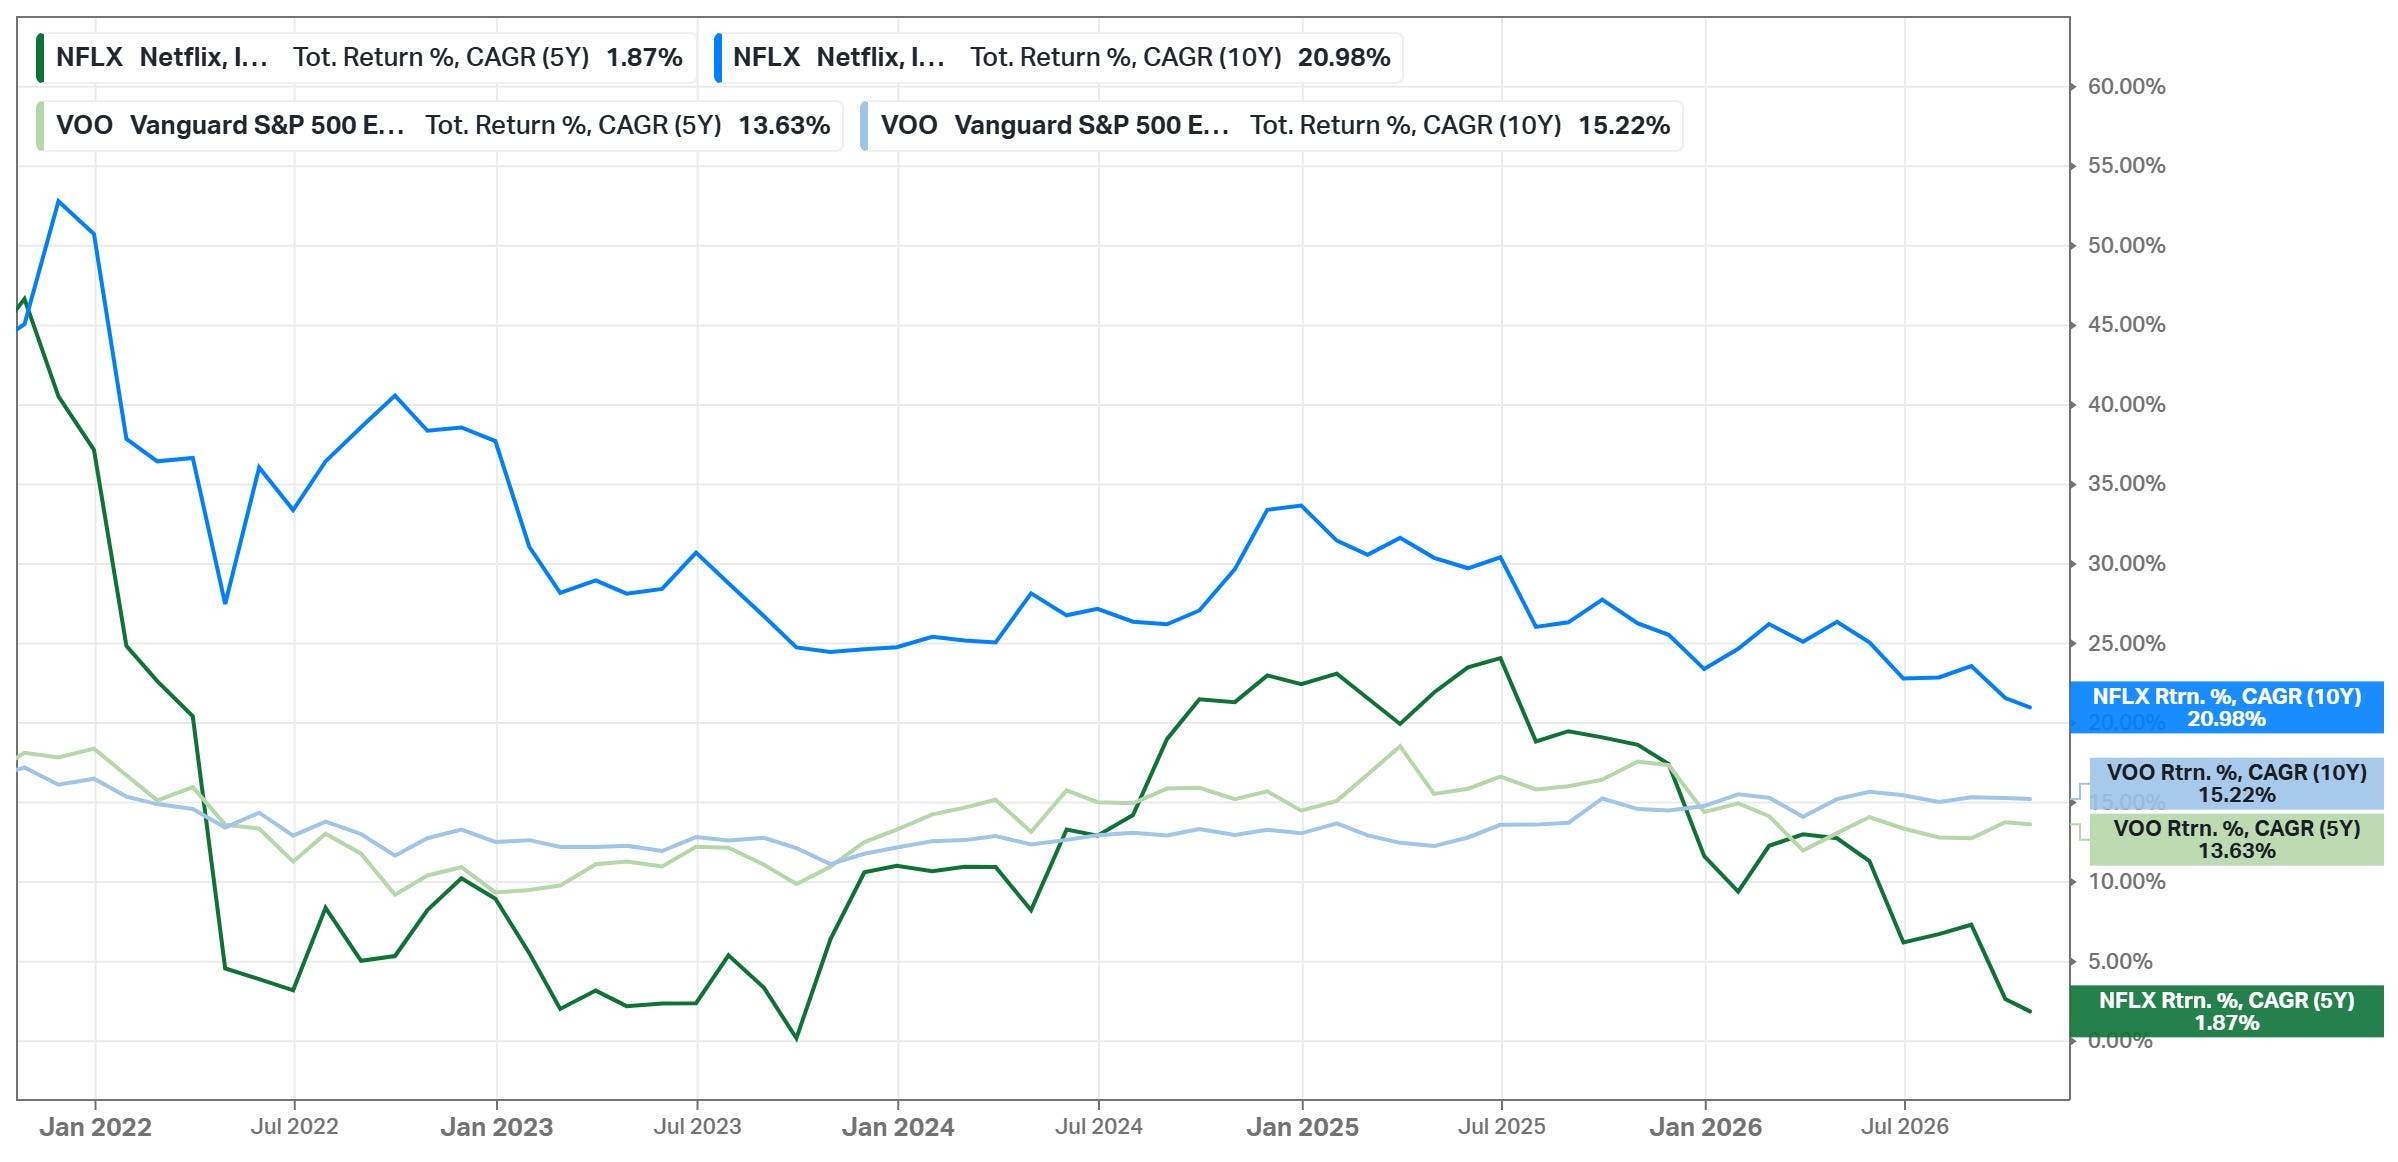
At the same time, over 5 years, the stock barely moved. NFLX returned 1.87% per year, against 13.63% for VOO. Over 10 years, it is still ahead, with 20.98% per year against 15.22%. EPS increased 2.6x, while the price is where it was in October 2021, so the whole 5Y difference is the multiple.
Future

Consensus revenue (S&P Global): 2026 $51.22B (+13.4%) and 2027 $56.96B (+11.2%) - the estimates already expect ~11% growth after 2026
Consensus EPS: $3.57 -> $3.77 -> $4.50 (2026-2028); without the fee, 2026 is $3.05, so 2027 is +24% and 2028 is +19%. The direction is down.
5Y forward EPS growth estimate: 21.28%, against a 25.18% 5Y mean and just above its -1 standard deviation band (20.89%); to compare, GAAP EPS grew 33% per year in 2020-2025, and ~15-16% in 2026 without one-offs, by my calculation
Analysts (S&P Global): 35 of 52 have a Buy or Strong Buy rating, 15 Hold, and 2 Strong Sell; average target $91.39 (+36% from $67.05), range $57-126
Company guidance: 2026 revenue $51.1B, operating margin 31.5%, FCF ~$12.0B, and cash content spend ~1.1x amortization; Q4 revenue $13.44B, EPS $0.67, operating margin 26.0%. The 2027 guidance comes in January. CFO Spence Neumann repeated the objectives: “sustain double-digit revenue growth”, expand margins, and increase FCF.
What must go right. My model needs EPS of $7.59 in 2031, 20% growth per year from $3.05. By my estimate, this is possible if revenue grows ~10% per year to ~$82B, the diluted share count decreases ~2.5% per year, and the operating margin increases from 31.5% to ~41%. So the margin has to grow ~2 points per year, slightly less than the ~2.5 points per year of 2020-2025 without one-offs. Most of it has to come from content amortization growing slower than revenue, and this is the part I trust least for 2027. In the first 9 months, cash spent on content increased 18.5% YoY, and content in production increased 18% since December, to $10.9B, after a flat 2025. Netflix amortizes over 90% of a title within 4 years after release, so this spending reaches the income statement in 2027-2028.
For me, the January guidance is the test. If the margin grows only ~1 point a year, to ~36.5% in 2031, EPS grows ~17% per year, and my model gives ~$68 at the 18x exit, about today’s price. If it stays flat at 31.5%, EPS grows ~13.5%, and the model gives ~$59. So a 2027 margin guide ~2 points above 2026 without one-offs is a pass, ~1 point is a warning, and no expansion breaks the thesis, especially if US growth slows once the March price increase is in both years, from Q2 2027. The other checkpoints are content amortization in the same guidance, the next US price increase and its effect on churn, the ad launches in March 2027, and the first annual engagement report.
Current Valuation
Current vs 5Y mean:
Price/Fwd Earnings: 18.1x vs 32.6x
Price/Fwd Sales: 4.8x vs 6.6x
Price/FCF: 23.5x vs 57.1x
Price/Book: 9.2x vs 12.1x
PEG: 0.85 vs 1.30
Forward Earnings Yield: 5.5% (NTM EPS)
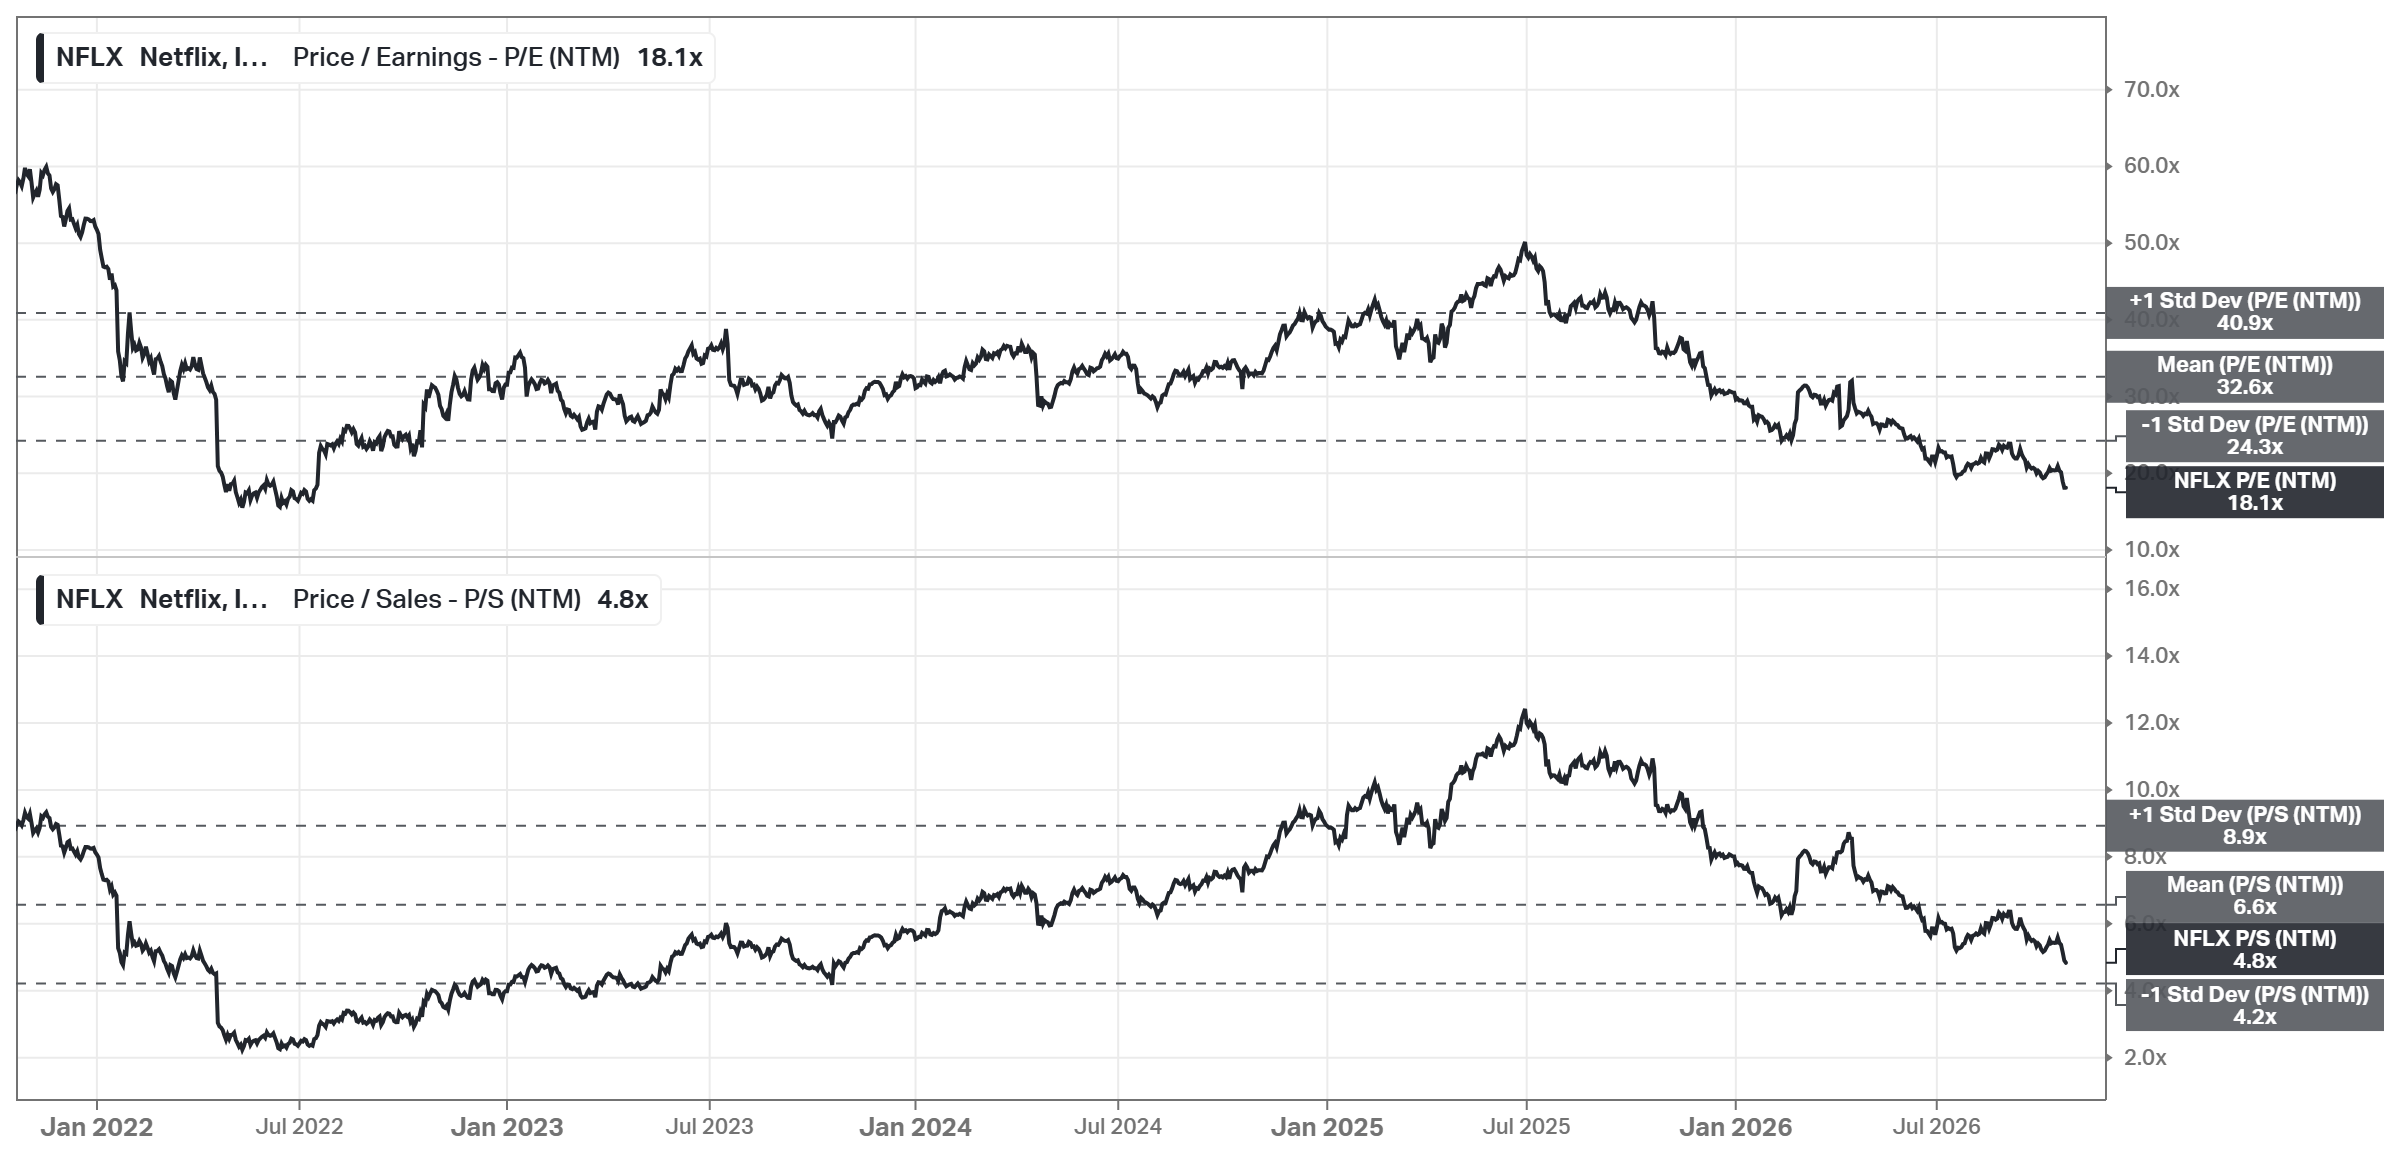
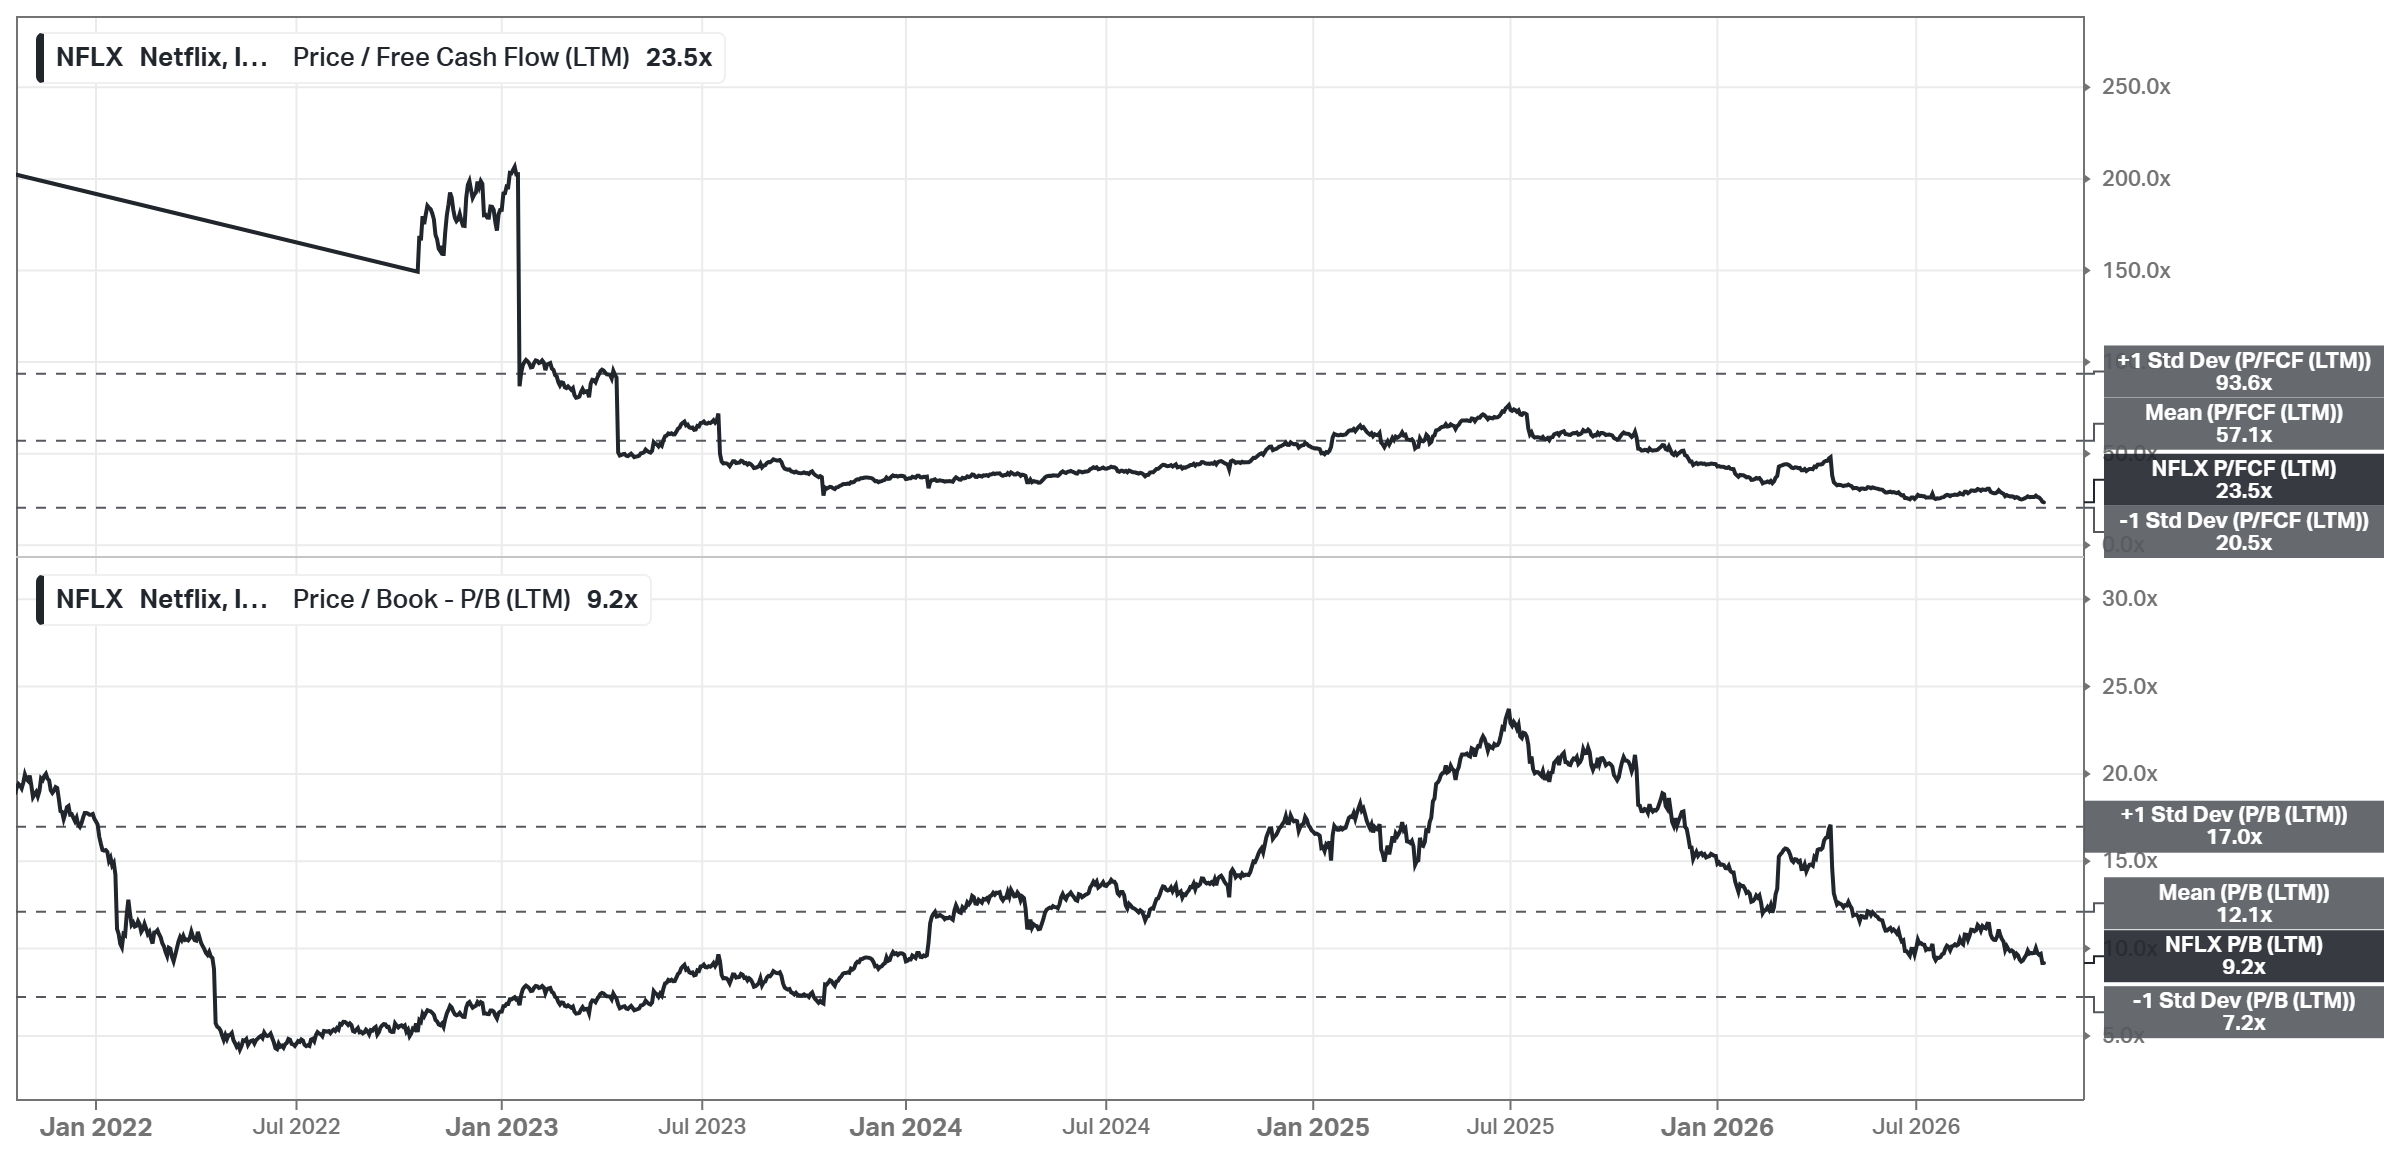
On earnings, NFLX trades below its -1 standard deviation band. The forward P/E is 18.1x against a 24.3x band and a 32.6x mean. On 2027 consensus EPS, the P/E is 17.8x, a 5.6% earnings yield. The other multiples are low too, but not as extreme. P/S is 4.8x, between its mean (6.6x) and its -1 standard deviation band (4.2x); P/FCF is 23.5x against a 20.5x band, and P/B is 9.2x against a 12.1x mean. The FCF yield is 4.4% on Netflix’s 2026 forecast, which includes the fee, and ~4.0-4.3% on ~$11-12B without the fee and the Brazil deposit. To compare, on S&P Global data and the Oct 22 close, the competitors with meaningful earnings trade at 6.6-51.1x forward earnings, and XLC at 14.9x.
Analyst’s note:
I exported the Koyfin data on Oct 23, before the US market opened, so its valuation charts end on the Oct 21 close of $65.04. At the $67.05 anchor, the forward P/E is 18.7x and the PEG 0.88. The Bear Case multiple is 18x either way, so the fair prices do not change. The 5Y window starts in October 2021, when NFLX traded at ~55-60x forward earnings, so the 32.6x mean is inflated by a period when Netflix was valued as a subscriber growth story. I do not use it as the Base Case. The P/FCF mean (57.1x) is distorted too, since FCF was close to zero in 2021-2022. Also, the reported 2026 P/E (18.8x on $3.57) looks lower than it is, since the fee is part of that EPS. Without the fee, NFLX trades at 22.0x 2026 EPS.
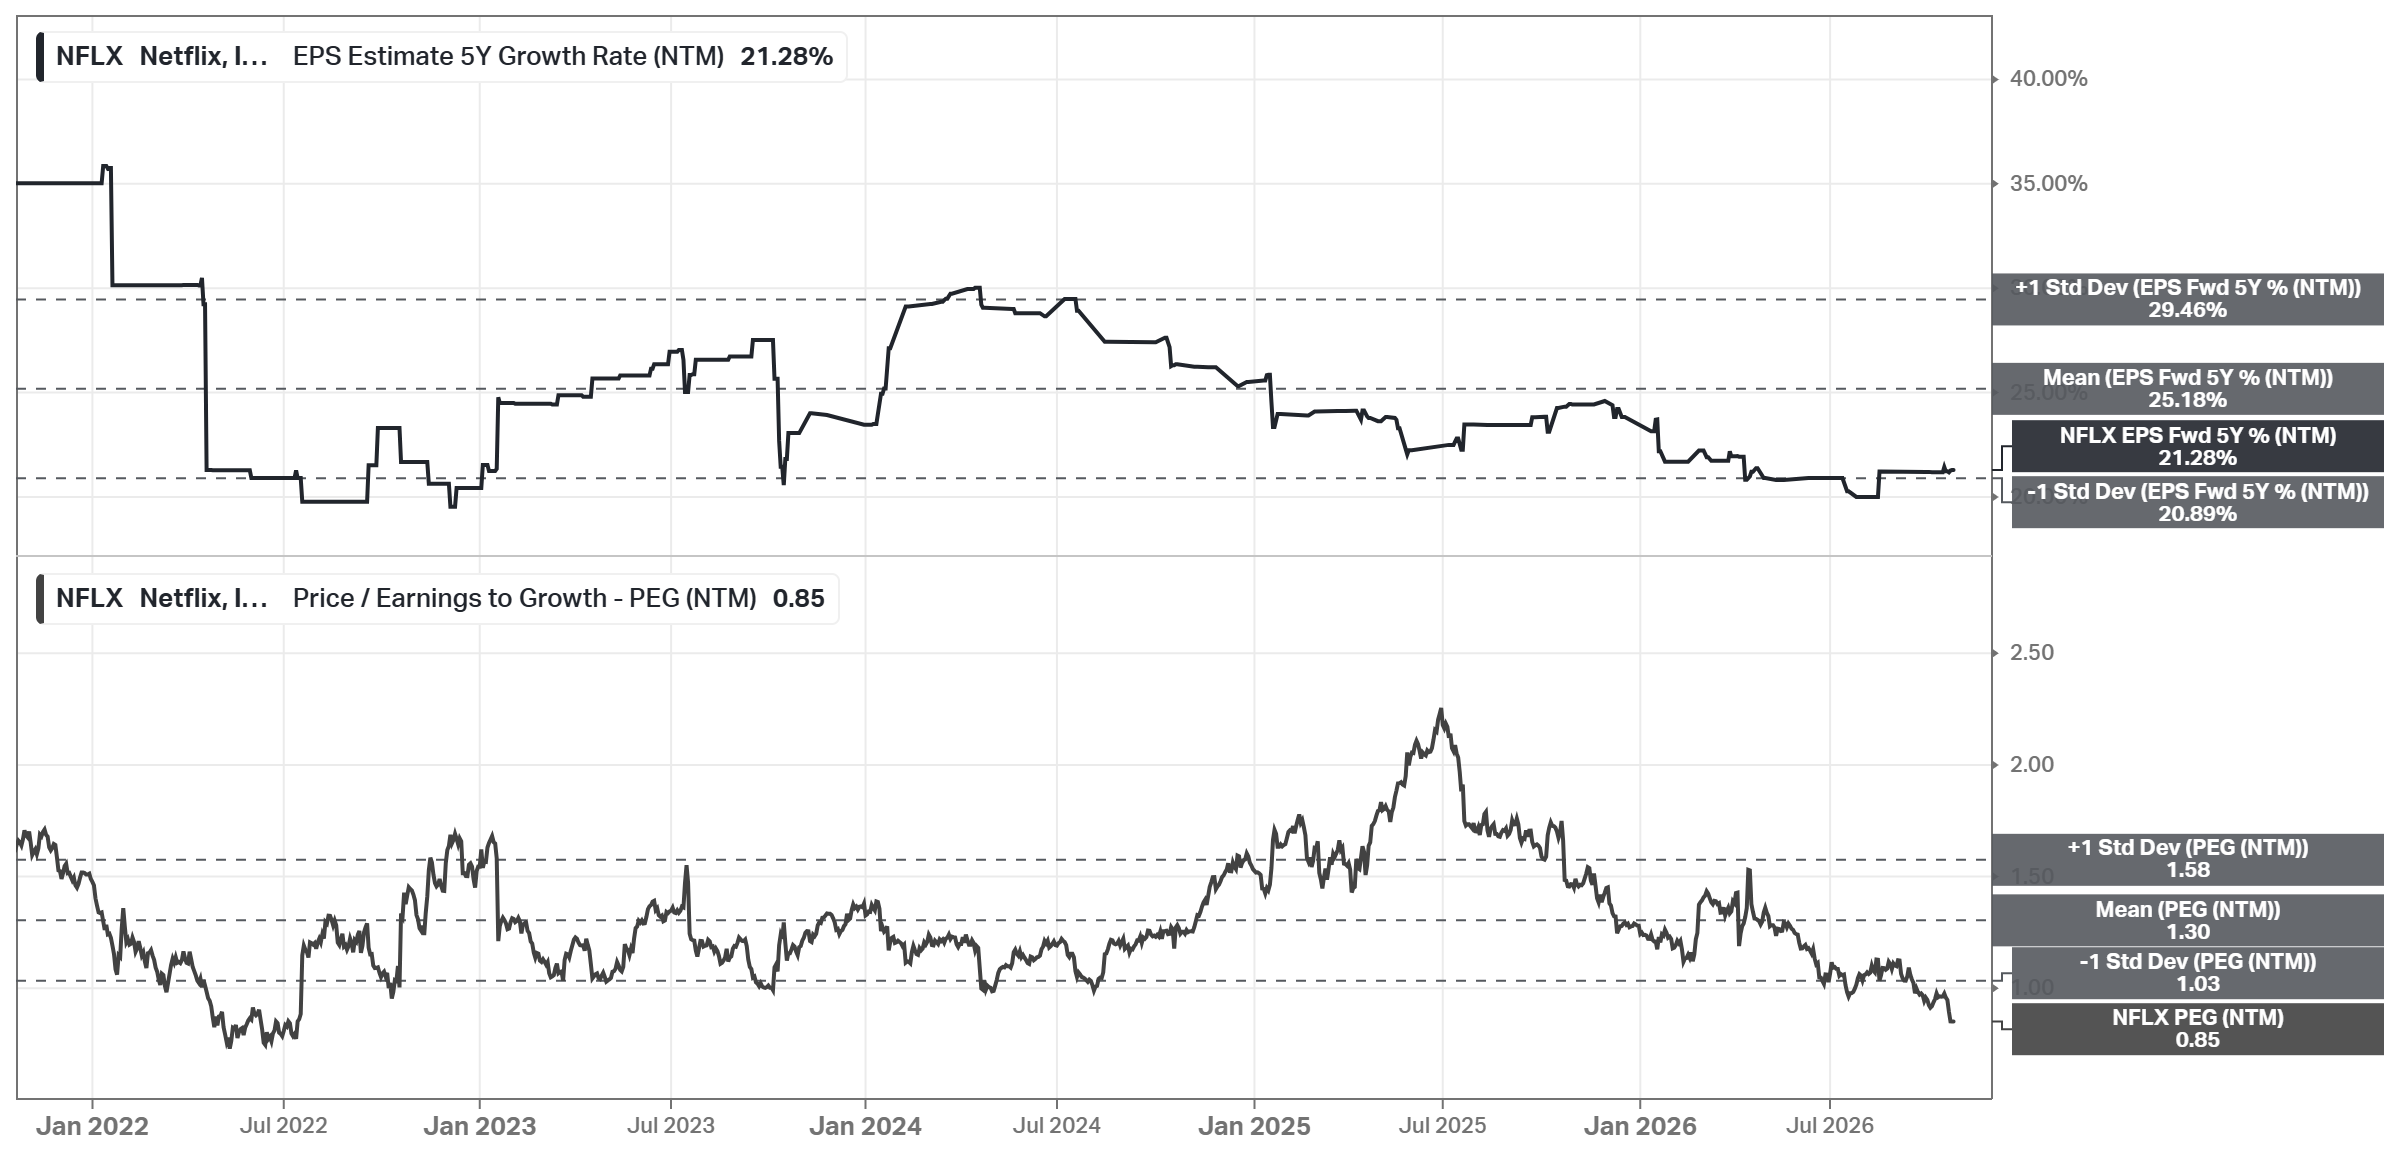
The multiple fell more than the growth estimate. The 5Y EPS growth estimate decreased to 21.28%, against a 25.18% mean and close to its -1 standard deviation band (20.89%). The PEG ratio decreased more, to 0.85, against a 1.30 mean and below its -1 standard deviation band (1.03). Even at the mean growth estimate, today’s P/E would be a PEG of ~0.72.
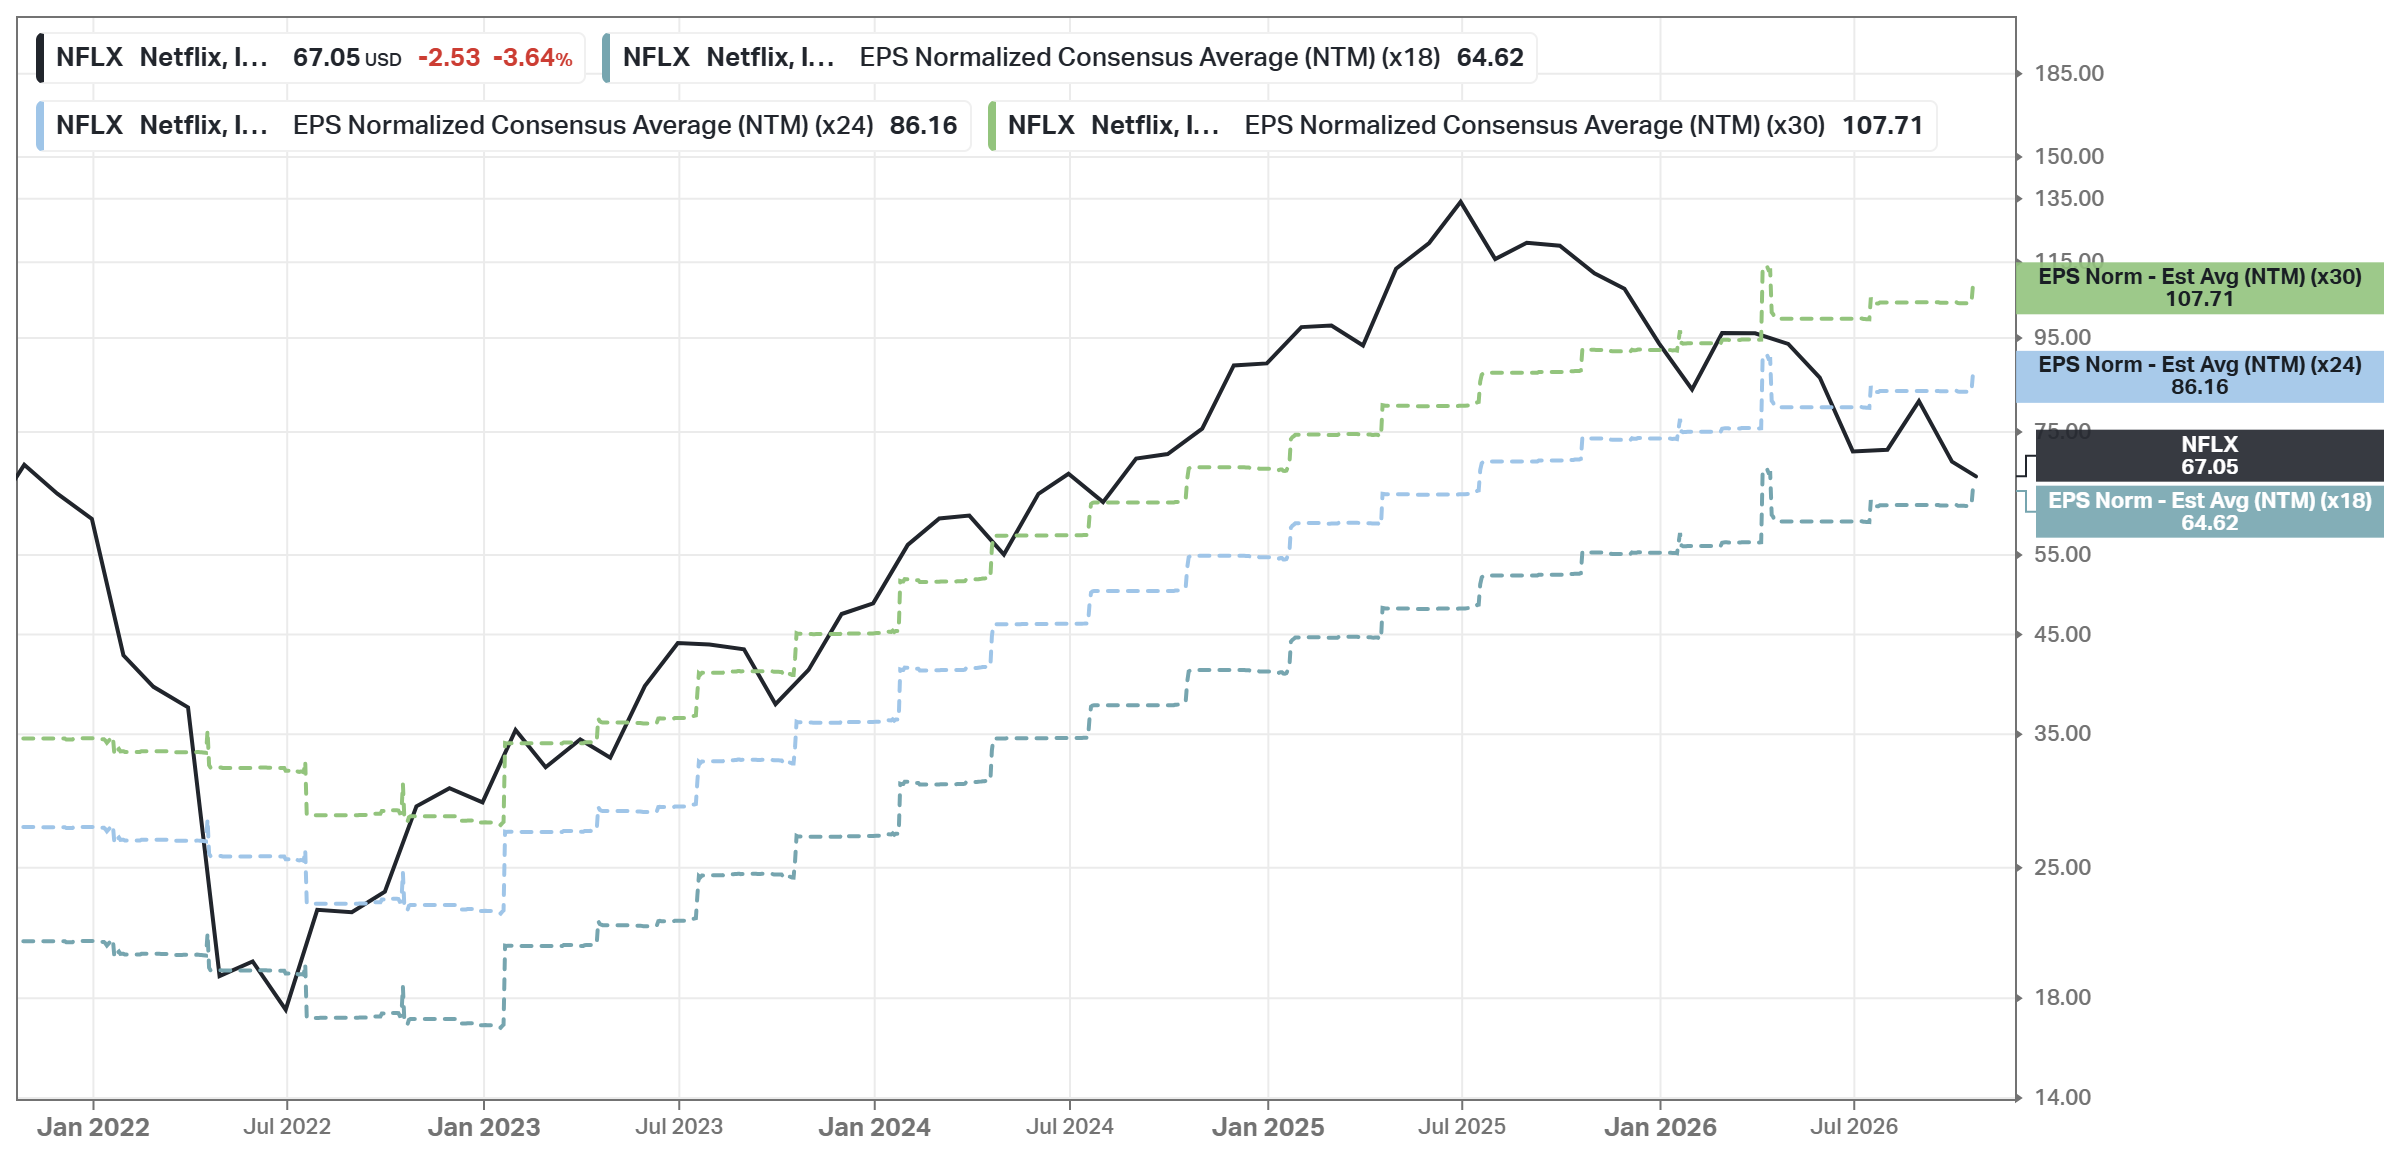
What does $67 already assume? NFLX pays no dividend, so if its forward multiple does not change, the stock returns its EPS growth. At ~18-19x, my 12% required return needs ~12-13% EPS growth per year. If the multiple falls to 15x, as in mid-2022, Netflix needs ~17%. If it recovers to 24x, ~6-7% is enough. So the price assumes less growth than Netflix delivers this year without one-offs (~15%), and much less than the ~21% consensus. My model is stricter. It starts from 2026 EPS without the fee, where NFLX is at 22x, and exits at 18x, so its Bear Case needs ~16-17% growth to reach $67.
One chart frames this whole section. It shows the consensus forward EPS times my exit multiples (18x, 24x, and 30x) against the NFLX price. At $67, NFLX is just above the 18x line and 22% below the 24x line. The last time it was this close to 18x was in mid-2022.
Fair Price
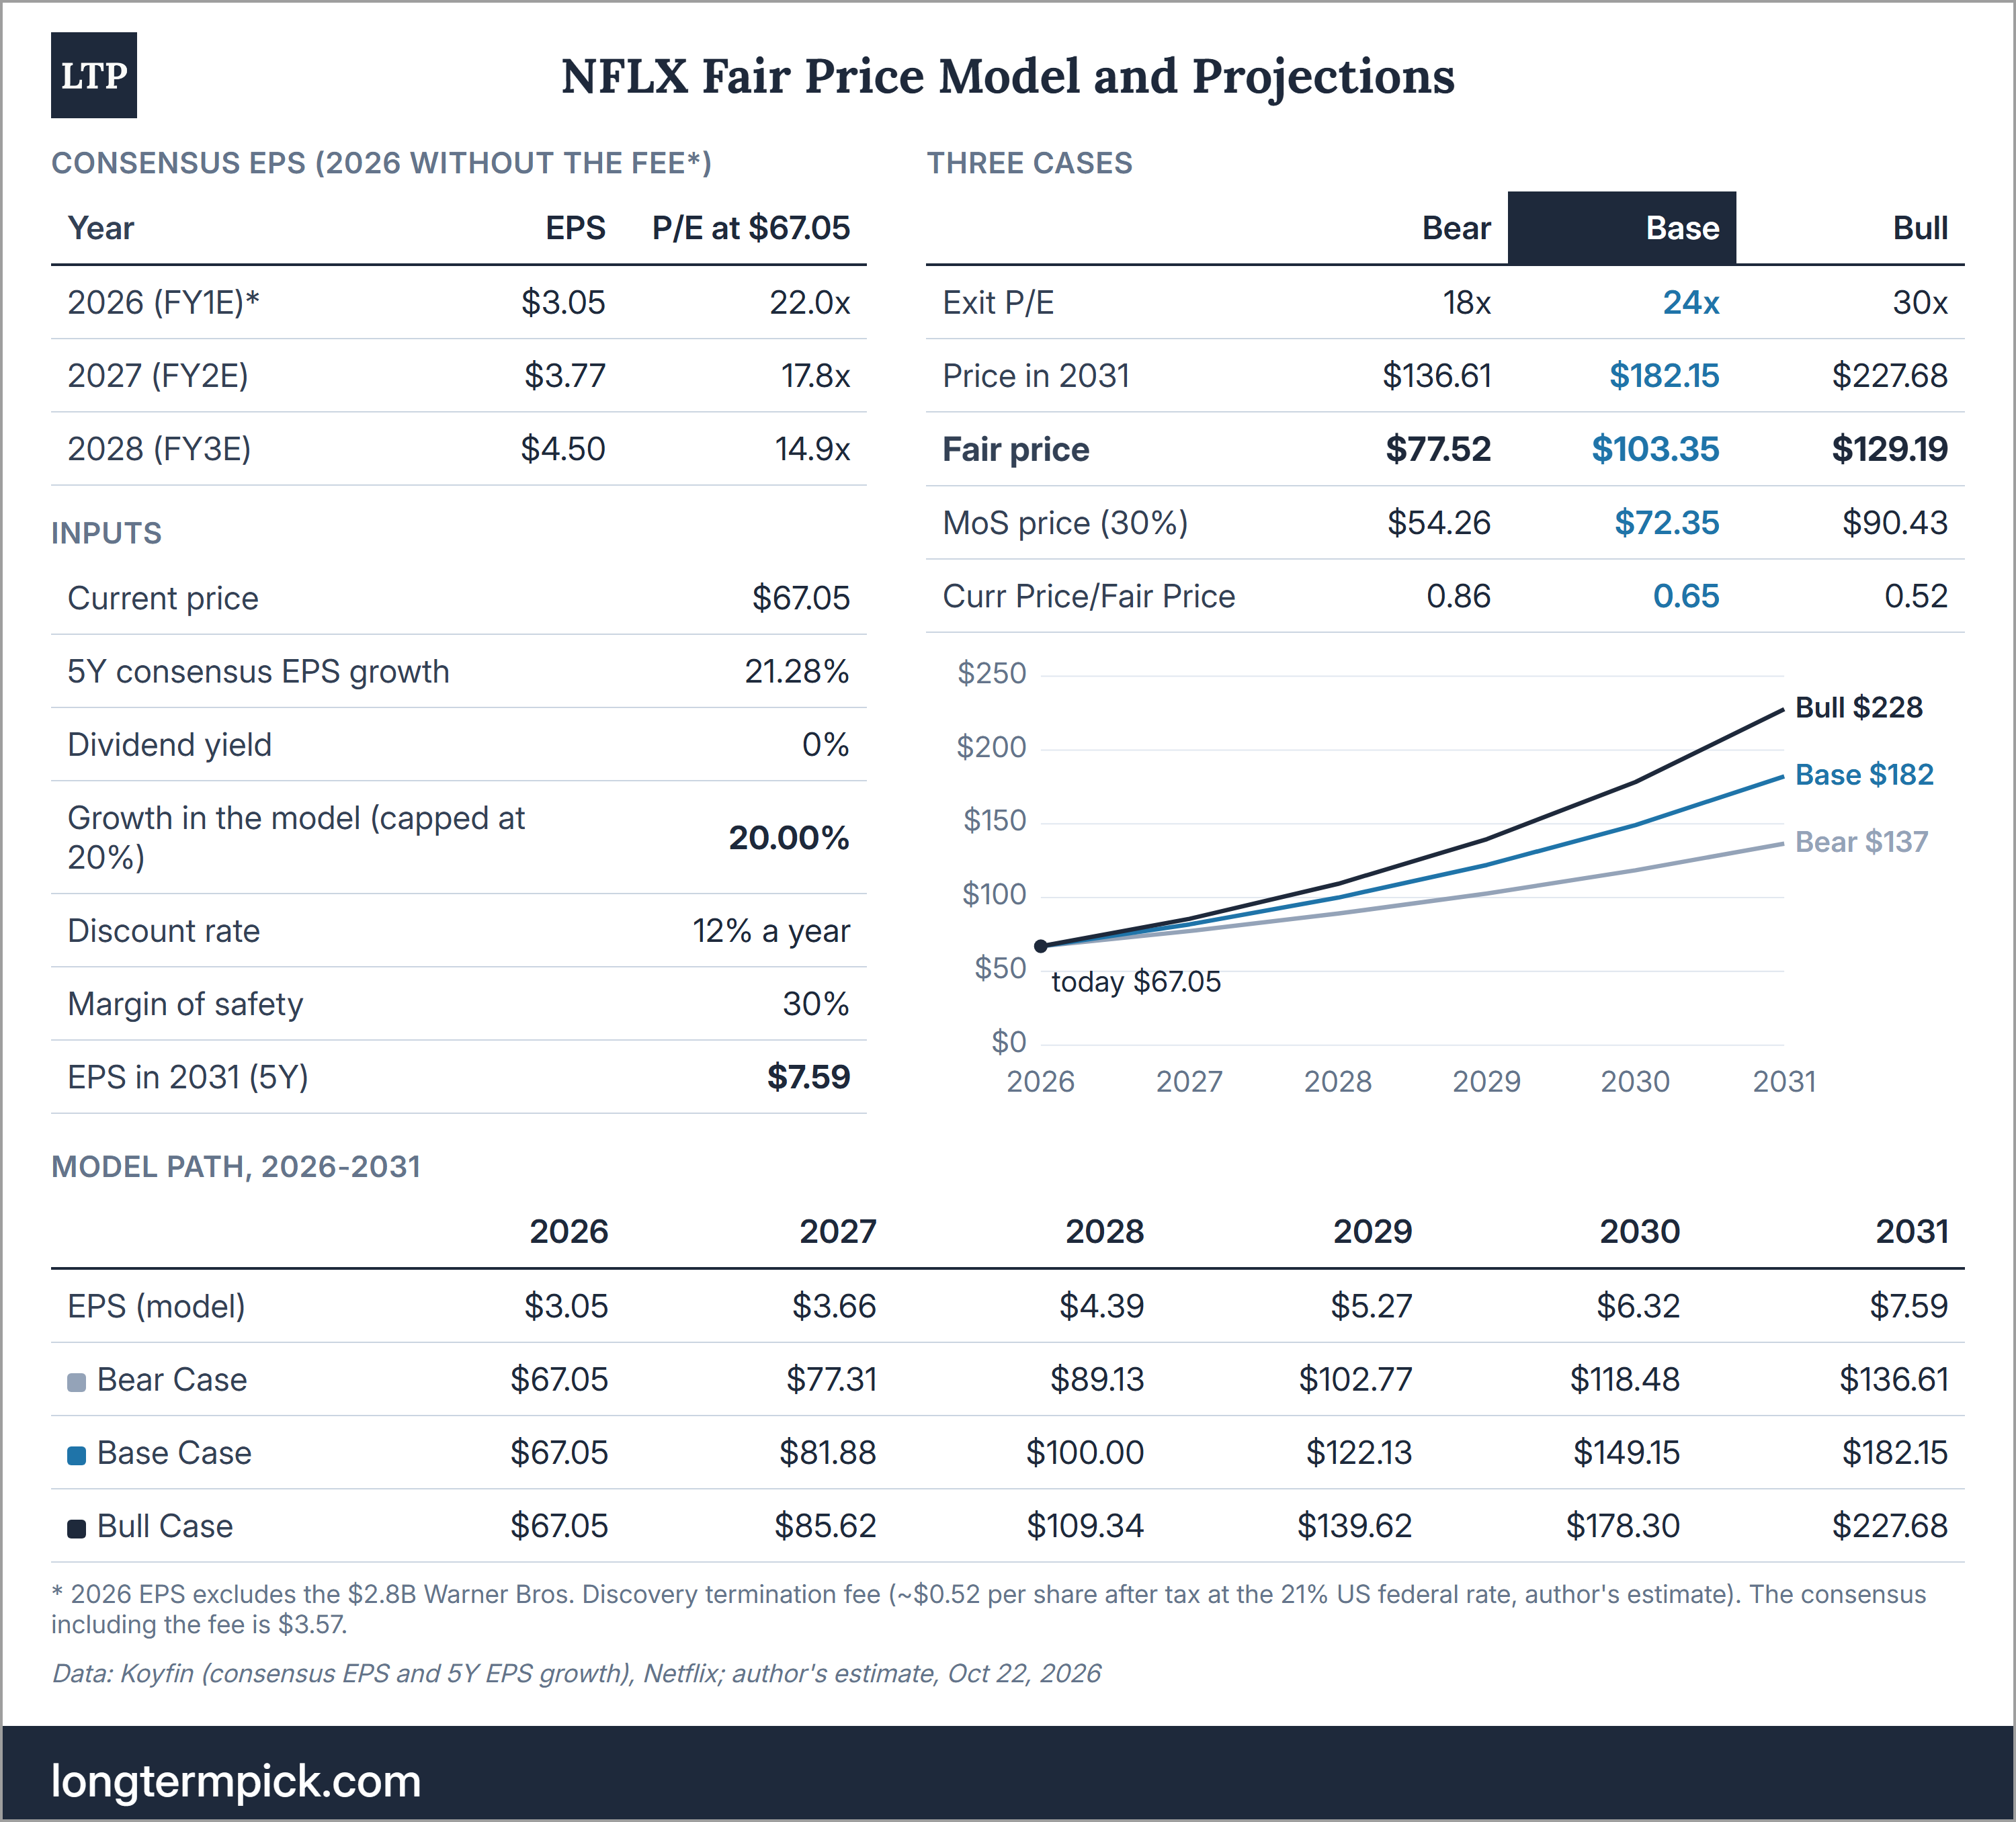
My model grows EPS for 5 years at the consensus rate. Consensus can be too optimistic, and my model takes this into account by capping future growth at 20%. For Netflix, the cap matters. The 5Y estimate is 21.28%, and there is no dividend yield to add to it, so the model uses 20%. The starting point is $3.05 (2026 EPS without the fee), and in 2031 it becomes $7.59. In 2027 and 2028, my path ($3.66 and $4.39) is 2-3% below the consensus.
The discount rate is 12%; the margin of safety is 30%. The exit multiples are 18x, 24x, and 30x. 18x is today’s 18.1x forward P/E rounded down, so the Bear Case assumes that NFLX never gets a higher forward multiple, even if EPS grows 20% a year. My model applies it to 2031 EPS, and on 2026 EPS without the fee, NFLX is at 22x today, so this case also includes some derating. 24x is the -1 standard deviation band (24.3x), and in 2023-2025 it was roughly the floor of the NFLX forward P/E. 30x is a PEG of 1.5, the ceiling of my rules, and still below the 32.6x 5Y mean.
Bear Case (exit P/E 18x): fair price $78 - MoS price $54
Base Case (exit P/E 24x): fair price $103 - MoS price $72
Bull Case (exit P/E 30x): fair price $129 - MoS price $90
Analyst’s note:
These fair prices are lower than in February ($88/$110 at 20x/25x) and in the free NFLX entries of Watchlist #001 and Watchlist #002 ($117/$122/$152 at 23x/24x/30x). Against February, the difference is small: the starting EPS was $3.13 then, and the exit multiples were 1-2 points higher. Against the watchlist, there are two reasons. The watchlist model started from the 2026 consensus of $3.59, which includes the termination fee, and my starting EPS without it is 15% lower. Also, the Bear Case multiple is today’s 18x instead of the 23x of early September. The Base and Bull multiples did not change. The full analysis replaces the quick watchlist model.
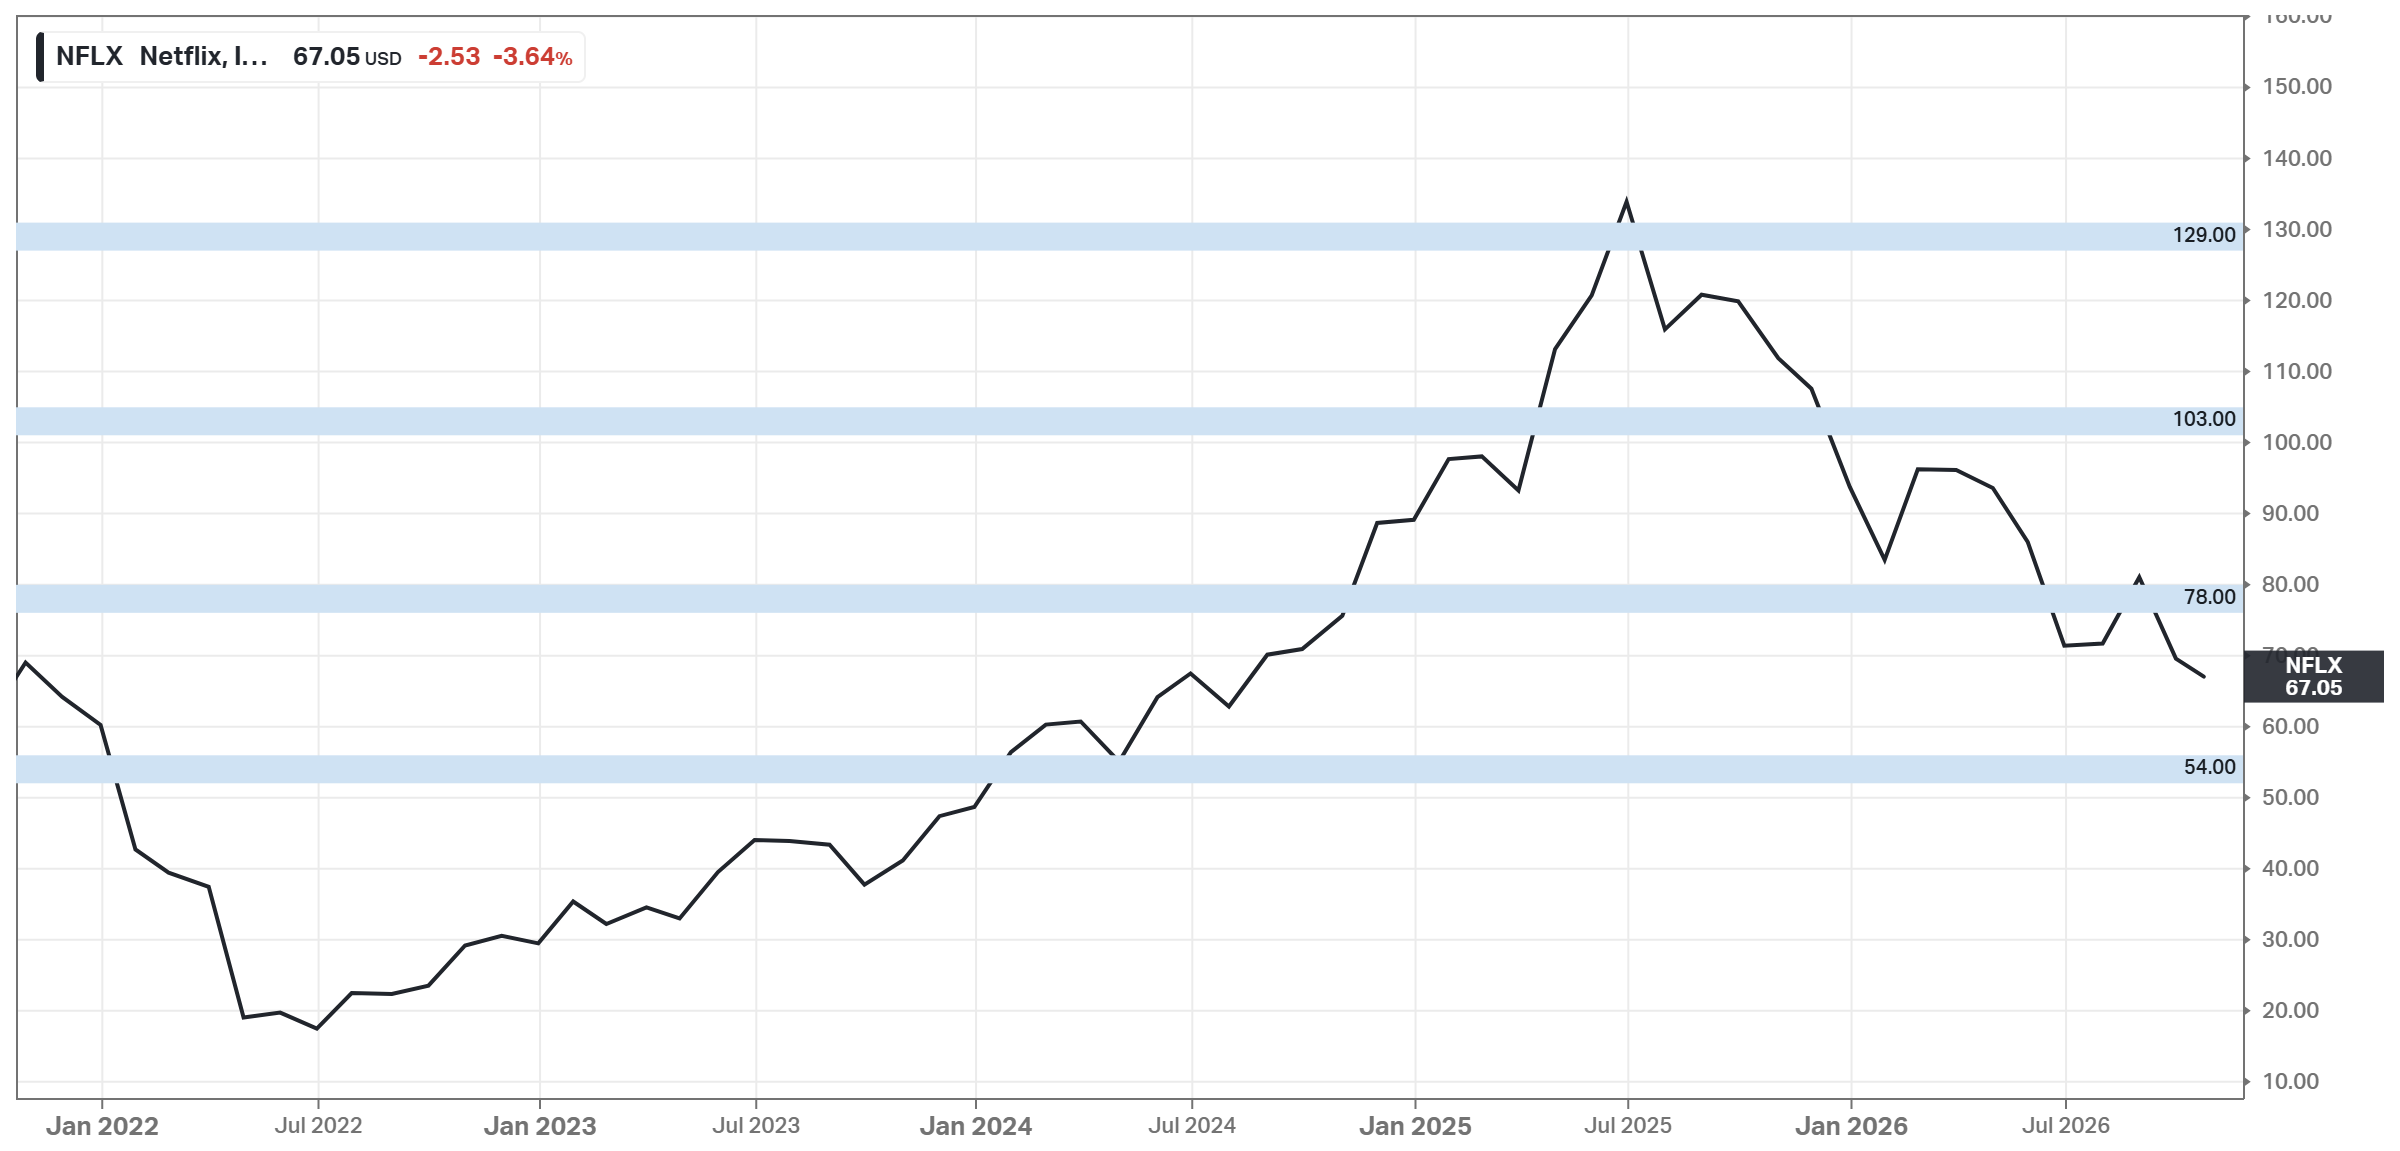
At $67, NFLX is 14% below the Bear Case fair price and 35% below the Base Case. The accumulation zone is $54-78. The result depends most on growth. At 15% EPS growth per year, roughly the 2026 pace without one-offs, the fair prices are $63/$84/$104, and the Bear Case is 7% below today's price. At 10%, they are $50/$67/$84. Since the margin is the least certain input here, I see the zone in two parts. Between $63 and $78, my strict Bear Case needs more EPS growth than the ~15% in 2026 without one-offs to justify the price. Below $63 (the Bear Case at 15% growth), it does not. At $67, NFLX is in the upper part, so for me this is a zone to accumulate gradually, not one price.
Due Diligence
Profitability (10 of 15):
Positive Gross Profit: $25.21B
Positive Operating Income: $15.56B
Positive Net Income: $14.77B
Positive FCF: $11.38B
Gross margin >= 40%: Yes (50.68%)
Net margin >= 10%: Yes (29.69%; 25.24% without the fee)
FCF margin >= 10%: Yes (22.87%)
Management (ROIC, ROE, ROA) >= 10%: Yes (27.69%/53.46%/17.12%)
Strong 3Y Revenue Growth: No (12.6% per year, 2022-2025)
Revenue Growth Forecast: No (~12% per year in 2026-2027)
ROE is increasing: ~38% at the start of 2022 -> 53.46%
ROIC is increasing: ~16% at the start of 2022 -> 27.69%
Revenue surprises in the last 5Y in a row: No (misses in Q1-Q2 2022, Q1-Q2 2023 and Q2 2026)
EPS surprises in the last 5Y in a row: No (misses in Q4 2022, Q4 2023, Q3 2025 and, without the fee, Q1 2026)
EPS growth YoY 5Y in a row: No (-11.5% in 2022)
Financial Strength (5 of 6):
Total assets ($58.68B) exceed total liabilities ($29.40B) by 2.0x
Negative Net Debt: No ($6.91B of net debt)
Low Debt/Equity: 51.7% (5Y mean: 75.5%)
Debt/Capital: 34.07% (5Y mean: 42.66%)
Interest coverage (FFO): 14.4x (5Y mean: 8.6x)
Piotroski F-Score: 7 of 9 (FY2025; not passed: operating cash flow > net income, higher current ratio)
Valuation and Advantage (2 of 4):
Valuation < 5Y mean: Yes (P/E 18.7x at $67.05, below even its -1 SD band of 24.3x)
Valuation < the industry: No (P/E 18.7x vs 14.9x for XLC; DIS and CMCSA are cheaper)
Does it have a moat: Yes (narrow)
Outperformed the S&P 500 over 5Y: No (1.87% vs 13.63% CAGR)
Shares (1 of 3):
Insider ownership >= 5%: No (1.24%, including Reed Hastings, who has left the board)
Fewer shares outstanding YoY: Yes (4,195M vs 4,340M diluted)
Insider buys in the last 6M: No (only sales; ~90% of the value under pre-arranged 10b5-1 plans)
Price (4 of 4):
1Y price forecast > 10%: +36.3%
Next 5Y EPS growth estimate (CAGR) > 10%: Yes (21.28%)
DCF Value: ~$83 (base case: revenue growth 8.7% - below consensus, 8.4% discount rate); undervalued by ~19%
Short Interest < 5%: Yes (2.0%)
Verdict
In my view, Netflix is a quality compounder that fits a long-term portfolio as a core holding, and NFLX is priced as if the compounding slows down. Netflix is the most profitable streaming service, with a 31% operating margin, ~$12B of FCF in 2026 (including the fee), low net debt, and buybacks of more than 4% of the market cap a year. NFLX trades at ~18x forward earnings, below the 24.3x low end of its usual 5Y range, and if the multiple holds, the price needs ~12-13% EPS growth per year, below the ~15% pace of 2026 without one-offs. Consensus expects ~21%. My model starts from $3.05 of EPS without the termination fee, caps growth at 20%, and gives fair prices of $78/$103/$129, so NFLX is inside the $54-78 accumulation zone and 35% below the Base Case. The realistic downside is a Netflix that grows by price and ads while viewing stays flat, with margin gains of ~1 point a year instead of 2 - then EPS grows ~15-17%, and my 18x Bear Case, which already includes some derating, gives $63-68, around today’s price. The thesis is not proven yet, since it depends on the margin and on the new content team, so this is a price to accumulate gradually inside the zone rather than all at once. The things to watch are the 2027 margin and content amortization guidance in January, the ad tier launches in March 2027, the first annual engagement report (Q1 2027), and the next US price increase, since most of the US growth is now price.
One-Pager
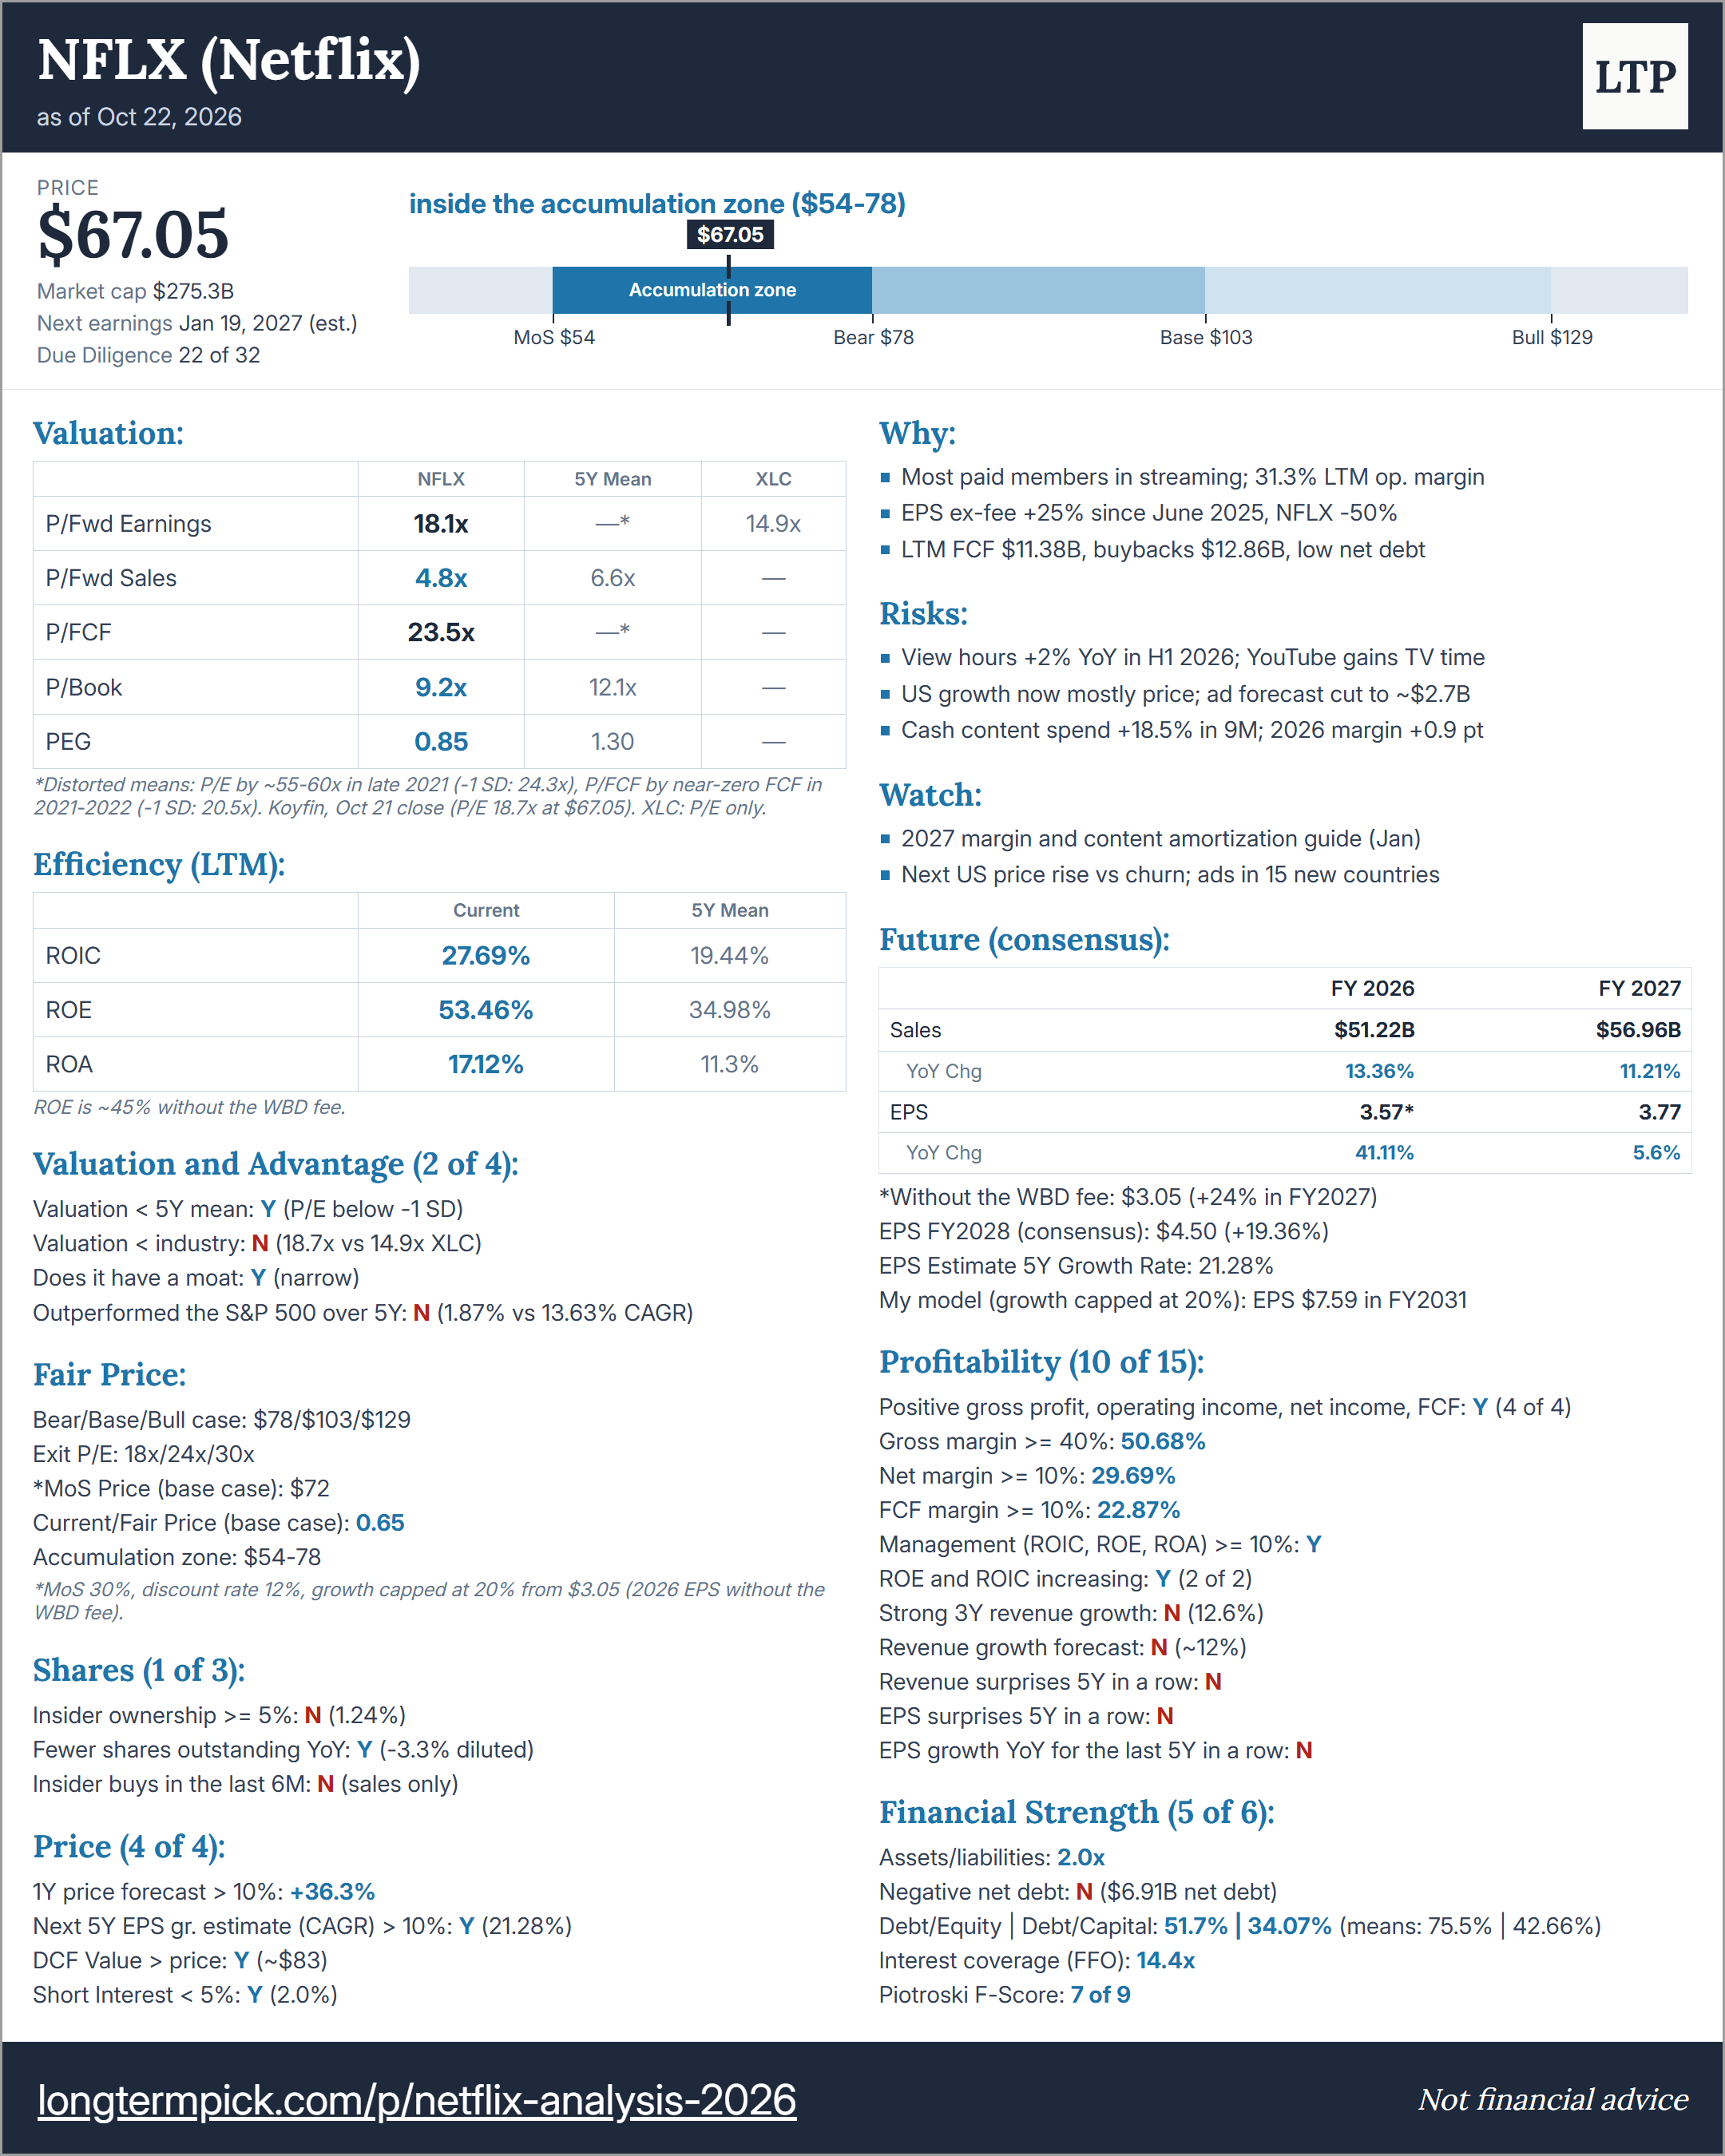
This is not a financial or investing recommendation. It is solely for educational purposes.