

TL;DR: This is my monthly watchlist recheck, with prices as of the Nov 11 close; 4 of the 10 names report in the next 4 weeks. Two names left the list: Netflix moved into the portfolio, and Pinterest failed one of my quality tests. Two new ones joined: Expedia and CarGurus. 6 of the 10 are in their buy zones; CARG, a new name, is the deepest, 23% below its zone. The zones themselves changed too; from this issue on, they follow my Manifest again (30% below the Base Case). The month was not quiet. APP is up 45% since Watchlist #002, while CRDO and ALAB are both down a third. As I see it, the reports mostly confirmed the estimates, but HubSpot warned about 2027, and Insulet cut its 2027 outlook. The prices moved much more than the numbers.
How this issue works
The method is the same as in Watchlist #002: consensus EPS for 2026, grown for 5 years at the consensus growth rate plus the dividend yield (capped at 20% total), multiplied by three exit P/E multiples, then discounted at 12% per year. Fair price = the Base Case. AppLovin and Credo keep the models from their full analyses. The forward P/E in the text uses NTM EPS, as in the Koyfin charts; the model sheets show price over each year’s EPS, so their P/E differs slightly.
The exit multiples get reset only after a report, so for a name without a new report, they can differ from today’s chart. The Bear Case takes today’s multiple or the -1 standard deviation band (one standard deviation below the 5Y mean P/E), whichever is lower. The Base Case takes the 5Y mean, and the Bull Case takes the +1 band. All three are rounded down to a whole multiple and capped at 30x. When every historical anchor is above 30x, the multiples are 20x/25x/30x, which is a PEG of 1.0/1.25/1.5 at my 20% growth cap.
What changed is the buy zone. It is now the Base Case fair price x 0.7, per my Manifest rule. On the model sheets, it is the Base Case MoS price.
Analyst’s note:
In Watchlist #001 and #002, I used the Bear Case fair price as the buy zone. My Manifest rule is 30% below the Base Case, and I’ve used this since 2021. Portfolio #004 has already returned to it, and from this issue on, the watchlist follows the same rule. For most names, the zone moves by 5-14%; for APP, by 46%. For two of them, the change decides the status: APP is in its zone only under the new rule, and CRDO would be in its zone only under the old one. With both rules, the count is the same: 6 of 10.
The list itself also changed. NFLX was in its buy zone in both earlier issues; the full analysis came out on Oct 27, and the stock moved into the portfolio (the details are in Portfolio #004). Pinterest leaves for a different reason, explained at the end. Expedia and CarGurus are new. I use two screens: quality compounders and emerging growth for younger businesses still building margins.
ADSK
Next earnings: Nov 24 (confirmed)
Fair price: $440
Buy zone: up to $308
Curr Price/Fair Price: 0.59 (41% undervalued)
PEG: 1.23
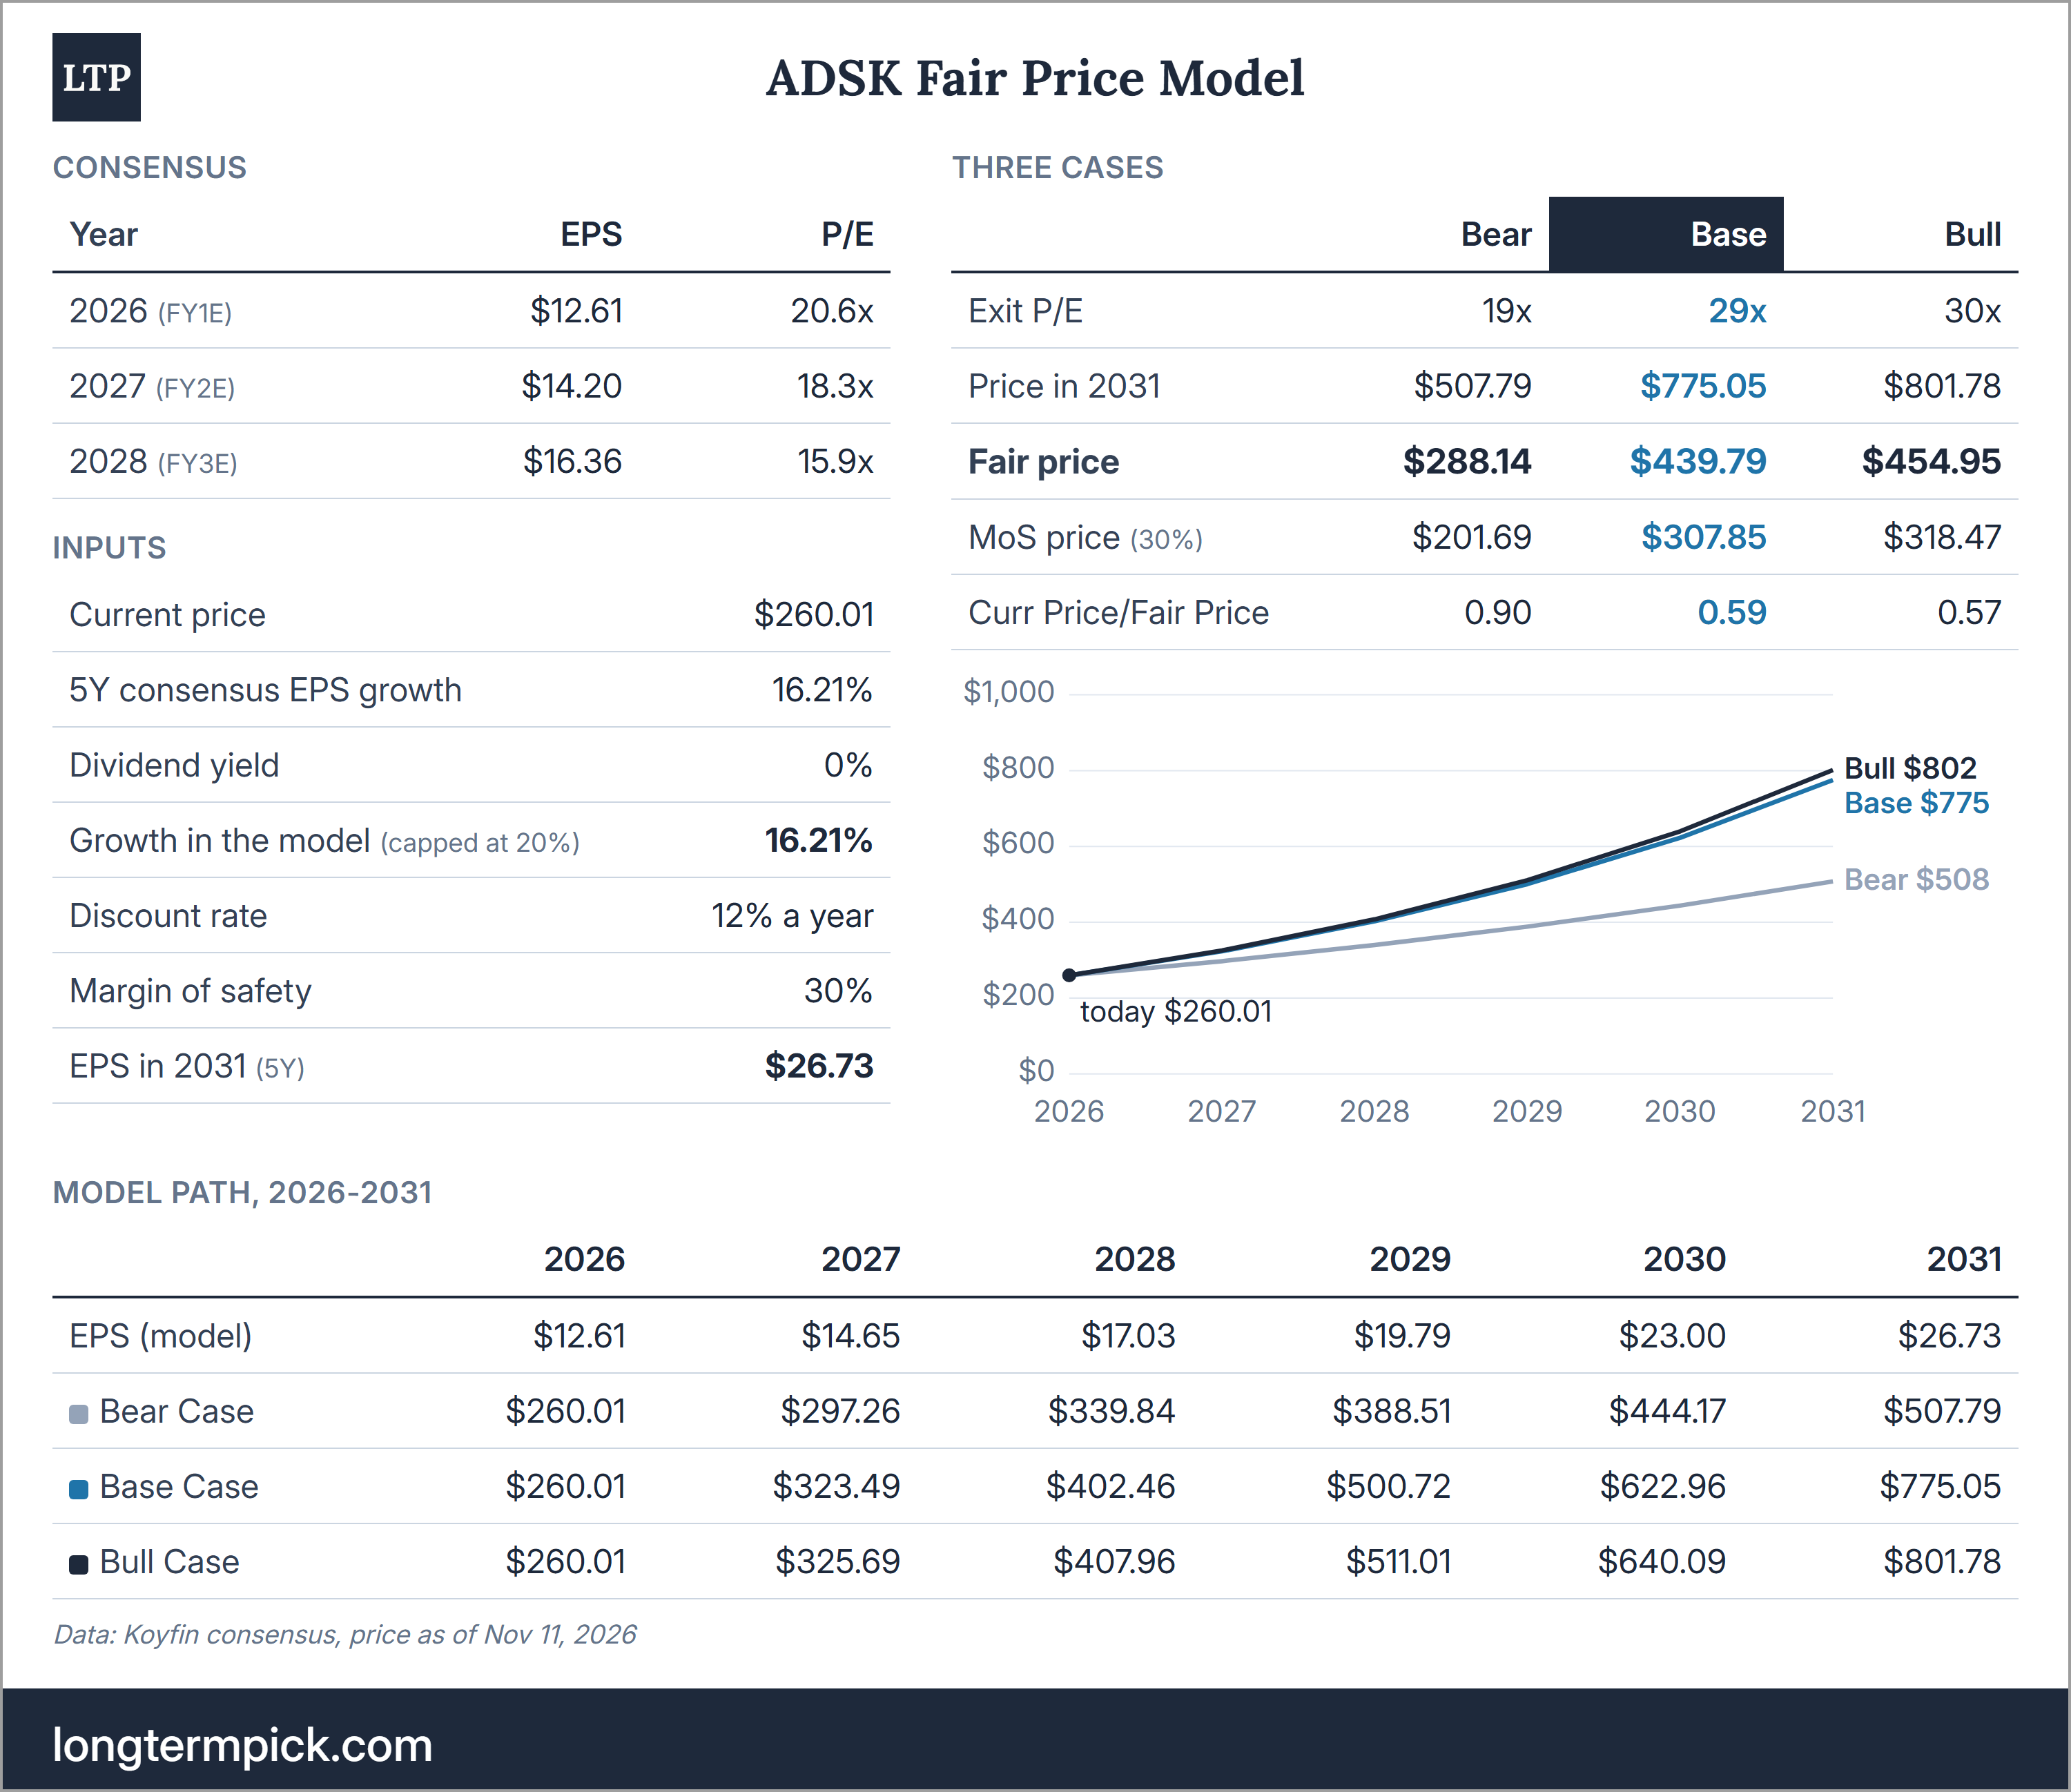
Autodesk (ADSK) makes design and engineering software (AutoCAD, Revit, Fusion) and sells it as subscriptions. Since #002, the stock has increased 11.3%, from $233.60 to $260.01. At the same time, the estimates barely moved. The 2026 EPS is still $12.61, the 2028 EPS moved from $16.46 to $16.36, and the 5Y estimate stayed at 16.21%. The business is excellent: 92.5% gross margin, 36% FCF margin, and 27% ROIC.
So the fair prices did not change: $288/$440/$455. Autodesk has not reported since #002, so the exit multiples stay at 19x/29x/30x from that issue, not today’s 20.0x and 28.2x. The new rule moves the buy zone from $288 to $308, and at $260.01, the stock is 16% below it. PEG is 1.23, the highest on the list. Autodesk has the slowest expected growth here (16.21%), so even at 20x, I pay more for each point of growth than for any other name.
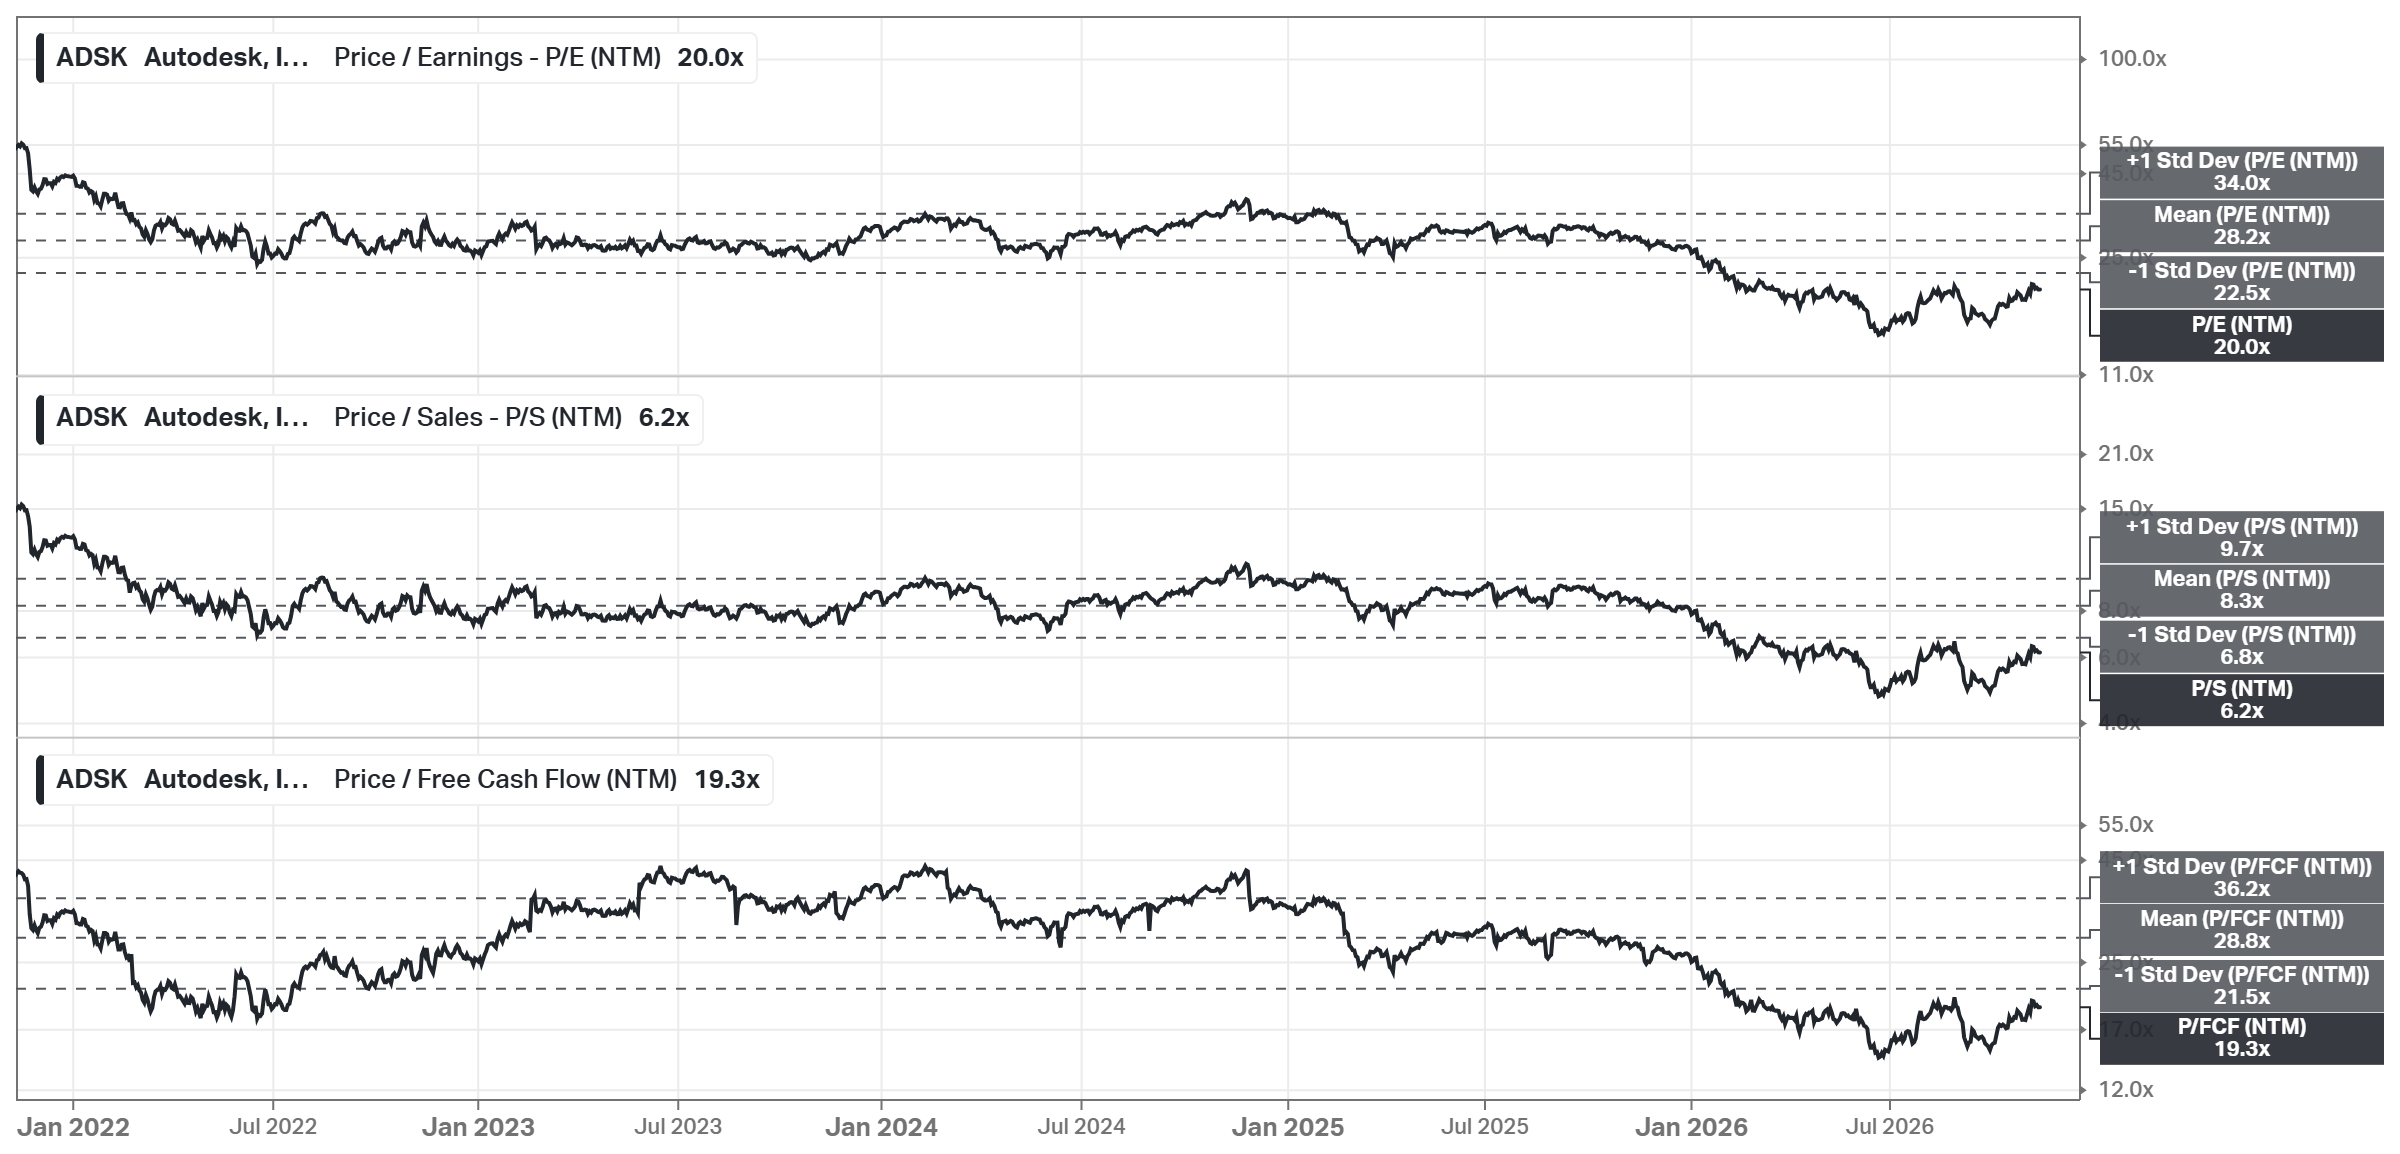
The stock is at 20.0x forward earnings, against a 28.2x 5Y mean and a 22.5x -1 standard deviation band. It has been below that band for most of 2026; in the 4 years before, it never traded this low. The derating came mostly from expectations: the 5Y growth estimate is 16.21% today, against ~24% on average over the last 5 years. Several times this year, ADSK fell with other software names amid AI fears, for example on Feb 03 and Sep 04 (-8%, along with Adobe, PTC, and Bentley).
The reported numbers held up better: revenue grew 16% in the Q2 report, and the non-GAAP operating margin reached 41%. Still, billings growth slowed from 33% in Q4 to 10% in Q2. In May, with the Q1 report, Autodesk also agreed to buy MaintainX, a maintenance and operations software company, for ~$3.6B in cash (~27x its expected annual recurring revenue of over $135M, which grows above 50%). The next day, ADSK fell 4%. This suggests the market disliked the price; in August, the CFO called MaintainX “a drag on operating margin”.
What I watch: the 5Y growth estimate after the Nov 24 report. It is below my 20% cap, so the model takes it as is, and every percentage point less takes ~$19 (~4%) off the Base Case fair price. Additionally, on the same call, the CFO said that this year’s growth has a benefit from the new transaction model “that will not recur in fiscal 2028”, so the first look at fiscal 2028 (February 2027 to January 2028, the 2027 column of my model) matters as much as the quarter. After the report, the multiples also reset; on today’s chart, they would be 20x/28x/30x, and the zone would move to ~$297, with ADSK still ~13% below it.
Below are the other 9 entries; 5 of them are in their buy zones. The deepest discount on the list is a new name, and the cheapest stock by P/E isn’t in its zone yet. After the entries: what the screens found, why Pinterest leaves, which names I rejected and why, and the whole list in one table.
