
Updated Valuations: LRCX, FSLR, MEDP, V, GOOGL, and MSFT
Updated valuations of companies covered by Long-Term Pick after the latest quarter earnings reports.

In October, some companies covered by Long-Term Pick released their quarterly earnings reports. It's time to update their valuations and review the latest reports. Some explanations regarding screenshots with fair price estimates:
I marked cells that I updated as grey (after the latest earning reports)
Fair-to-Current Price and Current Price/Fair Price: green - undervalued, blue - fairly valued, yellow - overvalued
Some Future EPS Growth marked as green means that the projected earnings growth is even higher; 20% is my maximum
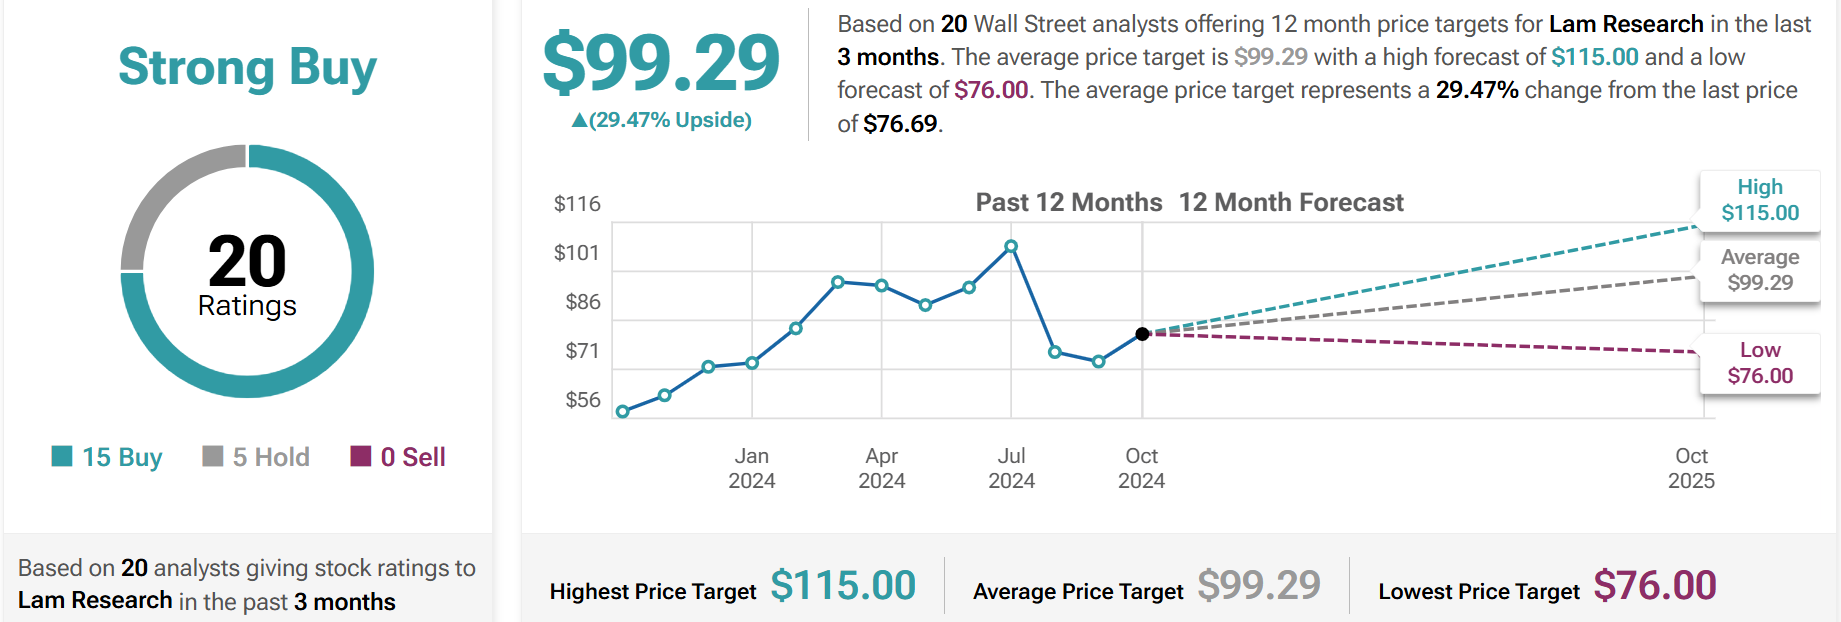
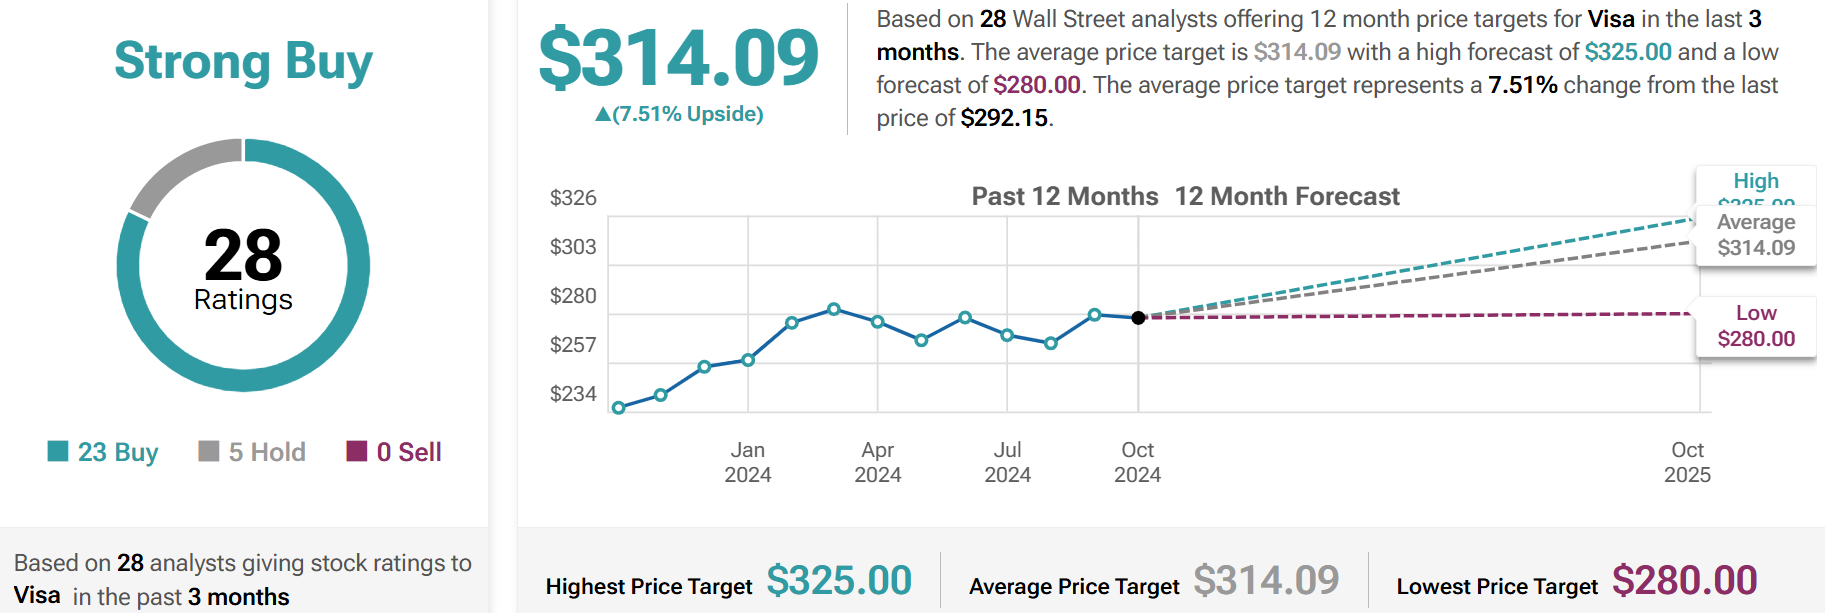
Additionally, I included updated current valuations alongside their 5-year averages for easy comparison. I also added average future price estimates from other analysts to compare with my Base Fair Price Estimates.
Since its inception, the Long-Term Pick Portfolio has outperformed the S&P 500. Consider supporting the project by becoming a patron on Patreon, which will grant you access to the portfolio and other premium investment ideas. This will push me to produce more valuable content for you.
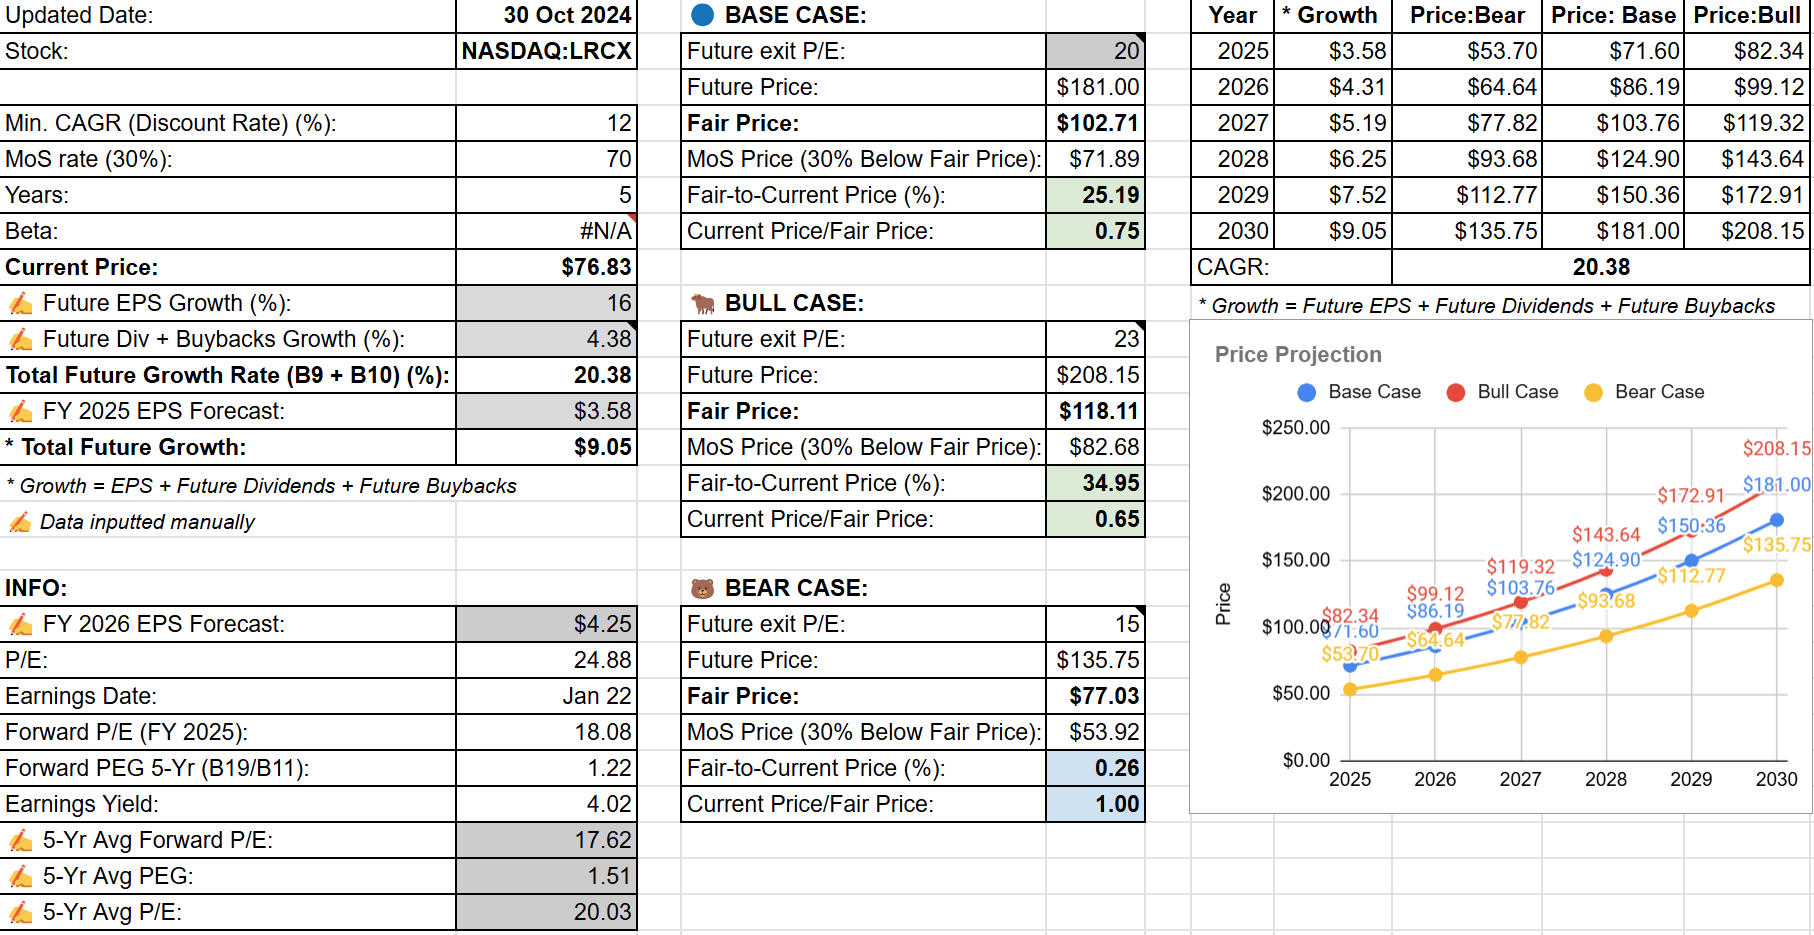
Lam Research (LRCX): Undervalued 🟢

🏷️ Updated Valuation
Latest earnings report (October 23, 2024):
✍️ Summary
Revenue: $4.17 billion for the September quarter, an 8% increase from the prior quarter.
Gross Margin: 48.2%, exceeding the guided range.
Operating Margin: 30.9%, above the high end of the guidance range.
Free Cash Flow: $1.46 billion, representing 35% of revenue.
Deferred Revenue: $2.05 billion, an increase of $495 million from the June quarter.
Customer Support Business Group Revenue: Approximately $1.8 billion, up 4% from the June quarter.
China Revenue Contribution: 37% of total revenue, down from 39% in the prior quarter.
Dividends Paid: $261 million in the September quarter.
Share Repurchases: Approximately $1 billion allocated to open market share repurchases.
Cash and Cash Equivalents: $6.1 billion at the end of the September quarter.
Inventory: $4.2 billion, with inventory turns improving to 2.1 times.
Capital Expenditures: $111 million for the September quarter.
Headcount: Approximately 17,700 regular full-time employees, an increase of about 500 from the prior quarter.
👍 Positive Points
Lam Research posted a strong September quarter with revenues and earnings per share exceeding the midpoint of guidance.
The company achieved its fifth consecutive quarter of revenue growth, indicating strong execution despite a challenging industry environment.
LRCX is well-positioned to benefit from technology upgrades in NAND, which is expected to drive spending recovery.
The company is seeing strong momentum in advanced packaging, with SABRE 3D revenue more than doubling this year.
LRCX is experiencing strong customer demand for productivity enhancements and equipment intelligence services, with increased adoption of its offerings.
👎 Negative Points
Domestic China WFE is expected to decline in the second half of the year, impacting LRCX's revenue from the region.
Gross margin decreased slightly due to a decline in customer mix and increased incentive compensation.
Operating expenses increased due to higher program spending and incentive compensation, impacting profitability.
The NAND segment has experienced a prolonged down cycle, with spending expected to increase only in 2025.
Lam Research anticipates a headwind in customer mix affecting gross margins due to a lower percentage of revenue from China.
💲Current Valuation

📈 Price Forecast
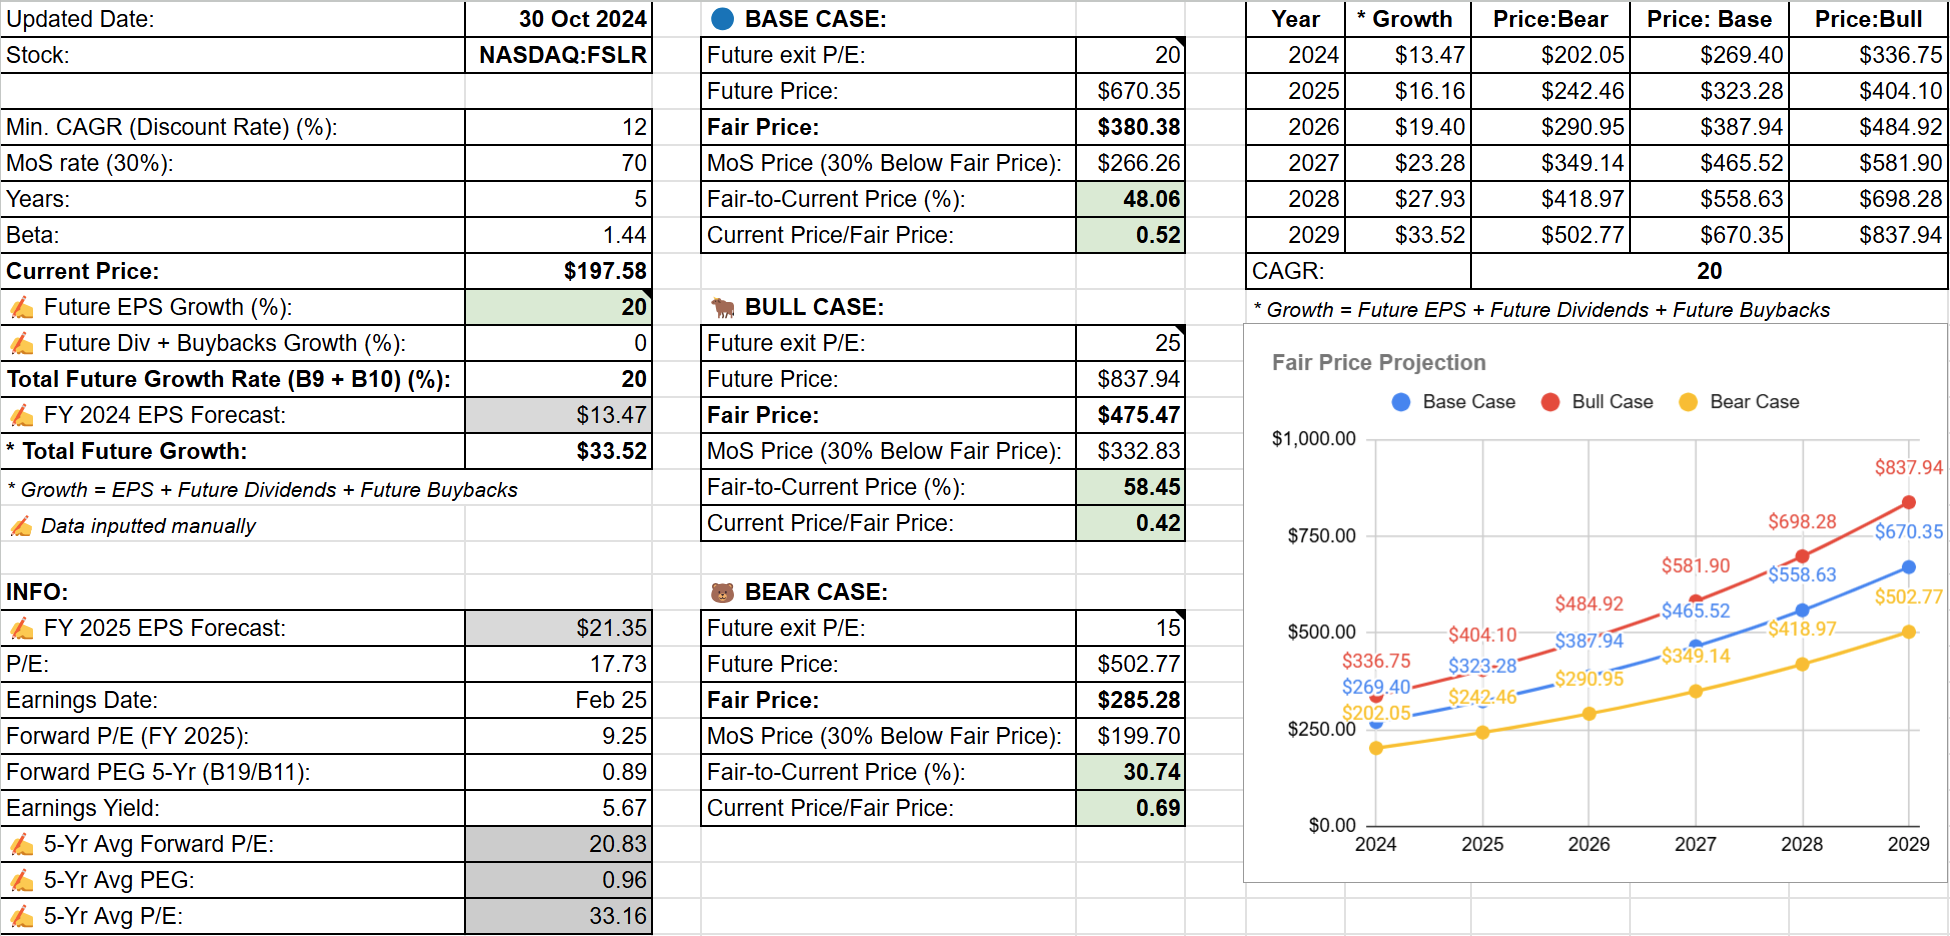
First Solar (FSLR): Undervalued 🟢

🏷️ Updated Valuation
Latest earnings report (October 29, 2024):
✍️ Summary
Revenue: $0.9 billion for the third quarter.
Gross Margin: 50% in the third quarter.
Net Income: Earnings per diluted share of $2.91.
Product Warranty Charge: $50 million due to manufacturing issues.
Contracted Backlog: 73.3 gigawatts with an aggregate value of $21.7 billion.
Production: Record quarterly production of 3.8 gigawatts.
Cash and Cash Equivalents: $1.3 billion at the end of the quarter.
Total Debt: $582 million at the end of the third quarter.
Cash Flows Used in Operations: $54 million in the third quarter.
Capital Expenditures: $434 million during the period.
Full-Year Earnings Guidance: $13 to $13.50 per diluted share.
Full-Year Net Sales Guidance: $4.1 billion to $4.25 billion.
👍 Positive Points
First Solar achieved a record quarterly production of 3.8 gigawatts, demonstrating strong manufacturing capabilities.
The company inaugurated a new $1.1 billion Alabama facility, adding 3.5 gigawatts of solar manufacturing capacity, with plans for further expansion in Louisiana.
First Solar has a robust contracted backlog of 73.3 gigawatts, providing long-term revenue visibility.
The company is launching CuRe production, aiming to enhance its technology offerings and capture additional revenue through contractual adjusters.
First Solar was recognized by MIT Technology Review and Time Magazine for its leadership in solar technology and innovation.
👎 Negative Points
FSLR faced a $50 million product warranty charge due to manufacturing issues with its Series 7 product.
The company experienced operational challenges, including hurricanes and logistical disruptions, impacting financial performance.
There is ongoing pressure from Chinese dumping in the Indian market, leading to depressed ASPs and strategic shifts in production.
First Solar had to terminate a contract with Plug Power due to project delays, impacting its bookings.
The company is facing intellectual property challenges within the solar manufacturing sector, particularly related to TOPCon patents.
💲Current Valuation

📈 Price Forecast

Medpace (MEDP): Undervalued 🟢

🏷️ Updated Valuation

Latest earnings report (October 22, 2024):
✍️ Summary
Revenue: $533.3 million for Q3 2024, an 8.3% year-over-year increase.
Net New Business Awards: $533.7 million, a 12.7% decrease from the prior year.
Ending Backlog: Approximately $2.9 billion as of September 30, 2024, an 8.8% increase from the prior year.
Backlog Conversion: 18.2% of beginning backlog in Q3 2024.
EBITDA: $118.8 million for Q3 2024, a 31.7% increase from Q3 2023.
EBITDA Margin: 22.3% for Q3 2024, compared to 18.3% in the prior year period.
Net Income: $96.4 million for Q3 2024, a 36.7% increase from the prior year period.
Net Income Per Diluted Share: $3.01 for Q3 2024, compared to $2.22 in the prior year.
Cash Flow from Operating Activities: $149.1 million in Q3 2024.
Cash Balance: $656.9 million as of June 30, 2024.
2024 Revenue Guidance: $2.09 billion to $2.13 billion, representing growth of 10.8% to 12.9% over 2023.
2024 EBITDA Guidance: $450 million to $470 million, representing growth of 24.1% to 29.7% over 2023.
2024 Net Income Guidance: $376 million to $388 million.
2024 Earnings Per Diluted Share Guidance: $11.71 to $12.09.
👍 Positive Points
Revenue for the third quarter of 2024 was $533.3 million, representing a year-over-year increase of 8.3%.
EBITDA for the third quarter increased by 31.7% compared to the same period in 2023, reaching $118.8 million.
Net income for the third quarter rose by 36.7% year-over-year, driven by interest income and partially offset by a higher effective tax rate.
Ending backlog as of September 30, 2024, was approximately $2.9 billion, an increase of 8.8% from the prior year.
The company expects to convert approximately $1.62 billion of backlog into revenue over the next 12 months, indicating strong future revenue potential.
👎 Negative Points
Backlog cancellations in Q3 were above the usual range, marking three consecutive quarters of elevated cancellations.
Net new business awards decreased by 12.7% from the prior year, resulting in a net book-to-bill ratio of 1.0 for the quarter.
The elevated cancellations are expected to depress reported net backlog awards in Q4 and Q1 of 2025.
RFPs were down modestly on a year-over-year and sequential basis, indicating a potential slowdown in new business opportunities.
Gross bookings were lower in the quarter due to prior cancellations, impacting the overall business momentum.
💲Current Valuation

📈 Price Forecast

Visa (V): Undervalued 🟢

🏷️ Updated Valuation

Latest earnings report (October 29, 2024):
✍️ Summary
Net Revenue: $9.6 billion, up 12% year-over-year.
EPS: Up 16% year-over-year.
Payment Volume Growth: 8% year-over-year in constant dollars.
US Payment Volume Growth: 5% year-over-year.
International Payment Volume Growth: 10% year-over-year.
Cross-Border Volume Growth (excluding intra-Europe): 13% year-over-year.
Processed Transactions Growth: 10% year-over-year.
New Flows Revenue Growth: 22% year-over-year in constant dollars.
Visa Direct Transactions Growth: 38% year-over-year.
Commercial Payments Volume: $1.7 trillion, with 5% growth year-over-year.
Value Added Services Revenue Growth: 22% year-over-year in constant dollars.
Operating Expenses Growth: 11% year-over-year.
Stock Buyback: Approximately $5.8 billion in Q4.
Dividends Distributed: Over $1 billion in Q4.
Remaining Buyback Authorization: $13.1 billion at the end of September.
👍 Positive Points
Visa reported strong financial results for the fourth quarter, with net revenue of $9.6 billion, up 12% year-over-year, and EPS up 16%.
The company saw significant growth in cross-border volume, excluding intra-Europe, which rose 13%, and processed transactions grew 10% year-over-year.
Visa continues to expand its consumer payments business, with over 4.6 billion credentials, up 7% year-over-year, and 11.5 billion tokens, with more than 30% of total transactions tokenized.
The company has made significant strides in new flows, with revenue growing 22% year-over-year in constant dollars, and Visa Direct transactions increasing by 38%.
Visa has successfully renewed and expanded several key partnerships globally, including agreements with major clients like Grupo Pramerica, SMCC, Alrajhi, and Standard Chartered Bank.
👎 Negative Points
Visa faces regulatory challenges, including a lawsuit by the Department of Justice, which the company believes is meritless.
The company experienced slower growth in Asia Pacific payments volume, primarily due to macroeconomic conditions, particularly in Mainland China.
Cross-border travel volume growth was lower than expected, mainly due to challenges in Asia Pacific travel corridors.
Visa anticipates a significant increase in client incentives in fiscal 2025, which could impact net revenue growth.
The company expects a step down in adjusted net revenue growth from Q4 2024 to Q1 2025 due to various factors, including increased incentives and the timing of pricing actions.
💲Current Valuation

📈 Price Forecast
Alphabet (GOOGL): Undervalued 🟢

🏷️ Updated Valuation
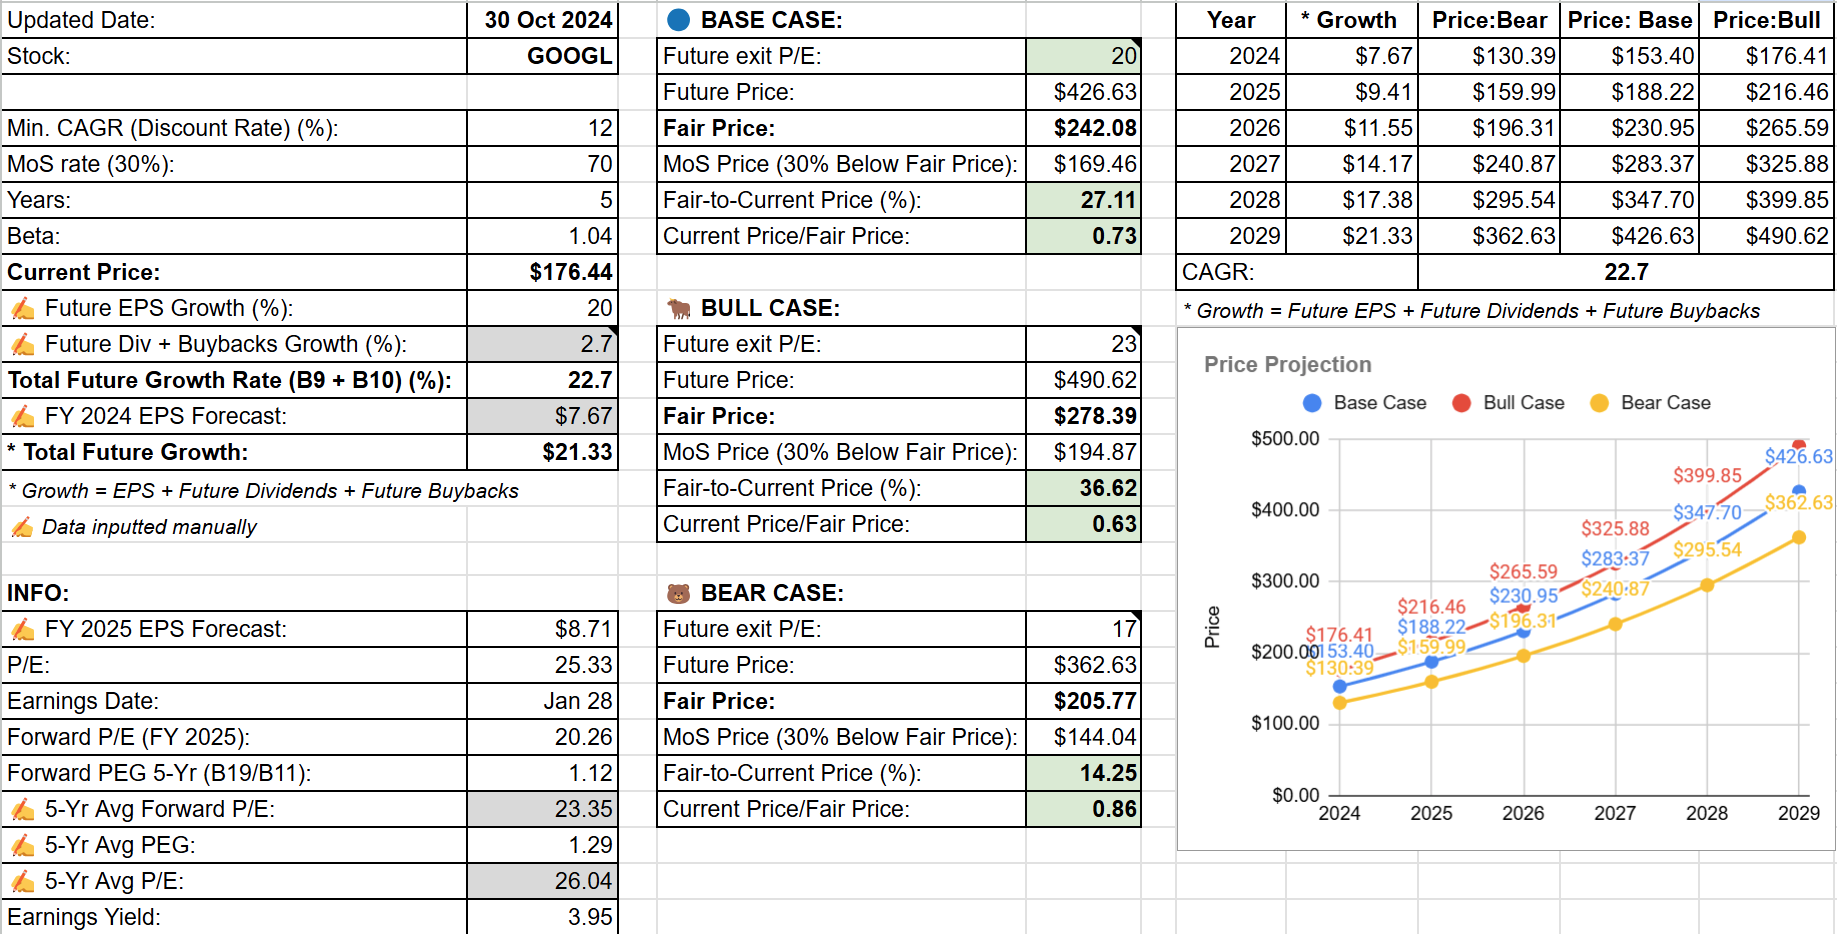
Latest earnings report (October 29, 2024):
✍️ Summary
Consolidated Revenue: Increased by 15% year-over-year, or 16% in constant currency.
Google Services Revenue: $76.5 billion, up 13% year-over-year.
Google Search and Other Advertising Revenue: $49.4 billion, up 12% year-over-year.
YouTube Advertising Revenue: $8.9 billion, up 12% year-over-year.
Google Cloud Revenue: $11.4 billion, up 35% year-over-year.
Operating Income: Increased 34% to $28.5 billion.
Operating Margin: Increased to 32%.
Net Income: Increased 34% to $26.3 billion.
Earnings Per Share (EPS): Increased 37% to $2.12.
Free Cash Flow: $17.6 billion for the third quarter.
Cash and Marketable Securities: $93 billion at the end of the quarter.
Google Cloud Operating Income: $1.9 billion, with an operating margin of 17%.
Other Bets Revenue: $388 million with an operating loss of $1.1 billion.
Capital Expenditures (CapEx): $13 billion, primarily in technical infrastructure.
Share Repurchases and Dividends: $15.3 billion in share repurchases and $2.5 billion in dividend payments.
👍 Positive Points
Alphabet reported a 15% increase in consolidated revenue, with Google Cloud revenue growing by 35% year-over-year.
The company has made significant advancements in AI, with the Gemini models being integrated across all major products and platforms, reaching over 1 billion users.
YouTube's combined ad and subscription revenue surpassed $50 billion over the past four quarters, driven by strong growth in YouTube TV, NFL Sunday Ticket, and YouTube Music Premium.
Alphabet is making substantial investments in clean energy, including a corporate agreement to purchase nuclear energy, supporting its commitment to sustainability.
The company is seeing strong engagement and increased search usage with the rollout of AI Overviews to over 100 new countries and territories.
👎 Negative Points
Network advertising revenue declined by 2% year-over-year, indicating challenges in this segment.
The company faces potential legal challenges from the DOJ, which could impact its search agreements with partners like Apple.
Alphabet is experiencing increased costs, with total cost of revenue up by 10% and operating expenses rising by 5%.
There is a headwind to year-over-year growth in subscription platforms and devices revenue due to the pull forward of Made by Google launches.
The company is facing increased competition in the AI space, with a need to continuously innovate to maintain its leadership position.
💲Current Valuation
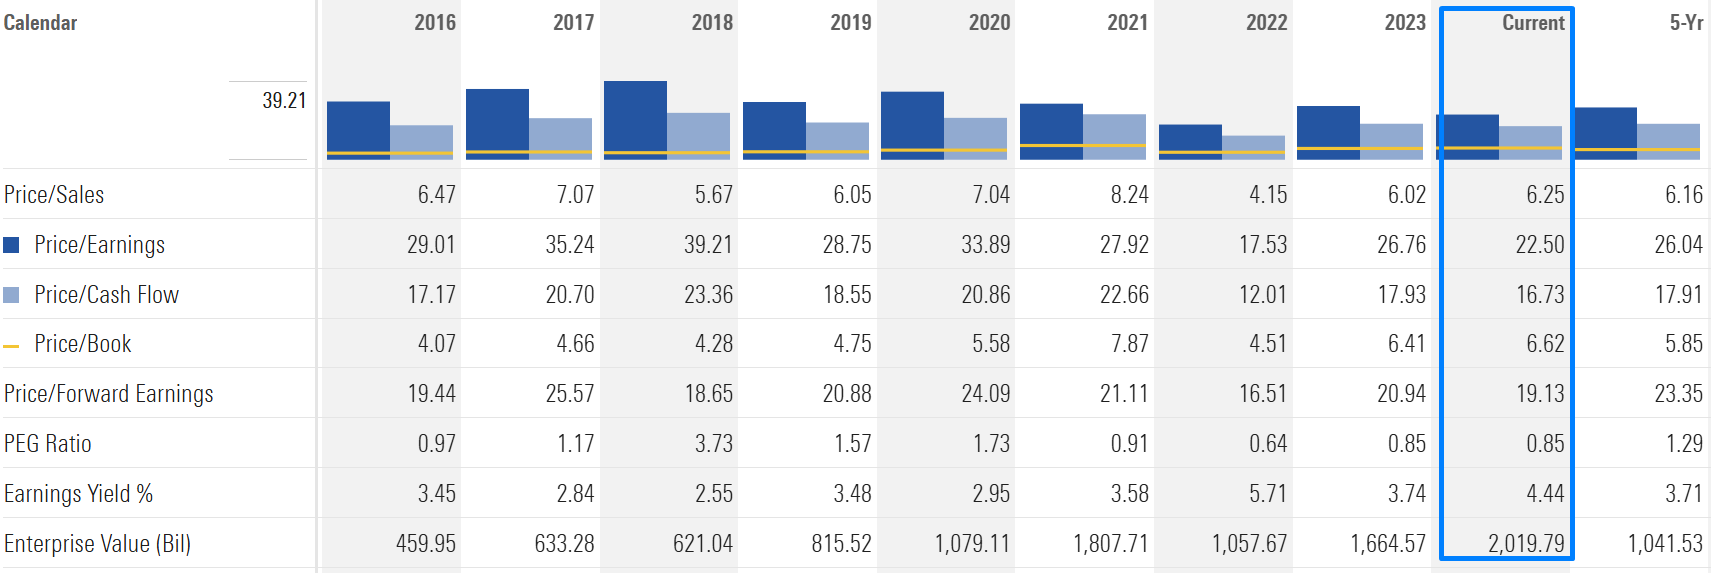
📈 Price Forecast

Microsoft (MSFT): Fairly Valued 🔵
I have not written an MSFT analysis but keep it in the Long-Term Pick Portfolio.
🏷️ Updated Valuation

Latest earnings report (October 30, 2024):
✍️ Summary
Revenue: $65.6 billion, up 16%.
Earnings Per Share (EPS): $3.30, an increase of 10%.
Microsoft Cloud Revenue: $38.9 billion, up 22%.
Commercial Bookings: Increased 30% and 23% in constant currency.
Commercial Remaining Performance Obligation: $259 billion, up 22% and 21% in constant currency.
Operating Income: Increased 14%; operating margins at 47%.
Productivity and Business Processes Revenue: $28.3 billion, up 12% and 13% in constant currency.
Intelligent Cloud Revenue: $24.1 billion, up 20% and 21% in constant currency.
Azure and Other Cloud Services Revenue: Grew 33% and 34% in constant currency.
More Personal Computing Revenue: $13.2 billion, up 17%.
Gaming Revenue: Increased 43% and 44% in constant currency.
Free Cash Flow: $19.3 billion, down 7% year over year.
Capital Expenditures: $20 billion.
Cash Flow from Operations: $34.2 billion, up 12%.
LinkedIn Revenue: Increased 10% and 9% in constant currency.
Dynamics Revenue: Grew 14%, driven by Dynamics 365, which grew 18% and 19% in constant currency.
👍 Positive Points
Microsoft Cloud revenue surpassed $38.9 billion, marking a 22% increase, driven by strong demand for AI and cloud services.
AI business is on track to surpass an annual revenue run rate of $10 billion next quarter, making it the fastest-growing business in Microsoft's history.
Azure and other cloud services revenue grew 33% in constant currency, with healthy consumption trends.
Microsoft 365 Copilot adoption is accelerating, with nearly 70% of the Fortune 500 using it, and customers continue to adopt it at a faster rate than any other new Microsoft 365 suite.
LinkedIn revenue increased 10%, with record engagement and growth across all lines of business.
👎 Negative Points
Microsoft Cloud gross margin percentage decreased by 2 points year over year, driven by scaling AI infrastructure.
Operating expenses increased by 12%, partly due to the Activision acquisition, impacting overall profitability.
Free cash flow decreased by 7% year over year, reflecting higher capital expenditures to support cloud and AI offerings.
Supply constraints, particularly in AI infrastructure, are impacting Azure's ability to meet demand, leading to potential growth deceleration.
The Activision acquisition had a negative $0.05 impact on earnings per share due to purchase accounting adjustments and related costs.
💲Current Valuation
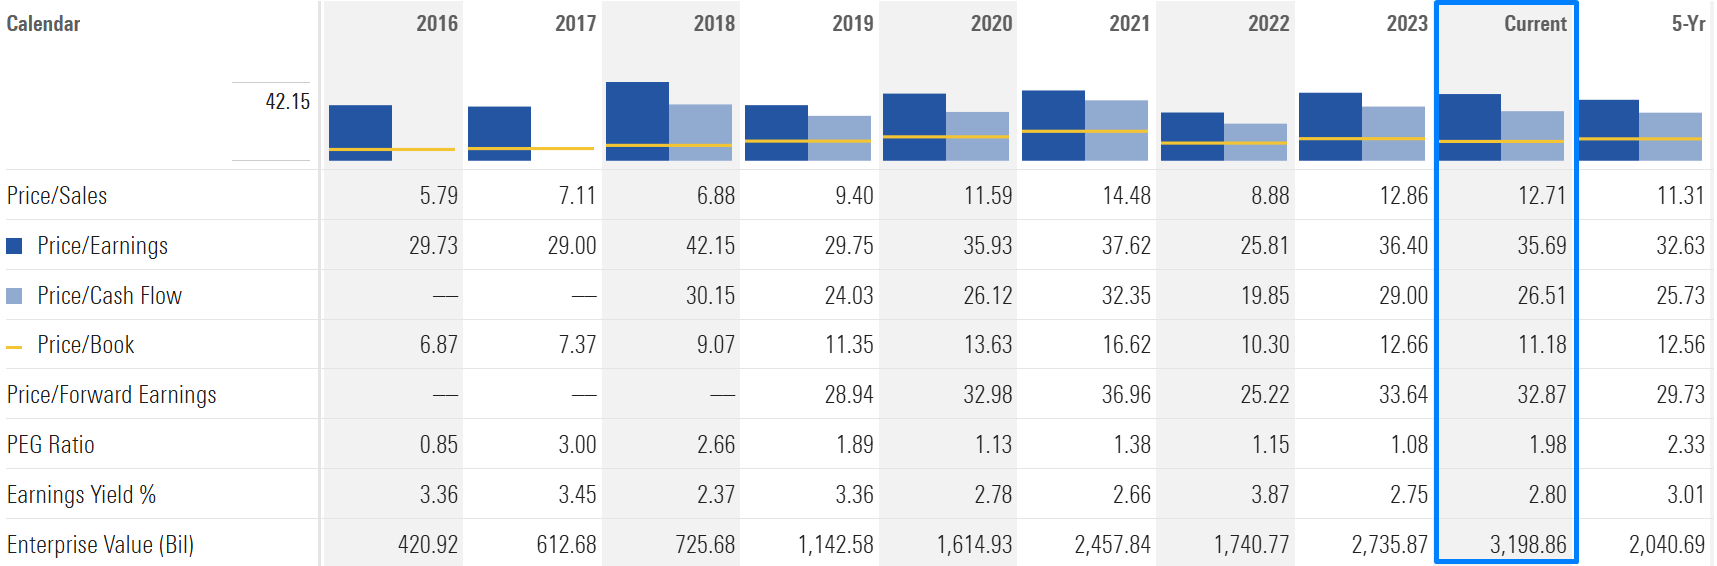
📈 Price Forecast

This is not a financial or investing recommendation. It is solely for educational purposes.
thanks for your work!!
Thank you for your answer. What I would like to point out is your assumption of 15% growth, analysts are expecting EPS of $12.7 rather than $13.7 for FY25, which equates to 6-7% earnings growth. What makes me positive though is that they have regularly raised the outlook over the last few years and exceeded various analyst expectations.